Hawke’s Bay Regional
Council
Council
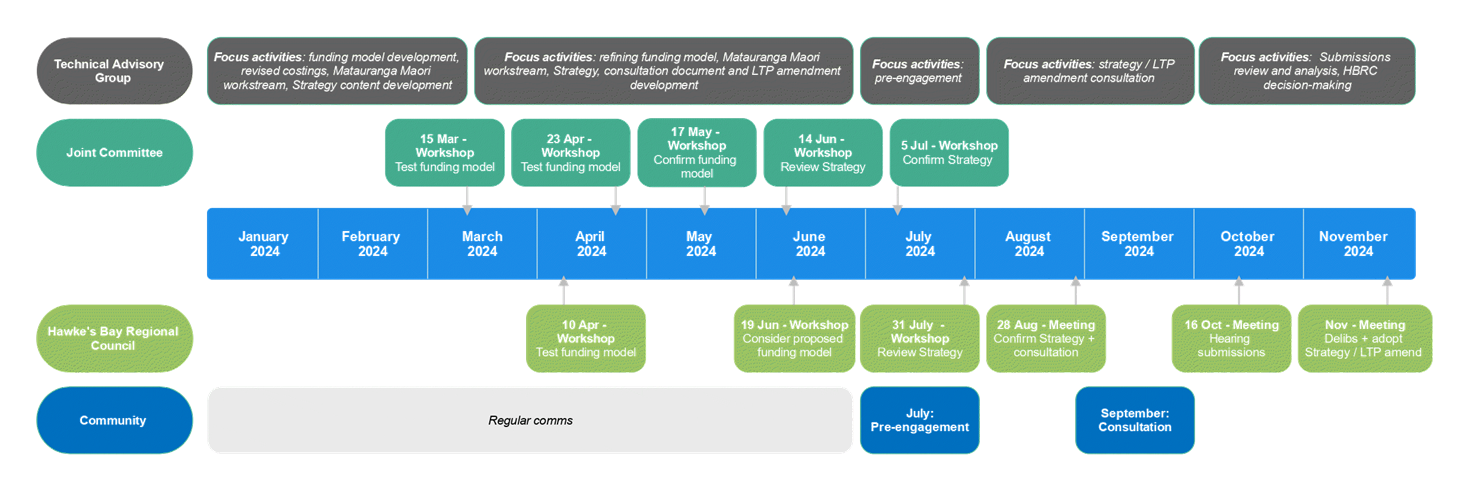
Workshop
19 June
2024
Subject: Funding model for the Clifton
to Tangoio Coastal Hazards Strategy implementation
Reason for report
1. This workshop follows the
one held on 10 April 2024 and provides the opportunity for Council to receive
and workshop recommendations from the Joint Committee on a funding model for
Strategy implementation, ahead of formal consideration by the Council on 24
July.
2. Direction is also sought on
whether any additional workshops before the 24 July meeting are
required for further funding model development and refinement.
Background
3. The Council (and in
parallel the Joint Committee) is working to a schedule of meetings and
workshops to develop and confirm the Clifton to Tangoio Coastal Hazards
Strategy for public consultation in October 2024.
4. Attachment 1 provides the current
timeline that captures this process.
5. Today’s workshop is
the second with Council this year. It follows a series of Joint Committee
workshops which focused on funding model development:
5.1. 12 May 2023 – confirm
legislative requirements and principles.
5.2. 10 November 2023 –
present two test case coastal units to demonstrate a potential funding model
approach.
5.3. 15 March 2024 –
workshop full funding model.
5.4. 23 April 2024 –
present revisions to the funding model in response to feedback.
5.5. 17 May 2024 - confirm
recommendations for HBRC.
6. The funding
model uses Tonkin & Taylor’s assessment of reduced risk to individual
properties for both erosion and inundation as discussed at the previous
workshop. The T&T assessment groups properties into Class 1, 2, 3 or high,
medium, low. Maps of these groupings will be made available at the
workshop.
7. The funding
model will enable the Council to see the impact of the initial allocation of
costs developed by the Joint Committee on average, outlier and specific properties
(if required).
8. The Council can
then modify the initial allocation in the dynamic model if it considers the
impacts are too great at a property level.
9. Indicative costs and rates
based on recent (2024) cost estimates for the proposed interventions are likely
to be as presented in Table 1 below.
Table 1: Strategy
Implementation Costs - Short Term
|
|
2023-24
|
2024-25
|
2025-26
|
2026-27
|
2027-28
|
|
Annual opex
|
|
|
|
|
|
|
Existing
|
592,562
|
576,363
|
578,835
|
578,835
|
188,640
|
|
Additional
|
|
operational expenditure including the following:
|
|
100,000
|
500,000
|
500,000
|
4,717,000
|
|
Consenting
|
All units
|
|
100,000
|
500,000
|
500,000
|
|
|
Direct
|
Bayview
|
|
|
|
|
474,000
|
|
Westshore
|
|
|
|
|
1,512,000
|
|
Haumoana
|
|
|
|
|
912,000
|
|
Te Awanga
|
|
|
|
|
1,819,000
|
|
Interest (Total)
|
|
|
|
|
619,185
|
|
Non Cash
|
Allowance for decommission costs
|
|
|
4,600
|
|
Loan repayments
|
|
|
|
|
322,869
|
|
Proposed recovery of Total
Rates & existing recovery ex NCC
|
592,562
|
676,363
|
1,078,835
|
1,078,835
|
5,852,294
|
|
Capex
|
Haumoana
|
|
|
|
5,082,325
|
|
|
Te Awanga
|
|
|
|
6,175,584
|
|
|
Loan funding and loan balance
|
|
|
|
11,257,909
|
10,935,040
|
Additional
notes
9.1. Existing
costs at Westshore ($592k) are currently split equally between NCC and HBRC
9.2. New OPEX
in years 1 – 3 are for detailed design and consenting + other Strategy
implementation tasks.
9.3. Year 4
costs include HBRC taking on 100% of Westshore nourishment costs
9.4. Costs
estimates are conservatively high e.g. assumed worst case scenario for
locations for gravel supply, but include many variables and uncertainties
17
May Joint Committee Workshop Outcomes
10. At the last workshop on 17
May, the Joint Committee confirmed the following to be considered by the
Council:
10.1. The overarching rationale
to apply for funding allocations (discussed further below);
10.2. The rationale for specific
allocations within each unit; and
10.3. That because the primary
benefit of the strategy works is maintaining the value of properties including
improvements, the recovery of the costs in each unit should be based on the capital
value of each property being protected and the associated level of reduced
risk.
10.4. The approach favored by the
Joint Committee is to develop a bespoke funding model for each costal unit,
given the unique characteristics, interventions and costs at each location. An
alternative was considered, in which northern and southern units are grouped
together to form a northern and southern cell (Northern cell including Bayview
and Westshore and Southern cell including Haumoana and Te Awanga). This
alternative, while it will be presented in today’s workshop, was not
supported by the Joint committee because of the different levels of expenditure
and benefit within each unit.
The overarching rationale
11. As noted in paragraph 10.1
above, a key outcome of 17 May Joint Committee workshop was to confirm an
overarching rationale for apportioning costs for Strategy implementation.
12. This overarching funding
rationale for each proposed coastal hazard mitigation project is summarised as
follows:
12.1. 70% of the cost to implement
the works are proposed to be met by all properties within the unit. These costs
are then allocated to individual properties based on three categories being
high, medium or low. The category assigned is based on type of works, number of
rateable properties within each category, and the differential between the
categories.
12.1.1. High = currently exposed to
inundation risk. Currently exposed to erosion risk. Direct and
significant benefit from the proposed Strategy works.
12.1.2. Medium = currently exposed
to inundation risk. Exposed to erosion risk in future. Direct benefit
from the proposed Strategy works.
12.1.3. Low = some exposure to
current inundation risks. Exposed to erosion risk in the longer term. Indirect
benefits from the proposed Strategy works.
12.2. 25% of the cost to implement
the works are proposed to be met by the subregion (Napier & Hastings), as
the works preserve the value of council amenities that are close to the unit.
12.3. The remaining 5% is
allocated to the whole region (including Wairoa & CHB), as there are assets
that benefit the region that will be protected by the Coastal Strategy works.
13. Using this rationale as a
baseline, modifications can be made to reflect the particular circumstances
within each unit. These modifications were discussed by the Joint Committee as
follows.
Bayview
14. No reasons identified to
modify the overall approach. Propose:
14.1. 70% Unit
14.2. 25% Subregion
14.3. 5% Region.
15. The distribution of unit
costs between high, medium and low properties (to total 70%):
15.1. High - Based on the small
number of rateable properties (4) and the location of those properties, the
average value of the properties; an allocation of 8% of unit costs is
appropriate.
15.2. Moderate - Based on the
small number of rateable properties (12) and the location of those properties,
the differential of 50% between high and medium: an allocation of 12% of unit
costs is appropriate.
15.3. Low - Based on the large
number of properties, the level of benefit, and the average cost impact, the
remaining 50% of unit costs is appropriate.
Westshore
16. Modification proposed to
the regional allocation as there are additional assets (e.g. Airport) that
benefit the region that will be protected by the Coastal Strategy works. Propose:
16.1. 55% Unit
16.2. 10% Napier area
16.3. 25% Subregion
16.4. 10% Region.
17. The distribution of unit
costs between high, medium and low properties (to total 55%):
17.1. High - All properties that
are in this category are recreational or other reserves, and therefore the
benefit is received by all properties within the Napier area.
17.2. Moderate - Based on the
number of rateable properties (29) and the location of those properties, an
allocation of 5% of unit costs is appropriate.
17.3. Low - Based on the large
number of properties, the level of benefit, and the average cost impact, the
remaining 50% of unit costs is appropriate.
Haumoana
18. No reasons identified to
modify the overall approach. Propose:
18.1. 70% Unit
18.2. 25% Subregion
18.3. 5% Region.
19. The distribution of unit
costs between high, medium and low properties (to total 70%):
19.1. High - Based on the number
of rateable properties (25) and the location of those properties, the average
value of the properties; an allocation of 12.5% is appropriate.
19.2. Moderate - Based on the
number of rateable properties (42) and the location of those properties, the
differential of 60% between high and medium: an allocation of 12.5% is
appropriate
19.3. Low - Based on the large
number of properties, the level of benefit, and the average cost impact, the
remaining 45% of unit costs is appropriate.
Te
Awanga
20. No reasons identified to
modify the overall approach. Propose:
20.1. 70% Unit
20.2. 25% Subregion
20.3. 5% Region.
21. The distribution of unit
costs between high, medium and low properties (to total 70%):
21.1. High - Based on the number
of rateable properties (40) and the location of those properties, the average
value of the properties; an allocation of 15% is appropriate.
21.2. Moderate - Based on the
number of rateable properties (131) and the location of those properties, the
differential of 81% between high and medium: an allocation of 40% is
appropriate
21.3. Low - Based on the large
number of properties, the level of benefit, and the average cost impact, the
remaining 15% of unit costs is appropriate.
Summary
22. Table 2 summarises this outcome
for all units.
Table 2:Summary of
Funding Model Allocations
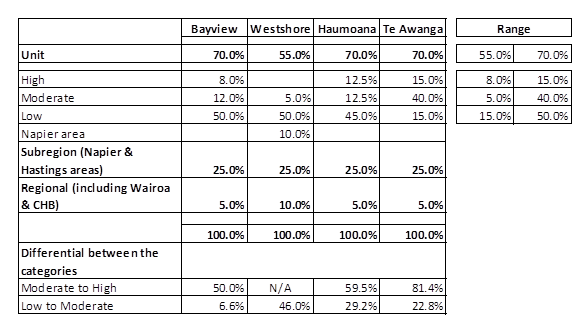
23. It is highlighted that
there was some substantial debate at the Joint Committee about the difficulty
associated with how the percentage allocations for high, medium and low benefit
properties are shown, and how these can be communicated effectively. The concern
is that the allocations appear to not follow any logical rationale e.g. at
Bayview, the proposed allocations are 8% high, 12% medium, 50% low; this
appears to suggest that the lowest benefit properties are paying the highest
proportion.
24. This outcome is a factor of
the number of properties within each category. Taking the Bayview example,
there are only 4 properties in the high benefit category, so while at a
properly level they are paying substantially more than those in the medium
category, the overall contribution to the total costs of reducing risks is only
8%.
25. This issue will be expanded
on and discussed during the workshop.
Next steps
26. It is the intention that
the current draft of the funding models and the principles that have been developed
by the Joint Committee are considered and refined in today’s workshop.
Alongside the principles, at this workshop indicative rating information will
be made available.
27. At the meeting with the
Council on 31 July, refinements as agreed today will be presented back,
together with a full consideration of rating impacts at a property scale.
28. It is proposed that the
full Strategy for consultation including the final funding model will be
considered at the Council meeting on the 28 August.
29. As part of Strategy
adoption, the Council will need to meet the requirement of section 16 LGA
(requirement for new activity by a Regional Council), and amendment to the
Revenue and Financing Policy to reflect the Strategy. The next step would
be an amend the Long Term Plan (currently a 3 year plan).
30. Included in the amendment
will be an indicative plan for both expenditure and rating.
31. One important consideration
of the amendment is the introduction of rates. An option that will need
to be considered is the intention that rates for each unit will be set in the
Annual Plan following the lodging of the resource consent for each
intervention. This will not be for the full amount, but an amount that
reflects a percentage of the final amount with the intention of full recovery
at the time the capital works are completed. This will avoid a sharp
increase in rates and reduce the need for Council to borrow. Waiting for a
resource consent to be lodged provides more certainty as to the costs and
timing of the works.
Authored by:
|
Simon Bendall
Coastal Hazards Strategy Project
Manager
|
|
Approved by:
|
Chris Dolley
Group Manager Asset Management
|
|
Attachment/s
|
1⇩
|
Clifton to Tangoio Coastal Hazards
Strategy 2120 - Timeline
|
|
|