HAWKE’S BAY REGIONAL COUNCIL
Finance
Audit & Risk Sub-committee
Wednesday 11 November 2020
Subject: 2019-20 Annual Treasury
Report
Reason for Report
1. This item provides an annual update of the
Councils investment activity and reports the performance of the Council’s
investment portfolio for the year ending 30 June 2020.
Background
2. The Investment management reporting requirements, outlined
within Council’s Treasury Policy, requires Office to report to the
Financial Audit & Risk Sub-Committee (FARS) on the Council’s
investment allocation and investment
performance.
3. As stated within the Policy, all Treasury investments are
required to be reported on quarterly, with other defined investments reported
annually. A general outline of the reporting requirements is listed below.
|
Minimum update to FARS
|
|
Quarterly
|
Annually
|
|
Liquidity
|
Investment property
|
|
Financial assets
|
Forestry assets
|
|
CCTO - HBRIC
|
Intangible assets
|
|
|
Napier / Gisborne Rail
|
4. Officers continue to welcome feedback from FARS to improve
and further develop the reporting process and to highlight any specific gaps of
information they would benefit from.
Discussion
5. The Annual Treasury report is written as at 30 June 2020,
and reports on:
5.1. Investment
Portfolio Summary
5.2. FY19-20
Performance Summary
5.2.1. Napier Port (PONL) IPO
5.2.2. Other
5.3. Liquidity
5.3.1. Cash & Cash Equivalents
5.3.2. Debt
5.4. Financial
Assets
5.5. Investment
Property
5.6. Forestry
Assets value
5.7. Intangible
Assets (Carbon Credits)
5.8. Napier /
Gisborne Rail
5.9. CCTO –
HBRIC
Investment Portfolio Summary
6. The below table
is an extract from HBRC Balance sheet, which shows the complete list of HBRC
assets as at 30 June 2020:
|
|
Asset
|
FY18-19
|
FY19-20
|
Change
|
|
|
|
$000
|
%
|
$000
|
%
|
$000
|
|
|
Cash &
cash equivalents
|
28,436
|
4.0
|
6,522
|
0.7
|
(21,914)
|
|
*
|
Trade &
other receivables
|
10,063
|
1.4
|
11,327
|
1.3
|
1,264
|
|
*
|
Inventories
|
113
|
0.0
|
452
|
0.1
|
339
|
|
|
Advances to
CCO
|
6,500
|
0.9
|
-
|
0.0
|
(6,500)
|
|
|
Other
financial assets
|
55,700
|
7.8
|
124,366
|
13.9
|
68,665
|
|
|
Management
Funds
|
41,910
|
75.2
|
111,073
|
89.3
|
69,163
|
|
*
|
Other
|
13,791
|
28.5
|
13,293
|
10.7
|
(498)
|
|
|
Investment
property
|
48,393
|
6.8
|
57,855
|
6.5
|
9,462
|
|
*
|
Forestry
assets
|
11,482
|
1.6
|
11,087
|
1.2
|
(395)
|
|
|
Intangible
assets
|
7,347
|
1.0
|
10,096
|
1.1
|
2,749
|
|
|
Napier /
Gisborne Rail
|
236
|
0.0
|
1,486
|
0.2
|
1,250
|
|
|
Investment
in HBRIC
|
340,396
|
47.9
|
457,260
|
51.0
|
116,864
|
|
*
|
Property,
plant & equipment
|
27,473
|
3.9
|
28,574
|
3.2
|
1,101
|
|
*
|
Infrastructure
assets
|
174,709
|
24.6
|
187,387
|
20.9
|
12,678
|
|
|
Total Assets
|
710,848
|
100.0
|
896,412
|
100.0
|
185,564
|
|
*
-
|
These assets aren’t considered
‘Investment Assets’ and are excluded from this report. They
will however be reported on as part of Council’s Annual Report.
Note amounts listed above are
subject to Audit sign off.
|
7. The graphs
below illustrate geographically, where Councils investments are located.
8. The percentages
equate to the percentage of total Council investment portfolio.
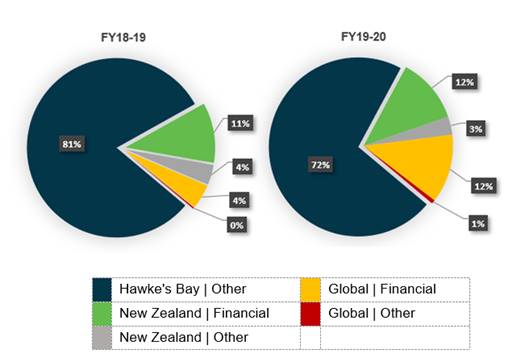
9. The graphs demonstrate
the response to HBRC Long-Term Plan (LTP 2018-28) strategy, which pursued the
strategy of diversifying the Council’s investment base, thereby
de-risking reliance on the Hawke’s Bay region and/or income derived from
any one asset class.
10. The diversification of the
investments base is less than anticipated over the past 12 months as a result
of the extraordinary value increase realised in PONL; where in spite of Council
divesting 45% of its ownership, the investment value increased by $71M. As at 30
June 2020, PONL still accounts for ~60% of the total investment portfolio.
FY19-20
Performance Summary
11. The tables below show
Actuals against the Annual Plan’s income and funding derived by Councils
investments.
|
|
Income
|
FY19-20
Annual Plan
|
FY19-20
Actuals
|
Variance
Actual v.
Plan
|
|
|
|
$000
|
%
|
$000
|
%
|
$000
|
%
|
|
|
Other
financial assets
|
7,727
|
8
|
3,422
|
3
|
(4,305)
|
44
|
|
|
Management
Funds
|
6,650
|
86
|
2,530
|
74
|
(4,120)
|
38
|
|
|
Interest
|
1,077
|
14
|
892
|
26
|
(185)
|
78
|
|
|
Investment
property
|
2,284
|
2
|
2,343
|
2
|
59
|
103
|
|
|
Endowment
leasehold land
|
1,443
|
63
|
1,500
|
64
|
57
|
104
|
|
|
Wellington
Leasehold land
|
841
|
37
|
843
|
36
|
2
|
100
|
|
|
Napier /
Gisborne Rail
|
-
|
-
|
-
|
-
|
-
|
-
|
|
|
Investment
in HBRIC
|
90,900
|
90
|
109,583
|
95
|
18,683
|
121
|
|
|
PONL
Dividend
|
7,900
|
9
|
2,500
|
2
|
(5,400)
|
32
|
|
|
IPO
‘special’ Dividend
|
83,000
|
91
|
107,083
|
98
|
24,083
|
129
|
|
|
Income
Total
|
100,911
|
100
|
115,348
|
100
|
14,437
|
114
|
12. The FY19-20 income result
reflects six months from the first reports of Covid-19 in China, and the global
the impact from it thereafter.
12.1. Other Financial
Assets: namely the two Managed Funds, preformed albeit as expected up to
Q2, took a significant hit in Q3 and with support from equally significant
global fiscal support packages, made a rebound in Q4.
12.2. As a result of the
numerous global fiscal packages, equity ‘valuations’, when compared
to low interest rates will now more appealing.
12.3. Investment Property:
Endowment land property has out-performed expectations, with the market value
of the land increasing by ~$9M in FY19/20. However, a prior Council decision
[ACC] limits the benefit to Council, and therefore both land areas performed as
expected.
12.4. Investment in HBRIC:
The success of the PONL listing is detailed below but is as expected, the
success of FY19-20.
13. The overall FY19-20
performance saw a $14.4M or 14% favourable variance in regard to income
generation.
PONL IPO
Summary
14. On 20 August 2019, Council
successfully listed the minority share of PONL on the NZX; resulting in HBRIC
receiving $107M cash proceeds in exchange for 45% of capital.
15. As part of the LTP 2018-28
consultation, funds received through the capital liquidation were to establish
a ‘ring fenced’ ‘Future Investment Fund’ (FIF). As a
consequence of being ‘ring fenced’, Council cannot reinvest the
107M received for the capital without initial community consultation.
16. As a result of an
unfavourable IRD binding tax ruling, $35M of the $107M received was financially
impractical to transfer as planned from HBRIC to HBRC. Transferring the
additional amount would have created onerous tax consequences. Furthermore, the
IPO raised an additional $27M compared to the LTP expectations. Any capital
achieved over and above the forecasted $83M would initially remain in HBRIC due
to Tax consequences.
17. Following the unfavourable
binding ruling decision, HBRIC continued to explore options to transfer the IPO
funds in a tax efficient manner to HBRC. Upon consultation with PwC a decision
was made in June 2020 by Council and the HBRIC board to transfer/ sell circa
16M of Jarden held domestic investments to HBRC in return for an interest
bearing loan. This arrangement transferred all risks and rewards of ownership
of the funds to HBRC and enabled HBRC to benefit from future earnings and
capital gains of the investments transferred.
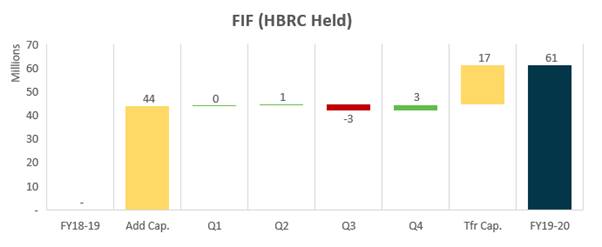
18. The remaining $45M is invested
by HBRIC and governed by the HBRC SPIO.
18.1. As part of the
Investment Strategy of the LTP 2021-31, the SIPO of HBRIC will be considered to
take advantage of the benefits a CCTO has over Local Government.
|
PONL IPO
Proceeds breakdown summary:
|
|
|
|
|
|
IPO
|
>
|
HBRIC
|
HBRC
|
|
|
$000
|
|
$000
|
$000
|
|
Gross
IPO Proceeds
|
108
|
|
|
|
|
Net
IPO Proceeds * Ring Fenced Amount
|
107
|
>
|
|
|
|
Fully
Imputed Dividend Paid to HBRC
|
|
|
|
44
|
|
FIF
still held in HBRIC
|
|
|
35
|
|
|
FIF
HBRIC
|
|
|
27
|
|
|
Internal
Loans
|
|
|
(17)
|
17
|
|
Total
|
107
|
>
|
45
|
61
|
Liquidity - Cash & Cash Equivalents
|
|
Asset
|
FY19-20
|
|
|
|
$000
|
%
|
%
|
|
|
Cash
|
4,022
|
|
61.7
|
|
*
|
HBRC Held
Cash
|
3,553
|
88.3
|
|
|
|
Works
Group
|
138
|
3.4
|
|
|
|
Other
– managed trusts
|
330
|
8.3
|
|
|
|
Short-term
bank deposits
|
2,500
|
|
38.3
|
|
-
|
Cash &
and cash equivalents
|
6,522
|
|
100
|
* $650k is marked to rebalance the disaster
damage reserve referenced in the report.
- The remaining Term Deposit was invested for 84 days
& returned 1.65%.
19. With the Reserve Bank of
New Zealand (RBNZ) currently setting unprecedented monetary policy easing, the
forecast for returns from Cash and Cash Equivalents type investments is to
remain low, when compared to Pre Covid-19 levels.
20. This is unfavourable for
Council’s FY20-21 Annual Plan forecast interest earned from Cash and Cash
Equivalents. Returns from cash was forecast at 4.5% as per the
significant assumptions used in the 2018-28 LTP. However,
lower cash rates will have favourable financial implications through reduced
borrowing costs etc.
21. Cash and cash equivalents
are used purely for working capital to enable the organisation to meet its
requirements.
21.1. The following graph
displays HBRC daily closing cash position for the FY19-20.
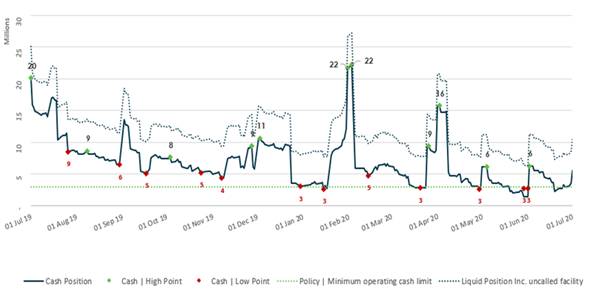
22. As per the Treasury
policy, a minimum $3M liquidity should be accessible at all times.
23. The low material points
seen in January/February are a result of rates being due in February 2020. The
low points in May/June are loans yet to be drawn for debt funded activities,
such as Sustainable Homes and The Erosion Control Scheme. These loans wear
drawn in July 2020.
24. The Treasury Accountant
reports weekly to the CFO on HBRC short term cash position (up to 13 weeks).
Debt
Management
25. HBRC Loans drawn as at 30
June 2020:
|
|
Loan
Id
|
Bank
|
Loan Type
|
Interest Rate
|
Amount drawn
|
Execution
|
Maturity
|
|
|
|
|
|
%
|
$000
|
|
|
|
|
1062
|
BNZ
|
Fixed
|
6.4600
|
500
|
07 Jul ‘11
|
30 Jun ‘21
|
|
|
R0423LF63
|
LGFA
|
Floating
|
1.5875
|
1,000
|
10 May ‘19
|
15 Apr ‘23
|
|
|
1068
|
BNZ
|
Fixed
|
5.7500
|
1,000
|
22 Jun ‘12
|
22 Jun ‘22
|
|
|
1072
|
BNZ
|
Fixed
|
6.4500
|
2,450
|
09 Dec ‘03
|
09 Dec ‘23
|
|
|
1076
|
BNZ
|
Fixed
|
5.7400
|
2,925
|
18 Dec ‘14
|
18 Dec ‘24
|
|
|
1078
|
BNZ
|
Fixed
|
4.8500
|
2,600
|
16 Dec ‘16
|
15 Dec ‘26
|
|
|
92
|
Westpac
|
Fixed
|
5.0950
|
2,750
|
14 Dec ‘15
|
18 Dec ‘25
|
|
|
93
|
Westpac
|
Fixed
|
4.5500
|
3,000
|
14 Dec ‘17
|
15 Dec ‘27
|
|
|
R0429LF63
|
LGFA
|
Floating
|
1.2875
|
1,500
|
10 May ‘19
|
15 Apr ‘29
|
|
|
Average
|
|
|
4.5986
|
17,725
|
|
|
|
|
Repayments
|
|
|
|
Principal
|
Interest
|
Total
|
|
|
FY
Year
|
$000
|
$000
|
$000
|
|
|
FY21
|
3,650
|
896
|
4,546
|
|
|
FY22
|
3,150
|
532
|
3,682
|
|
|
FY23
|
3,650
|
374
|
4,024
|
|
|
FY24
|
2,300
|
230
|
2,530
|
|
|
FY25
|
1,625
|
135
|
1,760
|
|
|
FY26
|
1,050
|
75
|
1,125
|
|
|
FY27
|
600
|
39
|
639
|
|
|
FY28
|
200
|
23
|
223
|
|
|
FY29
|
1,500
|
15
|
1,515
|
|
|
Total
|
17,725
|
2,319
|
20,044
|
26. Officers have considered
refinancing the higher interest rate loans with the BNZ and Westpac Banks with
a lower interest rate with the LGFA. Unfortunately, as detailed below, the
penalties associated with the early repayment, and with the LGFA Principals
only being repayable at loan maturity – results in a $324k unfavourable
option.
27. Prior to the 2018-28
Treasury Policy, exposure to fixed / floating interest rates was not prescribed
through policy and therefore a more conservative approach was taken to borrow
at fixed rates. Unfortunately, in the current environment this has seen Council
commit longer to higher the fixed amounts. To mitigate this exposure, new
borrowing considers hedging interest risk with a combined of floating/fix rate
exposure.
|
|
Consideration
to Refinance
|
Interest
|
Total
|
|
|
|
$000
|
$000
|
|
|
BNZ early
break fee
|
(735)
|
|
|
|
Westpac
early break fee
|
(528)
|
|
|
|
LFGA
Interest Charged at 1.1804% for 6.75 years
|
(1,169)
|
|
|
|
Total
Refinancing Costs
|
|
(2,432)
|
|
|
Westpac
& BNZ Interest on current loans held
|
2,108
|
|
|
|
Remain as is
|
|
2,108
|
|
|
Savings /
(costs)
|
|
(324)
|
|
*
|
The
opening balance differs to the $17.2M above as calculations where preformed
in FY20-21 Q1.
|
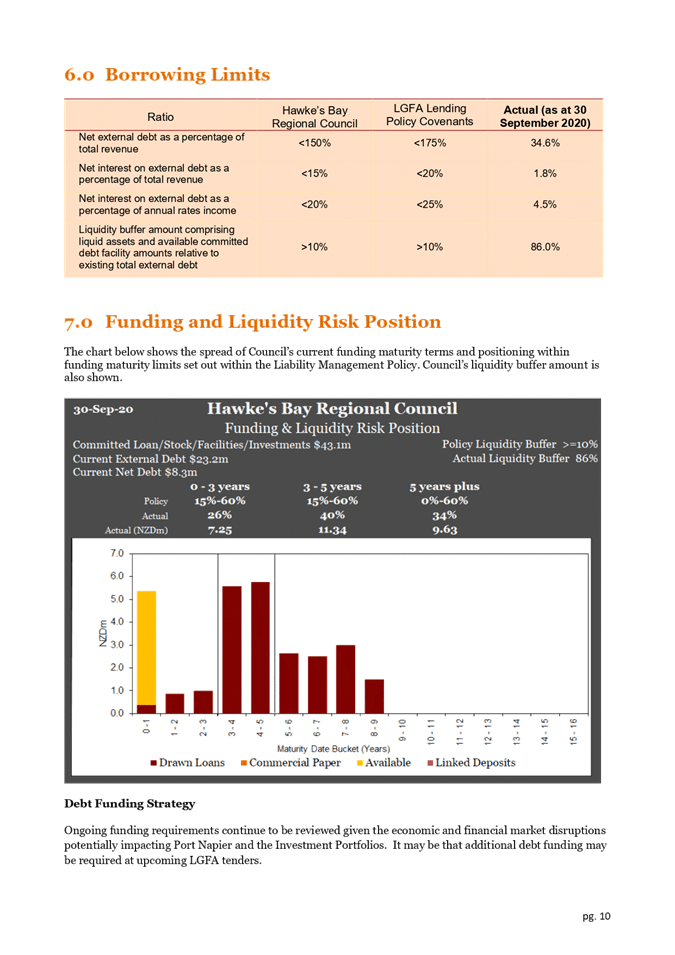
Borrowing Limits
|
|
Ratio
|
HBRC
|
LGFA
|
Actual
|
|
|
|
|
%
|
|
%
|
%
|
|
|
Net external
debt as a % of total revenue
|
<
|
150
|
<
|
175
|
19.6
|
|
|
Net interest
on external debt as a % of total revenue
|
<
|
15
|
<
|
20
|
1.2
|
|
|
Net interest
on external debt as a % of annual rates income
|
<
|
20
|
<
|
25
|
4.2
|
|
|
Liquidity
buffer amount comprising liquid assets and available committed debt facility
amounts relative to existing total external debt
|
>
|
10
|
>
|
10
|
65.9
|
28. The ratios mentioned above
are self-imposed for HBRC and are covenant requirements for LGFA. HBRC
will be reviewed as part of the Treasury policy review for the 2021-31 LTP.
Other financial assets
Managed Funds
(excluding HBRIC)
29. The Managed Funds referred
to in this section the entire LTIF because this sits solely on HBRC Balance Sheet,
and $61M of the FIF held by HBRC.
30. At 30 June 2020 the total
original capital invested by HBRC was $107.1M. At 30 June the value of both
investments was valued at $111M.
Quarter ending Fund balances.
|
|
Fund
|
FY18-19
|
Q1
|
Q2
|
Q3
|
Q4
|
|
|
|
$000
|
$000
|
$000
|
$000
|
$000
|
|
|
LTIF
|
41,926
|
49,539
|
50,674
|
46,305
|
49,922
|
|
|
FIF
|
-
|
43,967
|
44,724
|
41,712
|
61,105
|
|
|
Total
|
41,926
|
93,506
|
95,398
|
88,017
|
111,027
|
31. The table above,
highlights the volatility seen throughout FY19-20, by outlining the investment
balance at the start/end of each quarter. While this market volatility can
create uncertainly, the downs (and ups) will occur from time to time. The
strategy of diversifying an asset base is by far the best way of safeguarding
any investment; achieved through exposing the investment to the full spectrum
of any global market movements.
32. The investment strategy
aims to provide capital protection for intergenerational benefit, meaning these
managed funds should always be considered with a long-term view. Reacting
to short term shifts in the market can have a significant financial impact in
the longer term.
33. As part of the investment
strategy discussion for the 2021-31 LTP the Treasury and SIPO policy settings
will be reviewed and recommendations made to ensure any changes to the strategy
are reflected in the policy and direction given via the SIPO to the fund
managers.
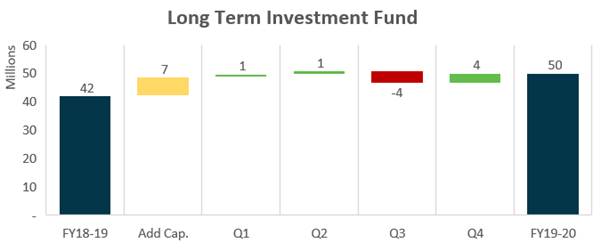
Long Term Investment Fund (LTIF) -
Income
|
|
Annual Plan
|
Actual
|
Variance
|
|
Opening
Balance - 01 July 2019
|
|
41,926
|
|
|
Additional
Capital Invested
|
|
6,578
|
|
|
|
50,000
|
48,504
|
(1,496)
|
|
Maintain
Capital Value
|
1,667
|
1,418
|
(249)
|
|
Fund
Council Operating Costs*
|
2,500
|
-
|
(2,500)
|
|
Fund
Regional Reserves/Loans
|
833
|
-
|
(833)
|
|
Closing
Balance – 30 June 2020
|
55,000
|
49,922
|
(5,078)
|
34. The LTIF actual income of
$1.4M is attributed to:
34.1. Fund earned
Dividends/Interest: $0.4M
34.2. Fund Capital Gain: $1.0M
35. Direct investment into the
LTIF is $46.6M.
36. Adjusted for CPI, $48M is
protected capital.
37. This equates to a
potential cash withdrawal for HBRC of up to $1.9M.
38. It should be noted that
the $1.9M is a life to date amount, not a FY19-20 amount.
Future Invest Fund HBRC (FIF HBRC)
– Income
|
|
Annual Plan
|
Actual
|
Variance
|
|
Opening
Balance - 01 July 2019
|
|
-
|
|
|
Additional
Capital Invested
|
|
60,564
|
|
|
|
83,000
|
60,564
|
(22,436)
|
|
Maintain
Capital Value
|
1,660
|
541
|
(1,119)
|
|
Fund
Council Operating Costs*
|
4,150
|
-
|
(4,150)
|
|
Fund
Regional Reserves/Loans
|
-
|
-
|
-
|
|
Closing
Balance – 30 June 2020
|
88,810
|
61,105
|
(27,705)
|
41. As a result of the
unfavourable binding ruling, less of the Napier Port IPO proceeds were passed
through to HBRC, however these are held in a mirrored FIF fund in HBRIC.
42. The FIF (HBRC) actual
income of $0.5M is attributed to:
42.1. Fund earned
Dividends/Interest: $0.2M
42.2. Fund Capital Gain: $0.3M
43. The FIF HBRC balance of
$61.1M includes $60.9M of protected capital.
44. This equates to a
potential cash withdrawal for HBRC of up to $0.2M.
Government
bonds and Other Funds in Management
Regional
Disaster Reserve (RDR)
45. Incorporated as part of
the LTP 2018-28, the RDR is set aside to meet the commercial insurance excess
of $600,000 on a ‘disaster event.
46. Per Council Policy, the
RDR must have liquid investments available above $2.75M.
47. During FY2018-19 $200k was
utilised from the reserve and put towards the HB draught relief fund.
48. At 30 June 2020 the
reserve balance was $2.8M.
|
|
Type
|
Maturity
|
Return
|
FY19-20
|
|
|
|
|
|
Interest Earned
|
Capital Gain
|
Value
|
|
|
|
|
%
|
$000
|
$000
|
$000
|
|
|
GOVT
Inflation-indexed bonds
|
20/09/2030
|
3
|
16
|
9
|
545
|
|
|
GOVT
Inflation-indexed bonds
|
20/09/2025
|
2
|
6
|
5
|
280
|
|
|
LFGA Fixed
Rated Bond
|
15/04/2023
|
5.5
|
10
|
-
|
175
|
|
|
Total
|
|
|
32
|
14
|
1,000
|
|
Fund Manager
|
Fund
|
5 Year Avg. Return
|
Comment
|
FY19-20
Value
|
|
|
|
|
%
|
|
000
|
|
|
Milford
|
Active
Growth
|
10
|
A medium to
high risk investment, with focus of ASX.
|
121
|
|
|
Devon
|
Alpha Fund
|
5.18
|
A higher
risk investment, with a concentrated portfolio of approx. 10-15 selected
companies listed on the NZX and ASX.
|
66
|
|
|
Platinum
|
International
|
5.40
|
A medium
risk investment, with a portfolio of 70-140 companies from across industry sectors
and geographically spread.
|
177
|
|
|
Platinum
|
Asia
|
10.7
|
A medium to
high risk investment, with a diversified portfolio of Asian (ex-Japan)
companies across industry sectors.
|
75
|
|
|
Orbis
|
Global
|
8.5
|
A medium to
high risk investment. The Fund is designed to remain fully invested in global
equities. It aims to earn higher returns than world stock markets.
|
166
|
|
|
Orbis
|
US
|
(2.1)
|
The Fund
seeks capital appreciation in US dollars on a low risk global portfolio.
|
76
|
|
|
MMC Fund
|
Aspiring
|
10
|
A medium
risk investment. The Fund principally invests in NZX, ASX and Globally listed
equities. The principal objective of the Fund is to achieve positive absolute
returns averaging at least 4% over inflation
|
135
|
|
|
Total
|
|
|
|
|
816
|
|
|
|
|
|
|
|
|
|
|
Prior
Year Returns & cash
|
|
|
963
|
|
|
|
|
|
|
|
|
|
|
DDR Total
|
|
|
|
|
2,779
|
Investment Property
|
|
Property
|
FY18-19
|
FY19-20
|
Change
|
|
|
|
000
|
# of Properties*
|
000
|
# of Properties*
|
000
|
|
|
Endowment
leasehold land
|
30,645
|
168
|
39,630
|
160
|
8,985
|
|
|
Wellington
Leasehold land
|
17,300
|
12
|
17,750
|
12
|
450
|
|
|
Property at
Tutira
|
450
|
1
|
475
|
1
|
25
|
|
|
Total
|
48,395
|
181
|
57,855
|
173
|
9460
|
|
*
|
The number
of properties is different to the number of leases because of multiple
dwellings etc.
|
Endowment
leasehold land
49. The Endowment leasehold
portfolio comprises of 160 individual leases, with all but 1 (commercial) being
residential leases. The majority are perpetually renewable ground leases,
renewable every 21 years at a prescribed rent at 5% of the land value when
reviewed.
50. As per the Hawke's Bay
Endowment Land Empowering Act, Freeholding the land is permitted to only the
sitting lessees and this is occurring steadily, although the rate is slowing as
the proportion of cross leases remaining increases where freeholding is more
complex.
51. On 17 December 2013, HBRC
sold its entitlement to the next 50 annual rents of the endowment land to ACC
for $37.7M to ACC; effectively creating a present-day value of a $172M loan
discounted at 6.88%. These funds were originally budgeted against RWSS, however
has been invested as part of the LTIF.
52. When accounting for the
ACC agreement, the Endowment leasehold land incurred a $1.3M outflow of cash
for the FY19-20 year as detailed below.
|
|
Financial
Performance:
|
|
|
|
|
|
$000
|
$000
|
|
|
Annual Rent
Collected
|
1,500
|
|
|
|
Collection
Cost (ACC)
|
90
|
|
|
|
|
|
1,590
|
|
|
ACC minimum
repayment
|
(855)
|
|
|
|
PV of
Freeholding (paid to ACC)
|
(1,800)
|
|
|
|
Gain/(Loss)
on Value sold, when compared to present value
|
(260)
|
|
|
|
|
|
(2,915)
|
|
|
Total
|
|
(1,325)
|
53. The agreement assumed the
Endowment Lands increased at 1.5% year on year. Although the Napier Market is
presently out preforming this assumption, when a section is freeholded HBRC
must pay out the present value of the remaining years rent previously sold to
ACC which in effect reverses any upside for HBRC. This resulted in $1.8M or 18
leases being paid out in FY2019-20.
54. It is likely that in the
near future, this agreement will continue to heavily favour ACC, as HBRC will
likely be paying back any freeholded properties faster than it was assumed. In
the longer term, it will be less onerous as the percentage of cross lease
leaseholds grows, and whereby freeholding is generally more complex, and it is likely only rental payments will be due.
55. As at 30 June 2020, the
minimum repayment to ACC is $45.1M, relating to the 159 leases, 90 single and
69 cross leases.
Wellington Leasehold Land
56. The Wellington portfolio
comprises of 12 individual leases, within the main, inner city residentials
areas of Wellington City. The majority are perpetually renewable ground leases,
renewable every 14 years. At a prescribed rent between 5.00-5.25% of the land
value when reviewed.
57. Annual rent received for
the FY19-20 was $843k, representing a 5.1% cash return on Investment.
58. As part of the required
Annual Reporting process, an annual valuation is completed on the properties.
The FY2019-20 saw the investment grow $0.5M (capital gains).
Future lease renewals
59. As a
requirement of the Treasury policy, below shows the leasehold properties up for
renewal:
|
|
|
Lease renewals
|
|
|
Location
|
FY21
|
FY22
|
FY23
|
FY24
|
FY25
|
|
|
Endowment
|
20
|
16
|
3
|
8
|
5
|
|
|
Wellington
|
-
|
1
|
1
|
3
|
-
|
|
|
Total
|
20
|
17
|
4
|
11
|
5
|
60. As indicated above,
renewals are important to the HBRC forecast, as rent requirements are set based
on the Land Market Value at renewal.
Intangible
Assets
|
|
Asset
|
FY-18-19
|
FY19-20
|
|
|
|
$000
|
%
|
$000
|
%
|
|
|
IT Software
|
5,342
|
65.7
|
6,148
|
60.9
|
|
*
|
Carbon
Credits
|
2,785
|
34.3
|
3,948
|
39.1
|
|
|
Intangible
Assets
|
8,127
|
100
|
10,096
|
100
|
|
*
|
NZU value at
30 June 2020 $31.90, this is compared to $23.10 in 2019.
|
61. 3.12 NZU (Carbon credits)
have been gained from the normal forestry and berm enhancement operations of
Council.
62. Council policy is to only
sell safe carbon which would offer no liability to repay credits at harvest
Napier/Gisborne Rail
63. In February 2019, HBRC
agreed to advance KiwiRail $1.25M as a contribution towards the reinstatement
of the log freight service between Wairoa and Napier.
64. Repayment of the $1.25M,
along with interest, will happen when log volumes of the line for a
‘rolling’ 6-month exceeds 90,000 tonnes.
65. Due to the Covid-19 market
downturn, KiwiRail closed the line in February 2020. The 12 months (July 2019
– June 2020) volumes were 1,946 tonnes.
66. Current indications from
KiwiRail’s are that the line will target to achieve a rolling 6-month
tonnage of 39,000 tonnes, or 43% of the required 90,000 tonnes.
67. HBRC currently does not
forecast of any repayment.
HBRIC
Overall
Summary
68. Subject to audit sign off,
HBRIC’s Net Profit after Tax was $218M.
69. Dividends passed from
HBRIC to HBRC were $46.5M.
70. At year end, 30 June 2020,
HBRIC held 55% of the capital in NPHL, which was valued $396M or $3.60 p/s.
71. HBRIC currently holds
$1.1M Imputations Credits, which equates to ~$4m of funds able to be
transferred to HBRC Tax Free.
|
|
Fund
|
FY18-19
|
Q1
|
Q2
|
Q3
|
FY19-20
|
|
|
|
000
|
000
|
000
|
000
|
000
|
|
|
FIF
|
-
|
59,009
|
60,041
|
58,452
|
45,620
|
|
|
Total
|
-
|
59,009
|
60,041
|
58,452
|
45,620
|
Future Invest Fund HBRC (FIF HBRIC) -
Income
|
|
Annual Plan
|
Actual
|
Variance
|
|
Opening
Balance - 01 July 2019
|
|
-
|
|
|
Additional
Capital Invested
|
n/a
|
45,019
|
|
|
|
|
45,019
|
|
|
Maintain
Capital Value
|
n/a
|
601
|
601
|
|
Fund
Council Operating Costs*
|
n/a
|
|
|
|
Fund
Regional Reserves/Loans
|
n/a
|
|
|
|
Closing
Balance – 30 June 2020
|
|
45,620
|
45,620
|
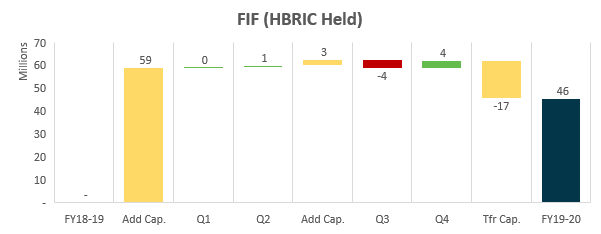
72. The FIF held within HBRIC
was not anticipated in the FY19-20 Annual Plan.
73. The FIF (HBRC) actual
income of $0.6M is attributed to:
73.1. Fund earned
Dividends/Interest: $0.4M
73.2. Fund Capital Gain: $0.2M
74. The FIF HBRIC balance of
$45.6M includes $45.0M of protected capital.
75. This equates to a
potential cash withdrawal for HBRC of up to $0.6M
Decision Making
Process
76. Staff have assessed the
requirements of the Local Government Act 2002 in relation to this item and have
concluded that:
77. as this report is for
information only, the decision-making provisions do not apply
78. any decision of the
sub-committee (in relation to this item) is in accordance with the Terms of
Reference and decision-making delegations adopted by Hawke’s Bay Regional
Council 25 March 2020, specifically the Finance, Audit and Risk Sub-committee shall
have responsibility and authority to:
78.1. Monitor the performance
of Council’s investment portfolio.
|
Recommendations
That the Finance, Audit and Risk Sub-committee receives and notes the “2019-20 Annual Treasury Report”.
|
Authored by:
|
Geoff Howes
Treasury & Funding Accountant
|
Bronda Smith
Chief Financial Officer
|
Approved by:
|
Jessica
Ellerm
Group Manager Corporate Services
|
|
Attachment/s
There are no
attachments for this report.
HAWKE’S BAY REGIONAL COUNCIL
Finance
Audit & Risk Sub-committee
Wednesday 11 November 2020
Subject: Quarterly Treasury
Report for 1 July - 30 September 2020
Reason for Report
1. This item provides an update of compliance monitoring of treasury
activity and reports the performance of Council’s investment portfolio
for the quarter to 30 September 2020.
Background
2. The Investment management reporting requirements, outlined within
Council’s Treasury Policy, requires Office to inform to the Financial
Audit & Risk Sub-Committee (FARS) on the Council’s current investment
allocation and investment performance.
3. As stated within the Policy, all Treasury investments are required
to be reported on quarterly. As at Q1, 30 September 2020, the Treasury
Investments to be reported on consist of:
3.1. Liquidity
3.1.1. Cash and
Cash Equivalents
3.1.2. Rates
3.1.3. New debt
3.1.4. Negative
Interest Rates
3.2. Externally Managed Investment Funds
3.2.1. Long-Term
Investment Fund (LTIF)
3.2.2. Future
Investment Fund (FIF)
3.3. CCTO - HBRIC
4. Since 2018, HBRC has procured treasury advice and services from PwC.
Their quarterly compliance report has been attached to this report.
Discussion
FY20-21 Performance
5. The table below shows the income to date against the FY20-21 Annual
Plan.
|
|
Income
|
Annual Plan
|
YTD
Annual Plan
|
YTD
Actuals
|
|
|
|
$000
|
%1
|
$000
|
%2
|
$000
|
%3
|
|
|
Other financial assets
|
5,644
|
51
|
1,411
|
71
|
5,056
|
358
|
|
|
Management
Funds
|
5,263
|
93
|
1,316
|
93
|
5,056
|
384
|
|
|
Interest
|
381
|
7
|
95
|
7
|
-
|
-
|
|
|
Investment property
|
2,343
|
21
|
586
|
29
|
443
|
76
|
|
|
Endowment leasehold land
|
1,502
|
64
|
376
|
64
|
229
|
61
|
|
|
Wellington Leasehold land
|
841
|
36
|
210
|
26
|
214
|
100
|
|
|
PONL Dividend
|
3,000
|
27
|
-
|
-
|
-
|
|
|
|
Total
|
10,987
|
|
1,997
|
|
5,499
|
275
|
|
%1
|
Annual plan - Asset income vs. Total Income
|
|
%2
|
YTD planned asset income vs. Total Income
|
|
%3
|
YTD asset income vs. YTD planned asset income
|
|
|
|
|
|
|
|
|
|
Key observations
6. The YTD income of $5.1M YTD equates to gross income the [LTIF &
FIF] funds have increased by since 30 June 2020.
7. Of the $5.1M, $300K is what the funds have earned by way of
interest, dividends & selling shares at a gain. Alternatively, $4.8M is by
way of ‘market’ equity growth.
Liquidity - Cash & Cash
Equivalents
8. Cash and cash equivalents:
|
|
Asset
|
30 Sep 2020
|
|
|
|
|
$000
|
%
|
%
|
|
|
|
Cash
|
15,223
|
|
100.0
|
|
|
|
HBRC Held Cash
|
14,149
|
92.9
|
|
|
|
|
Works Group
|
502
|
3.3
|
|
|
|
|
Other –
managed trusts
|
572
|
3.8
|
|
|
|
|
Short-term bank deposits
|
-
|
|
-
|
|
|
|
Cash & and cash equivalents
|
6,522
|
|
100
|
|
|
*
|
$9m was placed in Term Deposits on 2 October 2020, ranging
for a period between 17-56 days and returning on average 0.64%.
|
9. FY20-21 will see historical low interest rates continue throughout
the year, which will limit Council’ earning additional income via Term
Deposits from surplus liquidity.
10. To
highlight these low market rates, when placing the $9M in Term Deposits
recently, the Retail Term Deposits before investment were:
|
Term
|
BNZ
|
ASB
|
Kiwi
Bank
|
ANZ
|
Westpac
|
|
up
to:
|
Interest Rate %
|
|
30
|
.15
|
.15
|
.25
|
-
|
.33
|
|
60
|
.25
|
.21
|
.25
|
-
|
.68
|
|
90
|
.40
|
.30
|
.65
|
-
|
.79
|
11. It is
expected that low interest rates will remain for
a sustained period. The budgeted interest earned amount in the FY20-21 Annual
Plan, was 4.5% or $0.4M for the period. Further analysis has since been
completed on this significant assumption set in the 2018-28 LTP, and a 1.5%
return or $0.2M, would be used as a deposit rate assumption going forward. It
is expected the shortfall can mostly be mitigated through the daily management
of the Council working capital via the earlier collection of rates and later
borrowing based on this.
Rates and Rates Collection
12. Last year
Council decided to change the due date for Rates Invoices from 1 October to 20
September and to apply the penalties on 21 September for any outstanding rates
rather than 31 January which had become the pseudo due date. During the Annual
Plan process it was decided to leave the penalty date as 31 January to allow
those experiencing hardship to pay the rates without penalty however the due
date remained as 20 September. This has seen 80% of all Rates revenue, $28.7M,
now collected, compared to 23%, $6.5M at the same point last year.
13. The
following table shows HBRC rolling monthly cash liquidity position. The impact
of Rates being collected early is highlighted in the September liquidity
position.
|
Cash
Position
|
Apr 20
|
May 20
|
Jun 20
|
Jul 20
|
Aug 20
|
Sep 20
|
|
Millions
(NZD)
|
Actual
|
Actual
|
Actual
|
Actual
|
Actual
|
Actual
|
|
Mean
|
6.5
|
3.3
|
4.1
|
6.5
|
3.3
|
9.7
|
|
High Point
|
15.8
|
6.2
|
6.3
|
15.8
|
6.2
|
18.3
|
|
Low Point
|
2.6
|
1.4
|
1.4
|
2.6
|
1.4
|
4.7
|
|
Available
facility*
|
5.0
|
5.0
|
5.0
|
5.0
|
5.0
|
5.0
|
|
*
facility available to HBRC is the BKBM + 1.1% margin. As at June 30, this
would cost 1.4% to call on.
|
Debt Funding
14. Council
raised $6.3M of funds through the LGFA tender on 8 July 2020, with principle
repayments due in 2024 and 2025. The debt was to fund FY19-20 spending on
Sustainable Homes and the Erosion Control Schemes.
15. New
borrowings expected for the FY20-21 include:
15.1. $7.6M
– due to % rates increase and expected reduction in Investment Returns
due to COVID-19
15.2. $3.5M -
Sustainable Homes
15.3. $2.3M -
Costal Erosions Schemes
15.4. The
drawn down of loans are based on cashflow requirements. As forecasting is still
manual and phasing of budgets is not done, the exact timing of loan drawn downs
is monitored on a weekly basis.
16. A
significant forecasted cash item is the Napier Port Dividend, forecasted for
December 2020 and will reduce the requirement to borrow to later in the year
depending on the level of dividend.
17. Contrary
to the interest earned rates mentioned earlier, the historical low OCR benefits
Council where loans are expected to be raised at ~1.15%, ~1.15 less than the ~3.3%
forecasted in the FY20-21 Annual Plan.
Negative Interest Rates
18. Recent
forecasts have indicated that in the foreseeable future, there is a likely
chance that the NZOCR will fall below 0% (currently 0.25%).
19. A
negative OCR will largely concern wholesale bank rates, as banks will be driven
into a position to lend money, rather than keep it and therefore paying
interest the funds.
20. As a
borrower, we can expect fixed rate loans will become highly competitive,
however as borrowing does attract a margin (2.1% average in 2019), it will be
unlikely that HBRC will be in a position where it’s being paid to borrow.
Managed Funds
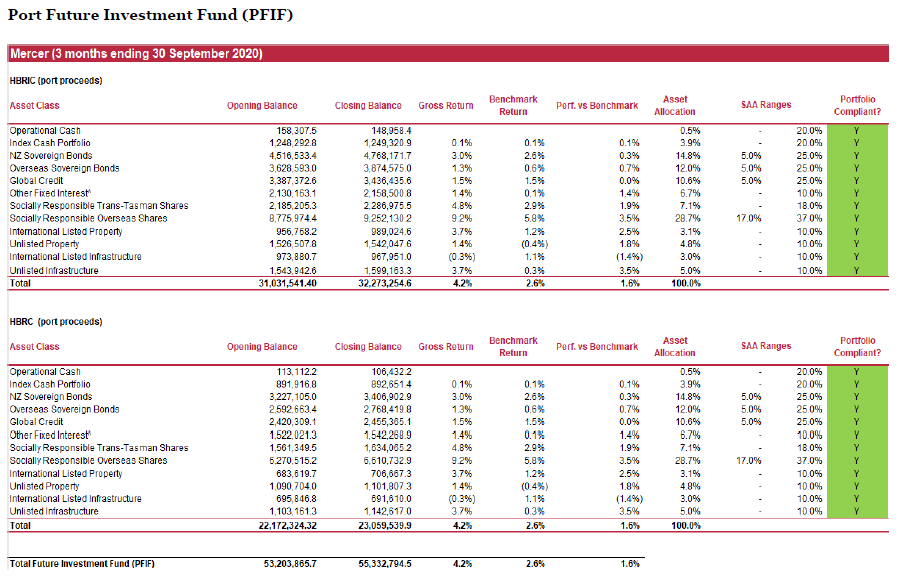
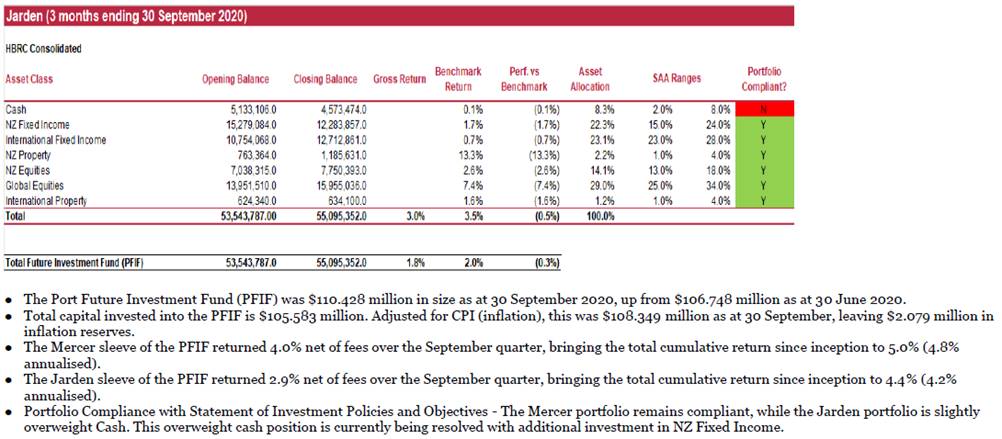
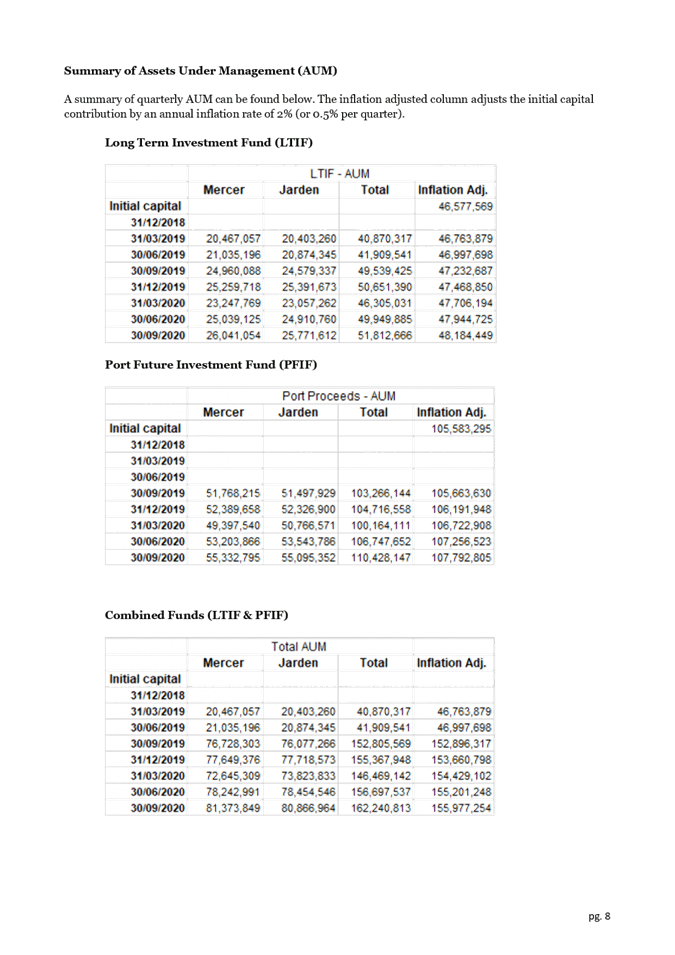
21. The total
capital invested by HBRC & HBRIC across the two funds was $162.2M as
at 30 September 2020. This represents a YTD total income return of $5.1M (3%)
or $4.7m after capital protection of the investment (2% as per policy).
22. Both the
Long-Term Investment Fund (LTIF) and Future Investment Fund (FIF) have improved
significantly since the last reported positions as at 30 June 2020.
Fund Totals
|
Fund
|
30 Sep 2019
|
31 Dec 2020
|
31 Mar 2021
|
30 Jun 2020
|
30 Sep 2020
|
|
|
$000
|
$000
|
$000
|
$000
|
$000
|
|
LTIF
|
49,539
|
50,674
|
46,305
|
49,922
|
51,810
|
|
FIF (HBRC)
|
43,967
|
44,724
|
41,712
|
61,105
|
63,094
|
|
Total HBRC
|
93,506
|
95,398
|
88,017
|
111,027
|
114,904
|
|
FIF (HBRIC)
|
59,009
|
60,041
|
58,452
|
45,620
|
47,292
|
|
Total
|
152,515
|
155,439
|
146,469
|
156,647
|
162,196
|
Performance Long Term Investment Fund (LTIF)
|
FY20-21 Q1
|
Annual
|
Annual P.
|
YTD
|
YTD
|
|
Return
|
Plan
|
YTD
|
Total
|
|
|
|
$000
|
$000
|
$000
|
%
|
|
Gross of Fees
|
|
|
1,900
|
3.8
|
|
Net of Fees
|
1,677
|
419
|
1,418
|
3.7
|
|
Capital
Protection (2% annualized)
|
|
|
|
.05
|
|
Real net return
|
|
|
|
3.2
|
23. The LTIF
balance of $51.8M includes $48.2M of protected capital, which equates to a
potential cash withdrawal for HBRC of up to $3.6M. It should be noted that the
$3.6M is a life to date amount, not a FY20-21 amount.
24. The below
table reflects what the LTIF has achieved year to date, against the FY20-21
Annual Plan.
|
FY20-21 Q1
|
Annual
|
Annual P.
|
YTD
|
|
|
$000
|
$000
|
$000
|
|
Real Capital
Growth
|
1,118
|
280
|
280
|
|
Operational
Fund
|
1,667
|
419
|
419
|
|
Loan
Reduction
|
559
|
140
|
719
|
Performance Future Investment Fund (FIF HBRC)
|
FY20-21 Q1
|
Annual
|
Annual Plan
|
Actual YTD
|
YTD
|
|
|
Plan
|
YTD
|
Total
|
|
|
|
$000
|
$000
|
$000
|
%
|
|
Gross of Fees
|
|
|
1,984
|
3.3
|
|
Net of Fees
|
2,053
|
513
|
1,931
|
3.2
|
|
Capital
Protection (2% annualized)
|
|
|
|
.05
|
|
Real return
|
|
|
|
2.7
|
25. The FIF
balance of $63.1M includes $61.2M of protected capital, which equates to a
potential cash withdrawal for HBRC of up to $1.5M. It should be noted that the
$1.5M is a life to date amount, not a FY20-21 amount.
26. The following
table reflects what the FIF HBRC has achieved to date, against the FY20-21
Annual Plan.
|
FY20-21 Q1
|
Annual
|
Annual Plan YTD
|
Actual YTD
|
|
|
$000
|
$000
|
$000
|
|
Real Capital
Growth
|
1,369
|
342
|
342
|
|
Operational
Fund
|
2,053
|
513
|
513
|
|
Loan
Reduction
|
684
|
171
|
1076
|
Performance Future Investment Fund (FIF HBRIC)
|
FY20-21 Q1
|
Annual
|
Annual Plan
|
Actual
YTD
|
YTD
|
|
Return
|
Plan
|
YTD
|
Total
|
|
|
|
$000
|
$000
|
$000
|
%
|
|
Gross of Fees
|
|
|
1,769
|
3.9
|
|
Net of Fees
|
1,533
|
383
|
1,707
|
3.7
|
|
Capital Protection (2% annualized)
|
|
|
|
.05
|
|
Real net return
|
|
|
|
3.2
|
27. The FIF
HBRIC balance of $47.3M includes $46.3M of protected capital, which equates to
a potential cash withdrawal for HBRC of up to $1.0M. It should be noted that
the $1.0M is a life to date amount, not a FY20-21 amount.
28. The below
table reflects what the FIF HBRIC has achieved to date, against the FY20-21
Annual Plan.
|
FY20-21 Q1
|
Annual Plan
|
Annual Plan YTD
|
Actual YTD
|
|
|
$000
|
$000
|
$000
|
|
Capital
Protection
|
1,022
|
255
|
255
|
|
Available
for Dividend to HBRC
|
2,044
|
383
|
1,452
|
HBRIC
29. The
Adopted FY20-21 annual plan, forecast $3M in dividends to be received from
Napier Port Holdings Limited, via HBRIC.
30. Office’s
current forecast is the $3M will be received in December 2020.
31. There is
speculative potential upside to this forecast. Earlier in the year, when the
decision was made to cancel the interim dividend, the Napier Board did advise
they intended to review the full financial year result and outlook in November
2020 before deciding on a final dividend and ensuring they stay within their
dividend policy.
Decision Making
Process
32. Staff have assessed the
requirements of the Local Government Act 2002 in relation to this item and have
concluded that:
32.1. as this item is for
information only, the decision-making provisions do not apply
32.2. Any
decision of the sub-committee is in accordance with the Terms of Reference and
decision-making delegations adopted by Hawke’s Bay Regional Council
25 March 2020, specifically the Finance, Audit and Risk Sub-committee shall
have responsibility and authority to monitor the performance of Council’s
investment portfolio.
|
Recommendation
That the Finance, Audit and Risk
Sub-committee receives and notes the “Treasury Report to 30 June
2020”.
|
Authored by:
|
Geoff Howes
Treasury & Funding Accountant
|
Bronda Smith
Chief Financial Officer
|
Approved by:
|
Jessica
Ellerm
Group Manager Corporate Services
|
|
Attachment/s
|
⇩1
|
HBRC Q1
2020-21 Treasury Report
|
|
|