HAWKE’S BAY REGIONAL COUNCIL
Finance
Audit & Risk Sub-committee
Wednesday 12 August 2020
Subject: Treasury Report to 30
June 2020
Reason for Report
1. This item provides an update of compliance monitoring of treasury
activity and reports the performance of Council’s diversified investment
portfolios
Background
2. As a requirement of HBRC Treasury Policy, a quarterly update is
provided to the Financial Audit & Risk Sub-Committee (FARS) on all treasury
investments.
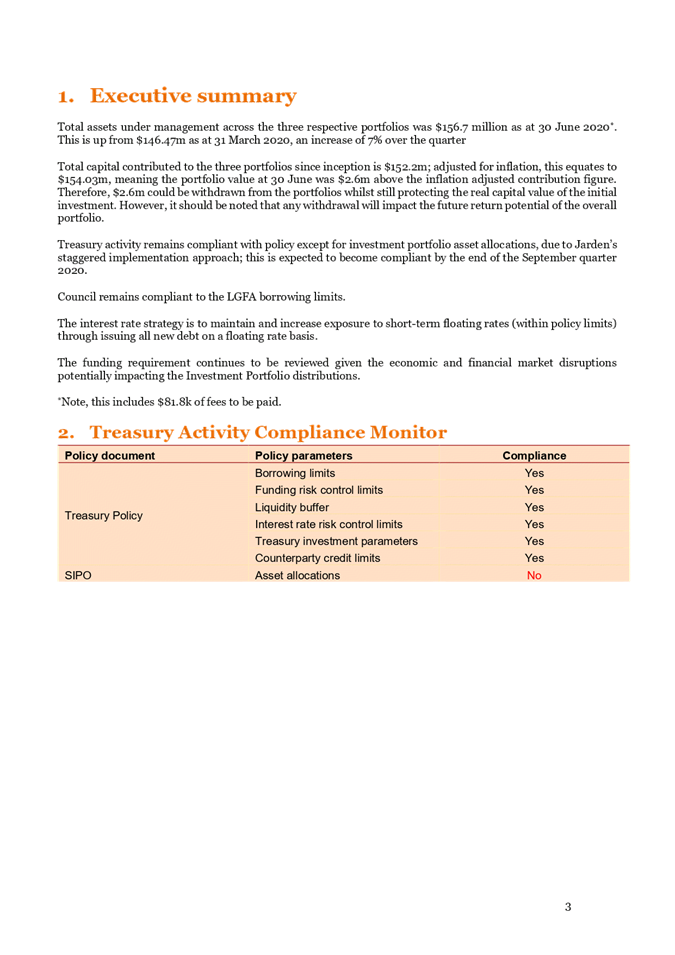
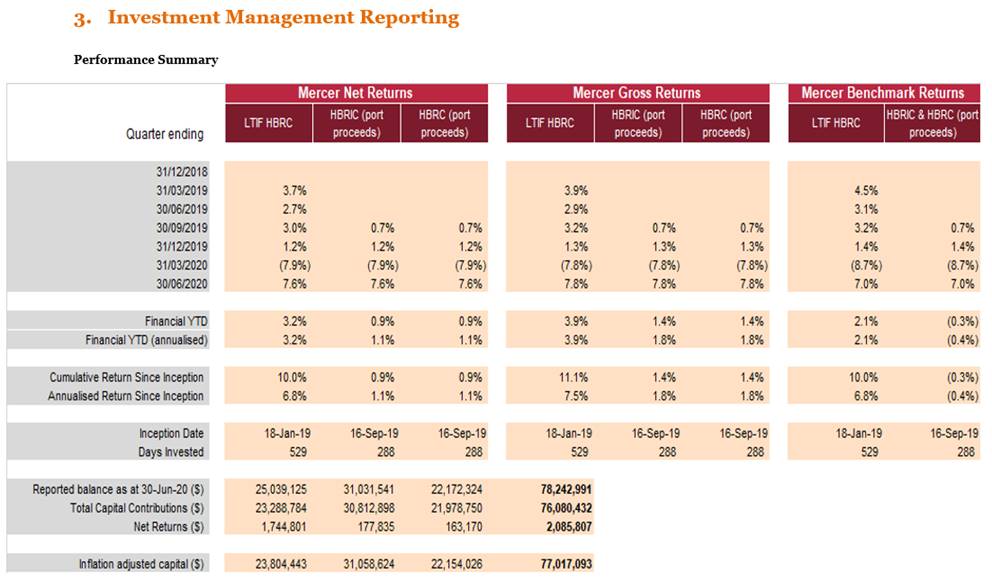
3. As at Q4, 30 June 2020, the Treasury Investments to be reported on
consist of:
3.1. Economic Impacts generated during the quarter
3.2. Cash and Cash Equivalents
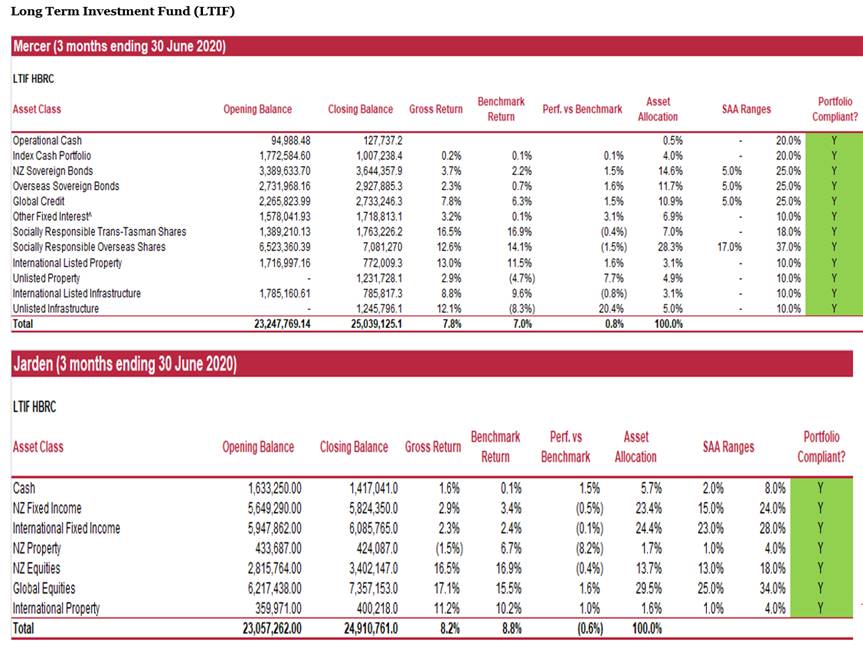
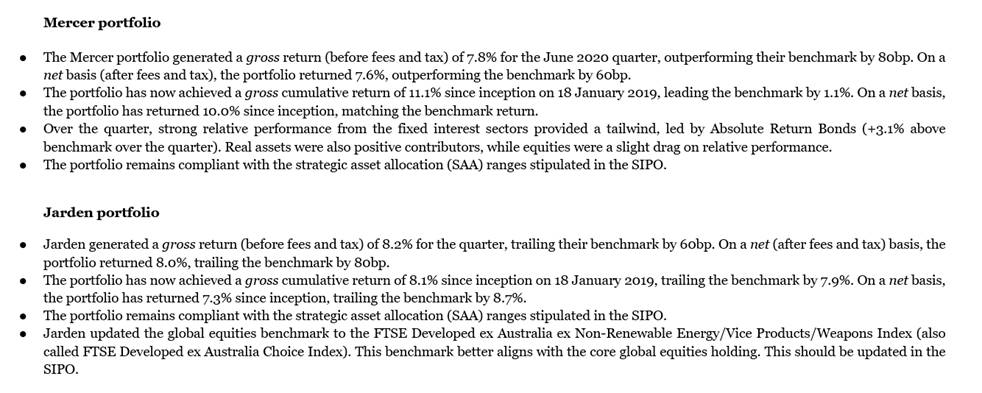
3.3. Disposals and Acquisitions
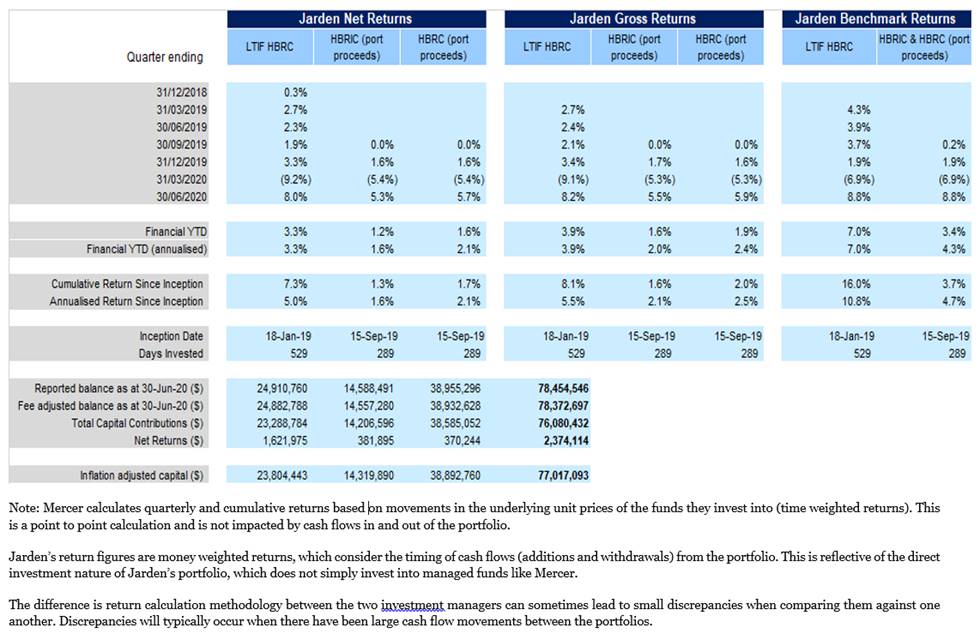
3.4. Externally Managed Investment Funds
3.4.1. Long-Term Investment Fund (LTIF)
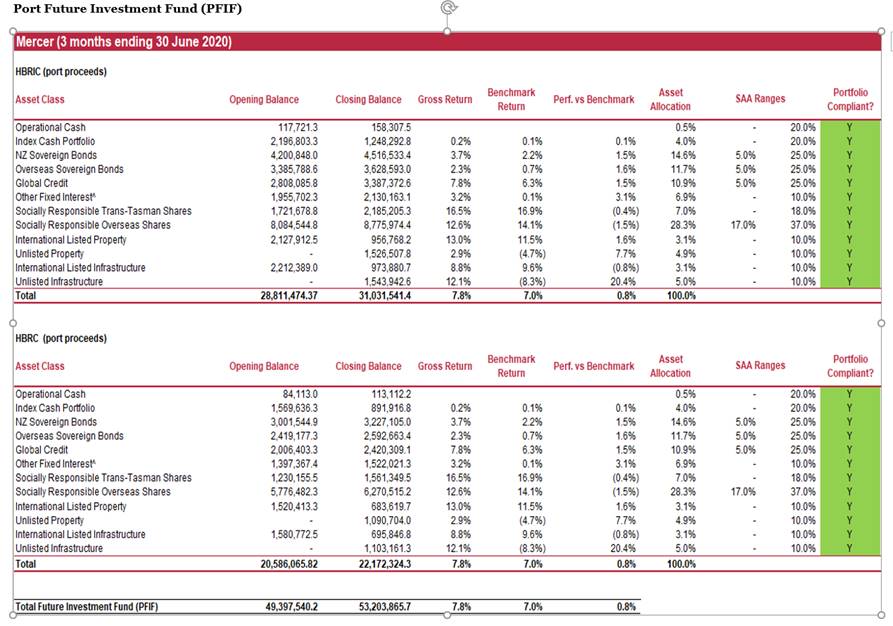
3.4.2. Future Investment Fund (FIF)
4. Since 2018, HBRC has procured treasury advice and services from PwC.
Their quarterly compliance report has been attached to this report.
5. Officers and FARS continue to develop the Treasury reporting
function. Enhancements included within this report is the reporting on
HBRC Cash and Cash Equivalents. Further enhancements will continue to be
developed as part of the FARS work programme for 2020-21.
Discussion
Economic
Impacts
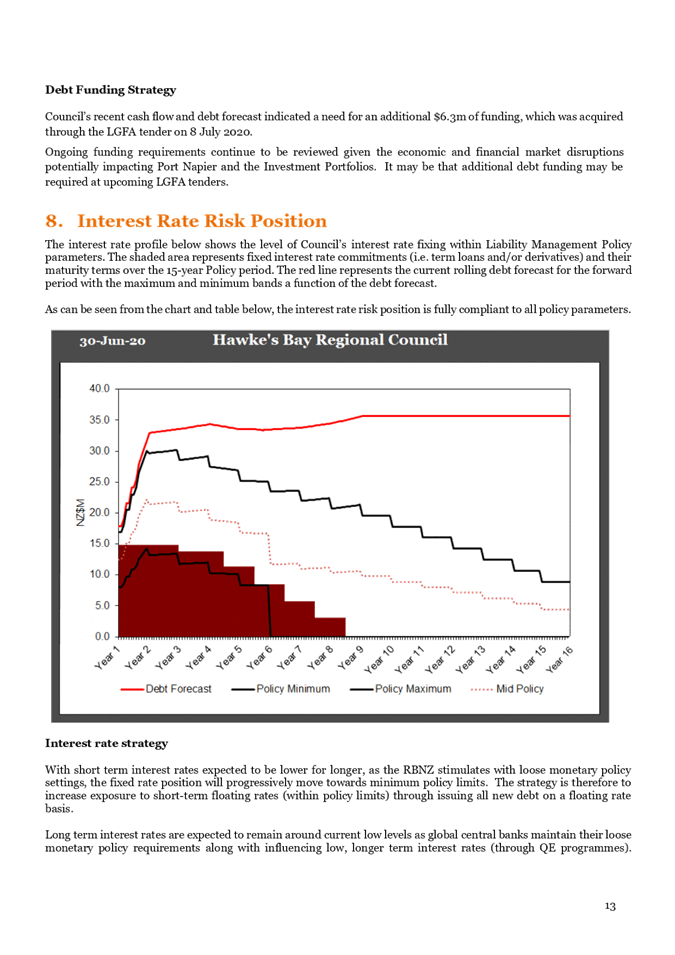
6. The fourth and final quarter for FY2020 illustrates how market
volatility can have such a significant impact on the value of HBRC
Investments. The vigorous bounce out of the Covid-19 NZ lockdown is
evident in the numbers provided throughout this report. It’s
important to note that while market volatility can create uncertainly, the
downs (and ups) will occur from time to time. The strategy of
diversifying an asset base is by far the best way of safeguarding any
investment; achieved through exposing the investment to the full spectrum of
global market movements.
7. The New Zealand economy has benefited by being in position of being
able to return to somewhat normal, but the outlook is a challenging one.
Globally, Governments which could afford to support their economies have been
using tools such as quantitative easing to boost liquidity and reduce interest
rates. However, there is still the perception that the global economy
will shrink by 4.9%, impacting the advanced economies the most.
8. A closed New Zealand border for the foreseeable future will mean a
smaller economy here. Because of our size, New Zealand will always be
quite reliant on imports and foreign markets. 10% of the New Zealand
economy pre Covid-19 could be attributed to travel and tourism; 40% coming from
international visitors. This reliance may reduce for a time and that
could boost sectors, such as import-competing manufacturing. It’s
worth keeping in mind that the economy will not return to how it was, it will
find a new equilibrium and set new trends and pivot from here.
9. As we are right now, the ‘bounce back’ has effectively
come from enhanced income supporting policies, lower interest rates, redirected
travel savings and an involuntary saving bump from lockdown. This is not
expected to last. Private consumption is expected to lessen in line with
the expected rise in unemployment, and any fixed mortgages needing to be
‘rolled over’ for any benefit to discretionary income, and the
Major Banks will hurt from the ‘missed’ new lending cycle.
The ANZ central forecast sees GDP returning to pre-crisis levels in mid-2022.
Cash and Cash Equivalents
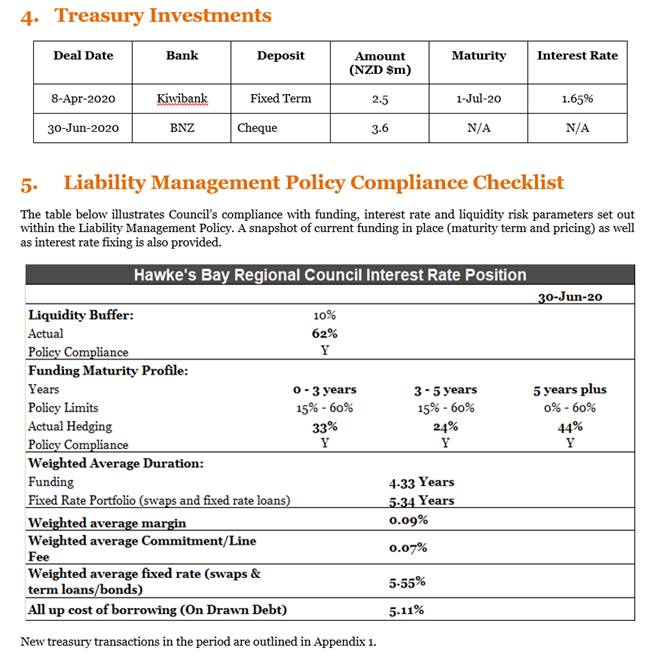
10. As at
June 30, HBRC had one Term Deposit ($2.5m) returning 1.65% and held $3.6m in
its Cheque Accounts.
11. HBRC
monthly cash liquidity position.
|
Cash
Position
|
Jan 20
|
Feb 20
|
Mar 20
|
Apr 20
|
May 20
|
Jun 20
|
|
Millions (NZD)
|
Actual
|
Actual
|
Actual
|
Actual
|
Actual
|
Actual
|
|
Mean
|
6.8
|
7.2
|
5.2
|
6.5
|
3.3
|
4.1
|
|
High Point
|
21.7
|
22.2
|
9.4
|
15.8
|
6.2
|
6.3
|
|
Low Point
|
2.6
|
4.8
|
2.8
|
2.6
|
1.4
|
1.4
|
|
Available facility*
|
5.0
|
5.0
|
5.0
|
5.0
|
5.0
|
5.0
|
|
*
facility available to HBRC is the BKBM + 1.1% margin. As at June 30, this
would cost 1.4% to call on.
|
12. Returns from assets classes such as Cash and Cash Equivalents will
be unfavorable, when compared to Pre Covid-19 levels as mainly due to lower
economic growth and controlled inflation.
Debt Funding
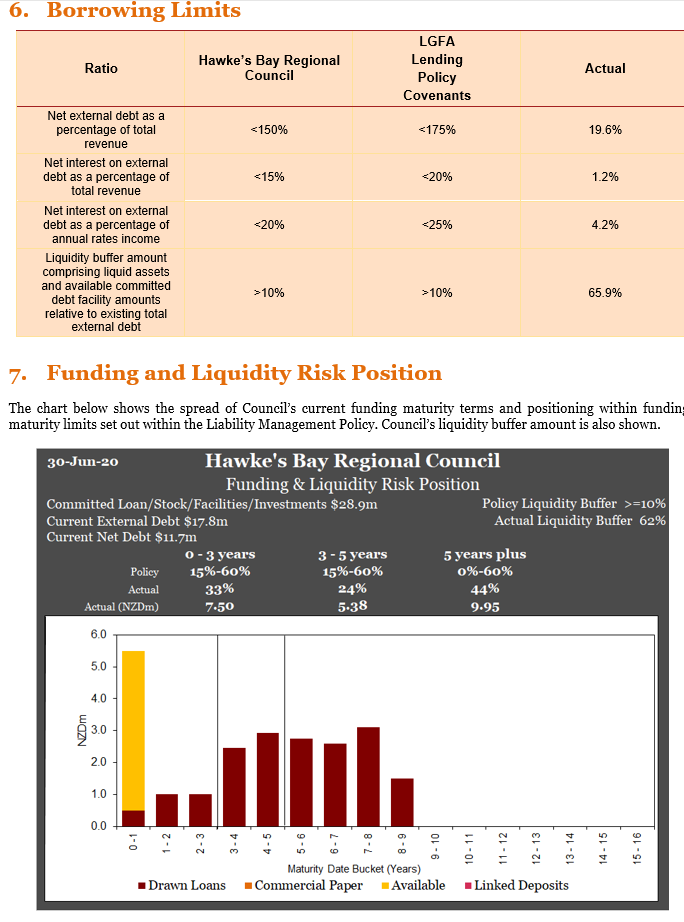
13. Council acquired $6.3m of funds through the LGFA tender on 8 July
2020, with repayments due in 2024 and 2025.
Managed Funds
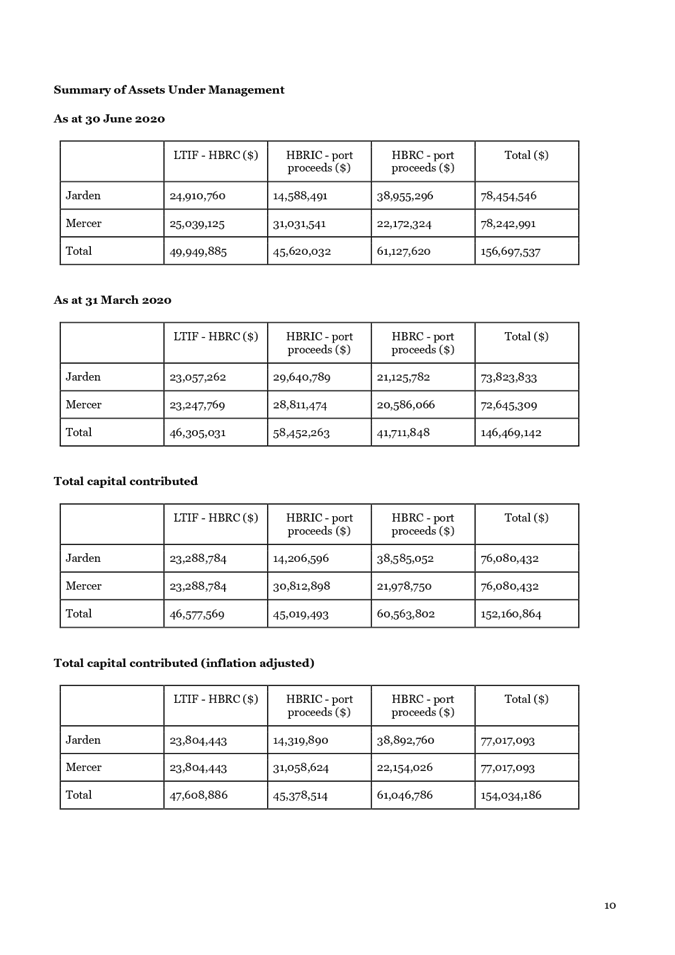
14. The Total
capital invested as at 30 June 2020 was $156.6m, this represents a true return
of $2.6m (1.68%) return on the original investment after adjusting for
inflation & fees.
15. Both Long
Term Investment Fund (LTIF) and Future Investment Fund (FIF) have improved
positions since the last reported positions in May 2020 and Q3 (March 2020).
16. CPI
Protected Capital Amounts and Fund Totals:
|
Fund
|
Total Capital Contributed30/6/19
|
CPI Protected Capital 30/6/19
|
Total Capital Contributed
|
CPI Protected Capital 30/6/20
|
Value
31 Dec 19
|
Value
31 March 20
|
Value
30 Jun 20
|
|
|
$
|
$
|
$
|
$
|
$
|
$
|
$
|
|
LTIF
|
40,000,000
|
40,280,240
|
46,577,569
|
47,608,886
|
50,651,390
|
46,305,061
|
49,921,914
|
|
FIF (HBRC Held)
|
-
|
-
|
60,563,802
|
61,046,786
|
44,703,199
|
58,452,264
|
61,104,952
|
|
Fund
|
Total Capital Contributed30/6/19
|
CPI Protected Capital 30/6/19
|
Total Capital Contributed
|
CPI Protected Capital 30/6/20
|
Value
31 Dec 19
|
Value
31 March 20
|
Value
30 Jun 20
|
|
|
$
|
$
|
$
|
$
|
$
|
$
|
$
|
|
FIF (HBRIC Held)
|
-
|
-
|
45,019,493
|
45,378,514
|
60,013,349
|
41,711,847
|
45,588,822
|
|
Total
|
40,000,000
|
40,280,240
|
152,160,864
|
154,034,186
|
155,367,938
|
146,469,172
|
156,615,688
|
Long Term
Investment Fund (LTIF)
17. The LTIF
has benefited form being invested over a longer period, when compared to the
FIF, which was invested during Q2 of the FY20 Year.
18. The Fund
is fully compliant to the SIPO’s stipulated strategic asset allocation.
19. Below is
financial year returns:
|
FY20
|
|
Return
|
|
|
%
|
|
|
Return
|
Jarden
|
Mercer
|
Total
|
Jarden
|
Mercer
|
Total
|
|
Gross of Fees
|
860,114
|
703,263
|
1,563,377
|
3.7%
|
3.0%
|
3.4%
|
|
Net of Fees
|
719,659
|
698,622
|
1,418,281
|
3.1%
|
3.0%
|
3.1%
|
|
CPI
|
|
|
|
|
|
1.5%
|
|
Real net return
|
|
|
|
1.6%
|
1.5%
|
1.6%
|
20. From
inception the LTIF has returned a CPI Protected Return of 4.9% (4.5% Jarden /
5.2% Mercer).
Future Investment Fund
(FIF)
21. Funds
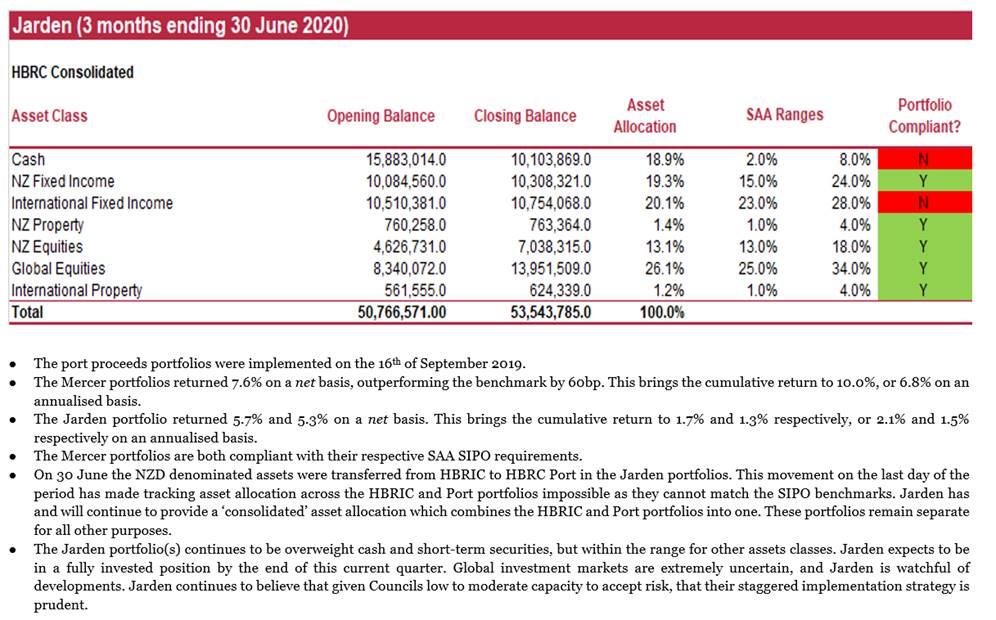
invested with Mercer are fully SIPO compliant. Jarden expects to be fully
compliant by Q1 2021. This is in line with previous reports of Jarden’s
approach of a staggered approach of investing.
22. On 30
June, HBRC instructed Jarden to transfer the NZD denominated assets from HBRIC
to HBRC, totaling a $16.6m Transfer. Jarden’s approach to manage the SIPO
requirements will be to review the FIF on a consolidated level. This transfer
represents the Sale & Purchase Agreement between HBRC and HBRIC Ltd, as
recommended and agreed on at the 24 June 2020 Regional Council Meeting.
23. Combined
HBRC and HBRIC Returns:
|
FY20
|
Return
|
% (Annualised)
|
|
Return
|
Jarden
|
Mercer
|
Total
|
Jarden
|
Mercer
|
Total
|
|
Gross of Fees
|
862,026
|
414,957
|
1,276,983
|
2.1%
|
1.0%
|
1.5%
|
|
Net of Fees
|
698,261
|
412,218
|
1,110,479
|
1.7%
|
1.0%
|
1.3%
|
|
CPI
|
|
|
|
|
|
0.8%
|
|
Real net return
|
|
|
|
0.9%
|
0.2%
|
0.5%
|
24. From
inception the FIF has returned a CPI Protected Return of 0.3% (0.5% Jarden /
0.0% Mercer).
Outlook
25. The lower
the starting point for interest rates and the higher the starting point for
equity valuations, the lower the return assumptions will be for all asset
classes. The below benchmark returns have been provided by Jarden (29 May 2020)
and may help facilitate in modeling future returns for each asset class:
|
Cash
|
2.7% pa
|
|
New Zealand debt
securities
|
3.6% pa
|
|
Global debt
securities (unhedged)
|
2.5% pa
|
|
Global debt
securities (hedged)
|
3.6% pa
|
|
New Zealand
equities
|
6.3% pa
|
|
New Zealand
property
|
7.0% pa
|
|
Australian
equities
|
6.9% pa
|
|
Global equities
|
6.0% pa
|
|
Alternatives
|
5.9% pa
|
Note: These predictions do
not form recommendations.
26. With the
current 50/50 Growth/Income spilt in stipulated strategic asset allocation,
this expects a return of 4.9% (less than the Targeted 5%). To achieve 5%,
the split would need to be 45/55 in favor of Growth.
27. Given the
economic climate and the fiscal position of the organisation, Council could
consider operating outside of the treasury policy and not look to protect the
capital base of the manage funds by adjusting for inflation. This would
allow for more funds to be available for withdrawal to finance the
origination’s shortfall in investment income.
28. To enable
this to happen for the FIF, Council would need to consult on the change as the
Significance and Engagement Policy has listed the proceeds of the sale of Napier
Port as inflation adjusted capital base.
29. This
could be considered by Council for the LTIF as this fund is not listed in the
Significance and Engagement policy.
30. Council
would need to consider the longer-term impacts of having a reduced capital base
versus the short-term impact of a reduction in the shortfall and officers would
recommend an analysis of the impacts if Council would like to consider this as
an option.
Next Steps
31. The
Annual Treasury Reporting requirements will be delivered as part of Annual
Report, due to timing of the year end process and the revaluations of the other
investment assets. The report will be included as part of the report for
the Finance, Audit and Risk Committee during the recommendation for the adoption
of the Annual Report which will be scheduled in October following the
finalisation of the Audit Plan.
Decision Making
Process
32. Staff have assessed the
requirements of the Local Government Act 2002 in relation to this item and have
concluded that:
32.1. as this report is for
information only, the decision-making provisions do not apply
32.2. any
decision of the sub-committee (in relation to this item) is in accordance with
the Terms of Reference and decision-making delegations adopted by Hawke’s
Bay Regional Council 25 March 2020, specifically the Finance, Audit and
Risk Sub-committee shall have responsibility and authority to:
32.2.1. Monitor the performance of
Council’s investment portfolio.
Recommendation
That the Finance, Audit and Risk
Sub-committee receives and notes the “Treasury Report to 30 June
2020”.
|
Authored by:
|
Geoff Howes
Treasury & Funding Accountant
|
Bronda Smith
Chief Financial Officer
|
Approved by:
|
Jessica
Ellerm
Group Manager Corporate Services
|
|
Attachment/s
|
⇩1
|
HBRC Treasury
Reporting as at 30 June 2020
|
|
|