Meeting of the Hawke's Bay Regional Council Maori
Committee
Date: Wednesday 6 May 2020
Time: 10.00am
|
Venue:
|
Online by Zoom Invitation and
livestreamed on the HBRC Facebook page
|
Agenda
Item Subject Page
1. Karakia
/Welcome/ Apologies /Notices
2. Conflict
of Interest Declarations
3. Short Term
Replacements for 6 May 2020 Meeting 3
4. Confirmation of
Minutes of the Maori Committee meeting held on 4 March 2020
5. Call for Minor
Items Not on the Agenda 5
Information or Performance Monitoring
6. Take Ripoata
ā Takiwā – Taiwhenua Representatives' Updates 7
7. Biosecurity -
Regional Pest Management Plan and Pest Control Activities 19
8. Review of HBRC
Activities in relation to the Mohaka Valley TB Outbreak 27
9. Verbal Current
Issues Updates by the HBRC Chair and Chief Executive
10. Heretaunga Plains Flood
Control Scheme Level of Service Review 33
11. Hawke's Bay Summber 2019-20 39
12. Climate Change Working Group
Update 53
13. Water Update 57
14. HBRC 28 April 2020
Organisational Activities Update 67
15. Discussion of Minor Matters
Not on the Agenda 89
HAWKE’S BAY REGIONAL COUNCIL
Māori
Committee
Wednesday 06 May 2020
SUBJECT: Short Term Replacements for 6 May
2020 Meeting
Reason for Report
1. The Māori
Committee Terms of Reference makes allowance for short term replacements
(proxy) to be appointed to the Committee where the usual member/s cannot
attend.
|
Recommendation
The
Māori Committee agrees that ______________ be appointed as member/s of the Māori Committee of the Hawke’s Bay Regional Council for the
meeting on Wednesday, 6 May 2020 as short term replacements(s) for ________________
|
Authored by:
|
Annelie Roets
Governance Administration Assistant
|
|
Approved by:
|
James Palmer
Chief Executive
|
|
Attachment/s
There are no
attachments for this report.
HAWKE’S BAY REGIONAL COUNCIL
Māori
Committee
Wednesday 06 May 2020
Subject: Call for Minor Items
Not on the Agenda
Reason
for Report
1. This item provides the means for committee members to raise minor
matters they wish to bring to the attention of the meeting.
2. Hawke’s Bay Regional Council standing order 9.13
states:
2.1. “A meeting
may discuss an item that is not on the agenda only if it is a minor matter
relating to the general business of the meeting and the Chairperson explains at
the beginning of the public part of the meeting that the item will be
discussed. However, the meeting may not make a resolution, decision or
recommendation about the item, except to refer it to a subsequent meeting for
further discussion.”
Recommendations
3. That the Māori Committee accepts the following “Minor Items Not on the Agenda” for
discussion as Item 15
|
Leeanne Hooper
GOVERNANCE LEAD
|
James Palmer
CHIEF EXECUTIVE
|
HAWKE’S BAY REGIONAL COUNCIL
Māori
Committee
Wednesday 06 May 2020
Subject: Take Ripoata ā
Takiwā – Taiwhenua Representatives' Updates
Reason for Report
1. This item provides the opportunity for representatives of the four
Taiwhenua to raise current issues of interest in their rohe for discussion at
the meeting as attached.
Decision Making
Process
2. Staff have
assessed the requirements of the Local Government Act 2002 in relation to this
item and have concluded that, as this report is for information only, the
decision making provisions do not apply.
|
Recommendation
That the Maori Committee receives and
notes the “Take Ripoata ā
Takiwā – Taiwhenua Representatives' Updates”.
|
Authored by:
|
Annelie Roets
Governance Administration Assistant
|
|
Approved by:
|
Pieri
Munro
Te Pou Whakarae
|
|
Attachment/s
|
⇩1
|
Heretaunga
Taiwhenua Report
|
|
|
|
⇩2
|
Kahungunu
Executive report
|
|
|
|
⇩3
|
Tamatea
Taiwhenua Report
|
|
|
|
⇩4
|
Te Whanganui
ā Orotu Taiwhenua report
|
|
|
|
Heretaunga
Taiwhenua Report
|
Attachment 1
|
|
Kahungunu Executive report
|
Attachment 2
|
|
Tamatea Taiwhenua Report
|
Attachment 3
|
|
Te Whanganui ā Orotu
Taiwhenua report
|
Attachment 4
|
HAWKE’S BAY REGIONAL COUNCIL
Māori
Committee
Wednesday 06 May 2020
Subject: Biosecurity - Regional
Pest Management Plan and Pest Control Activities
Reason for Report
1. This item provides an overview of Biosecurity activities, including
TB control, possum numbers and progress towards achieving predator free
Hawke’s Bay.
Background
2. The HBRC
Biosecurity function comprises of three core teams, Pest Animals (3.6 FTE),
Predator Free Hawkes Bay (6 FTE’s) and Pest Plants (4.4 FTE). The budget
includes just over $1.9m for internal staff time and an additional $1.6m for
external operating costs. The primary role of these teams is to deliver the Hawke’s
Bay Regional Pest Management Plan (RPMP), a statutory document underpinned
by the Biosecurity Act 1993 (the Act) that provides the framework for the
management of animal, plant, marine and horticultural pests in Hawke’s
Bay.
3. Regional councils have a mandate under Part 2 of the Act to provide
regional leadership in activities that prevent, reduce, or eliminate adverse
effects from harmful organisms that are present in their region. Council
therefore has a leadership role in pest management in the Hawke’s Bay
region.
Discussion
4. Since the
development of Council’s first Pest Management Strategy in July 1996, significant
benefits have accrued to the region’s economy from pest plant and animal
control. Although over the past 20 years approximately 80% of Council’s
biosecurity resource have focussed on pests affecting agricultural production,
there have been significant biodiversity gains arising from the delivery of
these programmes. During the last RPMP review (2017-18), more emphasis was
placed on managing environmental pests. As a result the revised RPMP (2018-28)
includes new programmes to manage predators, feral goats, wilding conifers and
marine pests, as well as the inclusion of exclusion pests and a framework to
secure possum eradication long-term.
5. The RPMP operates within the administrative the boundaries of the
Hawke’s Bay region and covers a total area (land and sea) of 1,419,153
hectares. The RPMP proposes to remain in force for a period of 20 years
with a review being undertaken after 10 years from the date of commencement.
6. Staff manage
Biosecurity programmes in both rural and urban areas, targeting specific
species for control or eradication. This endeavour involves working closely
with farmers, urban residents and a wide range of organisations to effectively
manage and control a range of pests. Staff also work closely with other
internal teams, including Biodiversity, Catchment Management, Science,
Engineering, and Open Spaces,
7. The RPMP contains 33 pest plants, 23 pest animals, two marine pests
and five horticultural pests. These pests sit within an Exclusion, Eradication,
Progressive Containment, Sustained Control or Site-led programme. Some of the
key programmes contained within the RPMP are as follows.
8. Council’s biosecurity functions are currently under review by
an experienced external consultant. This review is intended to meet the requirements
of S17a of the Local Government Act. This review will consider the biosecurity aspects of cost-effectiveness of current
arrangements for meeting the needs of communities within its district or region
for good-quality local infrastructure, local public services, and performance
of regulatory functions.
Possum Control Area
(PCA) programme
9. Hawkes Bay Regional Council has been controlling possums through its
Possum Control Area (PCA) programme since 2001. This is a flag ship biosecurity
programme with over $15m invested directly by Council in the initial knockdown
and maintenance of low possums numbers to date. There has been a very high
level of support for the PCA programme, and a strong belief by most land
occupiers within the programme that it is providing value for money for
Biosecurity ratepayers. The PCA programme was initiated to deliver multiple
benefits for ratepayers including lowering the risk of TB, reducing the
economic and amenity damage caused by possums and improving biodiversity. A benefits
report done by the Lincoln Agricultural economic unit in 2006 also cited
economic benefits from reduced pasture browse by possums of up to $2/ha.
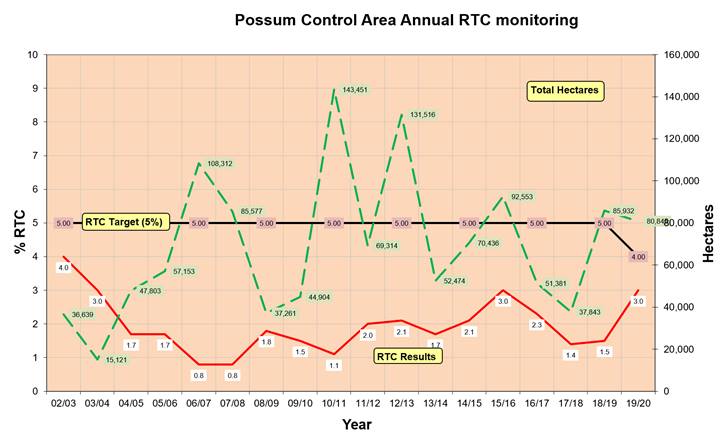
10. Although
the PCA programme is currently achieving its target of <4% residual trap
catch (RTC), the data (red line in Figure 1 below) suggests a slow increase in
RTC monitoring results. Over the last decade staff have seen an increase in the
number of farmers undertaking their own control rather than using a contractor
and in some cases this own control may not be being carried out annually and
effectively. Partly this is because possum numbers generally have been low for
a very long time and a level of complacency is developing forsome landowners on
the programme. Alongside this however some landowners within the programme have
experienced extremely challenging climatic conditions such as drought and
flooding and have had to carefully prioritise farm expenditure. This gradual
increase of the RTC also reflects the increasing number of properties that we are
having to follow up on as they a have failed their RTC requirements. These
changes are of concern to staff as only 10-15% of the overall PCA programme is
monitored annually, resulting in some properties going unmonitored for 8-10
years.
11. The areas
of current concern raised in paragraph 10 will be considered and addressed in
the S17a review underway. This review will be fully reported to council
on completion.
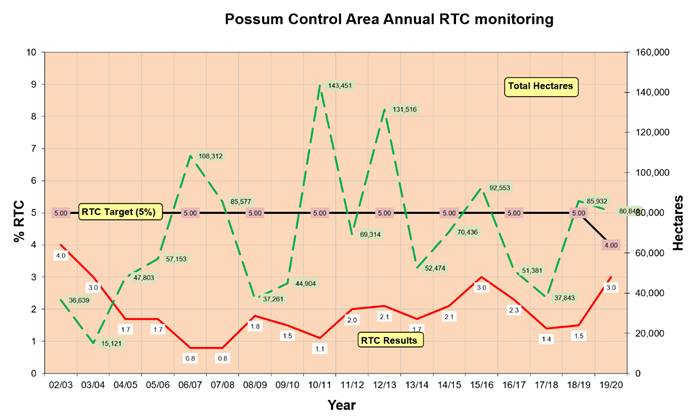
Figure 1 – PCA possum monitoring results
Rabbits
12. Rabbits
are included in the RPMP, with occupiers being responsible for maintaining
population levels below Level 4 on the Modified McLean Scale. Rabbits can
cause a number of adverse effects on economic well-being and environmental
values particularly in the more rabbit-prone lands. Staff undertake the
following duties:
12.1. Conduct
targeted surveillance of rabbit prone areas (Figure 2)
12.2. Conduct
periodic monitoring of rabbits at known or suspected Rabbit Haemorrhagic
Disease (RHD) areas
12.3. Provide
advice and education to land occupiers, including occupiers of small blocks, to
help them control rabbits by the most efficient and effective means, and
12.4. At its
discretion, and as set out in an approved management programme, meet up to 50%
of the cost of rabbit control on rateable land where rabbit numbers exceed 4 on
the McLean Scale.
13. Staff
released RHDV1 K5 (a variant of rabbit haemorrhagic disease virus) as part of a
national release in 2018 but it has not had any detectible impact.
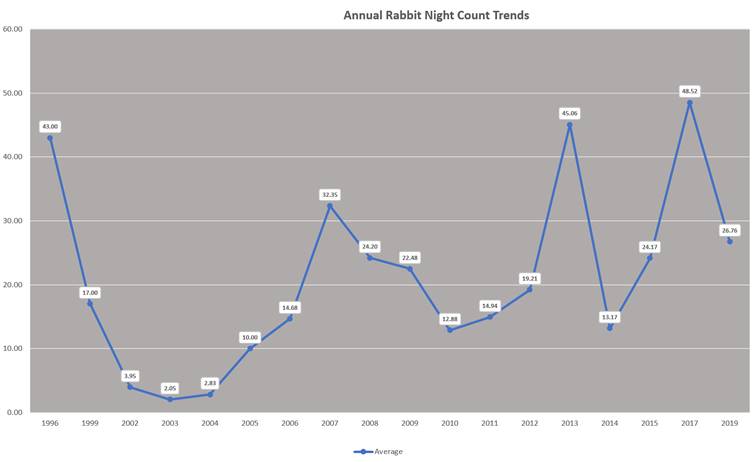
Figure
2 – regional annual rabbit night counts
Rooks
14. Rooks are declared a pest
in the RPMP in the Eradication category. Rooks feed on maize, peas, squash,
green feed and cereal crops at sowing and post emergent times, often causing
extensive damage to these crops. Staff manage
the rook eradication programme, targeting nests within all known rookeries during the breeding season. This
involves large-scale aerial and ground control operations. Staff conduct annual
rookery counts to determine the effects of the control. As shown in Figure 3
below, the rook programme has been very successful with rook numbers
significantly decreasing from 2789 nests in 06/07 to just 494 nests this
season. Operations are co-ordinated with Gisborne District Council and Horizons
Regional Council. Council provide information to land occupiers on rook
identification, the potential adverse effects that they cause, who to contact
for rook control, and the risks of inappropriate control. While it is predicted
that eradication will take approximately 30 years to achieve the success of the
programme over the last decade has already seen the economic damage caused by
rooks within the region significantly reduced.
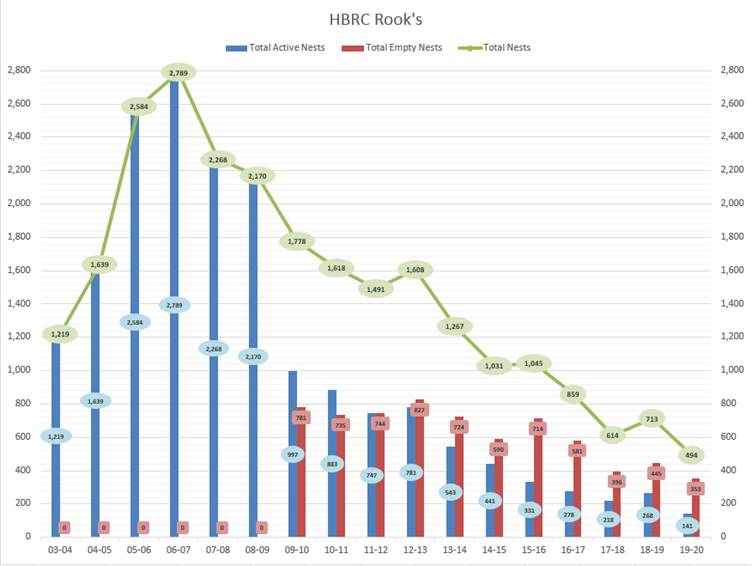
Figure
3 – Rook trend data
Chilean needle grass (CNG)
15. CNG is a pest plant which
can have significant negative impacts on animal welfare and poses a threat to
the sustainability of farming in Hawke’s Bay. CNG is a very cryptic
plant, which is hard to identify, seeds twice a year, is hard to kill without
non-target impacts, has potential erosion issues post control and is spread by
many vectors e.g. stock, people, machinery. Current measures undertaken have
significantly slowed the spread of CNG across the region. Its current known
extent is approximately 650ha, with an average of 11 new sites being detected
annually. Most new sites detected are adjacent to properties with CNG and have
gone undetected due to the cryptic nature of this pest pant. Staff have
increased the advocacy surveillance programme and tightened pathway
restrictions to minimise the further spread of CNG. The Pest Plant team focus
almost exclusively on CNG during November-December, as there is a very short
period where CNG can be identified and controlled. With additional properties
being discovered each season, staff workloads have increased.
Old man’s beard
16. Old man’s beard is a
significant environmental weed that smothers native vegetation. Its habitat is
typically scrubland, wasteland, riverbanks, hedgerows and native bush margins.
Old man’s beard is in the RPMP as a Progressive Containment pest and
comprises of two areas:
16.1. North of SH 5 –
old man’s beard is controlled across all land tenure with occupiers being
responsible for the control of old man’s beard on their land. HBRC will
at its discretion control some known infestations prior to seed set where it is
practical to do so. Most properties qualify for a subsidy under the pest plant
incentive scheme. HBRC undertakes an annual surveillance programme and works
with land occupiers to undertake control.
16.2. Ruahine and Kaweka
ranges – a buffer programme is in place to prevent the establishment of
old man’s beard in the ranges. HBRC, in partnership with the Department
of Conservation, control all old man’s beard within the park and a 500
metre buffer zone along the edge of the Ruahine and Kaweka ranges (as per map
in RPMP 2018-38).
Marine Pests
17. Two of the most invasive
marine pests have been include in the RPMP, being Mediterranean fanworm and
clubbed tunicate. Marine pests have the potential to adversely affect our
aquaculture and fishing industries, threaten human health and displace our
native marine plants and animals. Marine pests are very difficult to control
once established, with high control costs, rapid dispersal of very large
numbers of juveniles, and a lack of safe, effective control technologies.
Prevention is the best tool.
18. Currently there are only
two known marine pests in Hawke’s Bay, Asian kelp and Australian
tubeworm. In an attempt to prevent marine pests from establishing, a level of
foul rule for hulls was also included in the RPMP. Risk pathway management can,
at a relatively low cost, reduce the risk of marine pests. This is because,
compared with other regions, Hawke’s Bay has a rugged coastline and
limited number of ports/marinas.
19. Biosecurity staff have
established strong working relationships with key stakeholders in the marine
space (including MPI, Napier City Council, Napier Sailing Club, Harbourmaster,
the Napier Port and the Top of the North Marine Biosecurity Partnership) and
have developed a vessel risk assessment form that visiting vessels must
complete. This process recently picked up a vessel with Mediterranean fanworm
complete and carry out dive inspections of incoming vessels deemed high risk or
suspect. Having this programme in the RPMP allowed staff to act immediately,
removing adult farmworm with divers, wrapping the vessel and directing it to be
hauled out of the water.
Exclusion pests
20. Recent
amendments to the Biosecurity Act 1993 allow Regional Pest Management Plans to
include ‘Exclusion Pests’. These are pests that not known to be
established in the region. Alligator weed, marshwort, Noogoora bur, senegal
tea, spartina, and wallabies have been included in the RPMP under this
category. Declaring these species as pests under the Exclusion programme gives
Biosecurity staff the appropriate powers under the Biosecurity Act to respond
to a population or if a vector pathway is detected.
Predator Free
Hawke’s Bay
21. In 2011
Council partnered with the Department of Conservation and a range of other
stakeholders in the Poutiri Ao ō Tāne project to explore if landscape
scale predator control at lower cost was achievable on farmland. The strategic
intention behind this was to see if the foundation of success provided by the
PCA programme could be built on to leverage additional regional scale
biodiversity and economic outcomes for ratepayers. That 8000 ha project Poutiri
Ao ō Tāne then led on to an additional 26000 ha project Cape to City
in 2015 to operationalize at scale what was learned in Poutiri Ao ō
Tāne. In 2018 a four year project Whakatipu Mahia – Predator Free
was initiated under the Predator Free 2050 vision with funding from a range of
partners including PF 2050 Ltd. Whakatipu Mahia includes another 14000 ha of
predator control and extended control to test what might be required for large
scale possum eradication on farmland. It is currently the largest mainland
possum eradication programme ever undertaken in New Zealand. The last decade of
work has provided a regional foundation for Predator Free Hawkes Bay including:
21.1. The
mechanism has been created within the Regional Pest Management Plan 2019-2039
for both Predator Control Areas and Possum eradication areas. This allows
communities to support predator control or possum eradication based on the same
model as the last two decades of PCA programme success.
21.2. Understanding
some of the key research, technical and operational elements required for
successful large scale predator control or possum eradication on farmland. This
includes monitoring techniques, types of trap devices and placement, data
management and in the case of eradication barrier options to reinvasion. In
addition around 40 individual research and science projects have been completed
by Manaaki Whenua (Landcare Research) considering a range of elements related
to the programme. Research has been conducted on likely biodiversity outcomes,
habitat connectivity, cutting edge techniques like pheromone lures and
environmental DNA typing, wireless trap monitoring, education and engagement
programmes.
21.3. Understanding
how landscape scale predator control integrates into the range of other work
programmes required to drive greater biodiversity outcomes for ratepayers. A
number of Council activities deliver biodiversity benefits for example the
ecosystem prioritisation programme, catchment management team planting
activities, pest plant control and so on. Targeting landscape scale predator
control to ‘clusters’ of biodiversity where council (or the
community) has these additional investments will deliver better overall
biodiversity outcomes for the ratepayer.
22. We are
still some way away from being able to undertake landscape scale possum
eradication. However the last ten years has seen a solid foundation built to
step towards Predator Free Hawkes Bay through regional predator suppression at
the scale and level of success we have enjoyed on our flagship possum control
area programme. This will deliver significant additional biodiversity benefits.
The Parliamentary Commissioner for the Environment noted in her 2017 report
"Taonga of an island nation: Saving New Zealand’s birds”
predators are in the top three factors creating native birdlife decline.
Next
Steps
23. Hawke’s
Bay Regional Council has a regional leadership role in pest management and
Biosecurity has been core business of Council since its inception in 1989. The
Council substantially delivers this through the Regional Pest Management plan
which contains 61 pests. The Biosecurity team also supports and delivers pest
control outside of this plan, including targeted control of environmental and
agricultural pests at specific sites and working with community groups to
protect and enhance high biodiversity value areas. Staff also play a key role
in initiatives to support national coordination of Biosecurity practices such
as the Biosecurity Working Group and Biomanagers.
24. Internally
the Biosecurity team, works closely with other teams to integrate programmes,
such as Predator Free Hawke’s Bay, Biodiversity and Catchment Management,
to provide a holistic approach in environmental management.
25. Staff are
in the process of conducting an LGA section 17a efficiency and effectiveness
review of a range of Biosecurity operations in advance of the next LTP. The
intention of this review is to test whether the current programmes are targeted
and structured to deliver the best possible returns for ratepayer investment in
biosecurity activities within the region.
Decision Making Process
26. Staff have assessed the
requirements of the Local Government Act 2002 in relation to this item and have
concluded that, as this report is for information only, the decision making
provisions do not apply.
|
Recommendation
That the Māori
Committee receives and notes the “Biosecurity
- Regional Pest Management Plan and Pest Control Activities” staff
report.
|
Authored by:
|
Campbell
Leckie
Manager Catchment Services
|
Mark Mitchell
Team Leader/Principal Advisor,
Biosecurity/Biodiversity
|
Approved by:
|
Iain Maxwell
Group Manager Integrated Catchment
Management
|
|
Attachment/s
There are no
attachments for this report.
HAWKE’S BAY REGIONAL
COUNCIL
Māori
Committee
Wednesday 06 May 2020
Subject: Review of HBRC
Activities in relation to the Mohaka Valley TB Outbreak
Reason
for Report
1. This item provides background on Hawke’s Bay Regional
Council’s Possum Control Area (PCA) programme, our partnership with
vector control activities delivered under the National Bovine Tuberculosis Pest
Management Plan, and how that relates to the recent Bovine Tuberculosis
outbreak in the northern part of the region.
Background
2. The
Hawke’s Bay Regional Council has played an active role in managing the
risk of TB since 1996. In 2001 the first PCAs were formed. Since
then the PCA programme has grown to cover approximately 775,000ha with over
$15m invested directly by Council in the initial knockdown and ongoing maintenance
of possums to low densities.
3. The PCA
programme was initiated to deliver multiple benefits for ratepayers including
lowering the risk of TB, reducing the economic and amenity damage caused by
possums and improving biodiversity. A benefits report done by the Lincoln
Agricultural economic unit in 2006 also cited economic benefits from reduced
pasture browse by possums of up to $2/ha.
4. The PCA programme is implemented through the Regional Pest
Management Plan (RPMP) which is underpinned by the Biosecurity Act 1993.
A key feature of the RPMP is that once a PCA is created, land users within it
have an obligation, enforceable by Council compliance action to keep possum
numbers low on their property.
5. The RPMP recently underwent a review, with the new RPMP coming into
effect on 1 February 2019. This Plan is not required to be reviewed
until 1 February 2029, unless Council choses to.
6. Approximately
$1million dollars is invested annually in the PCA programme, with about half
internal staff time and half for external operational spend. We
monitor approximately 10% of the PCA annually and it currently takes
approximately 8-10 years to monitor all PCA’s within the programme.
7. Within the PCA area, possum monitoring is undertaken on between
80,000-100,000ha of land annually. This consists of approximately 1300 chew
card lines across the monitored area to assess possum densities.
8. Residual Trap Catch (RTC), is the number of possum detections per
unit of effort, according to a standard protocol specified by the National Pest
Control Agencies (NPCA). This reflects the density of possums that remain after
a control operation.
9. Land occupiers within the PCA programme must maintain possum
densities at or below 4% RTC. This was recently decreased from 5% RTC during
the Regional Pest Management Plan review. The following graph shows monitoring
results across the PCA programme since its inception.
10. HBRC
provides the following support to land occupiers in managing possums to the
required densities:
10.1. Subsidised
possum control products at Farmlands and PGG Wrightson
10.2. A PCA
buffer control programme along the boundary of crown estate to minimise possums
entering the PCA programme from unmanaged areas
10.3. A
maximum possum contractor rate of $2/ha. If land occupiers use a
contractor and the cost of possum control is greater than $2/ha, HBRC will
cover the additional cost
10.4. HBRC
also manages the DoC ‘exacerbator’ budget for smaller areas of DoC
estate within the PCA programme.
11. Production
forestry within the PCA programme is exempt from the RPMP rule, however a Good
Neighbour Rule (500m buffer) applies. This means forests adjoining land within
the PCA programme must manage possum densities at or below 5% RTC within a 500m
buffer along the forestry edge. While this usually requires production forestry
to manage a greater area than the 500 metre buffer to be confident that they
comply with the good neighbour rule, this exemption does pose a risk to the PCA
programme where forestry companies are not diligent in delivering annual
control.
TB outbreak
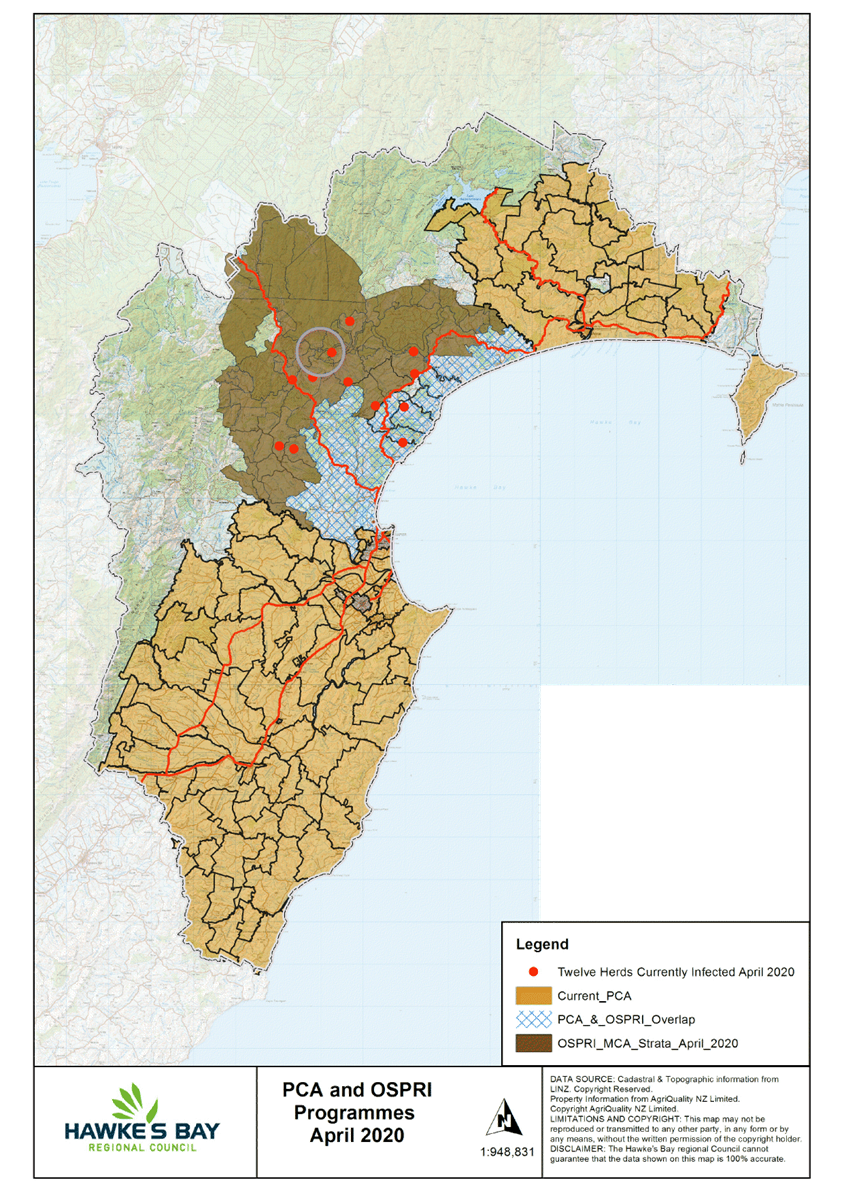
12. In April
2019 a TB infected herd was detected in the Waitara Valley. Since then,
further infected herds have been detected in Matahoura, Tutira, Waikoau,
Waipataki, Patoka, and Rissington. The source of TB infection in this outbreak
has been DNA strain-typed to wildlife from north of the Mohaka River which, as
shown in attachment 1 (purple circle), is well within the OSPRI managed area.
13. OSPRI is
the management agency in charge of managing TB in NZ. There has been some
confusion in the community regarding each organisations roles and
responsibilities, possibly due to HBRC undertaking vector control (possum
management) on behalf of OSPRI until September 2013, when OSPRI transitioned
this role to its own vector management department. In 2016 OSPRI reduced its
national funding by $20m and reduced their staff in Hawke’s Bay. The
vector management programme was then managed from Palmerston North.
14. HBRC
contributed towards OSPRI’s vector control costs up till 2016 via a
targeted TB rate. This was approximately 10% of the cost of annual vector
control within the region. When the national funding model changed, Councils
across NZ exited funding TB vector management. Council’s involvement with
OSPRI operational activities, and therefore relationships, were not required to
be as close post 2016 as they were previously.
15. In
addition to this change, within Hawkes Bay there was an agreed RPMP mechanism
and joint process (discussed below) to transition TB-Free vector control areas
over to HBRC management on the PCA programme. This process has worked
adequately till now and further reduced the need for the high level of
communication maintained while HBRC managed vector management on behalf of
OSPRI in the region.
16. When
OSPRI declare an area TB free and cease possum management it is transferred
into the HBRC PCA programme. During a three year period (2015-17) a large
number of PCAs were rolled off OSPRI management and were entered into the PCA
programme. The majority of these PCAs will now be affected by OSPRI’s
planned vector management programme (shown in Map 1 – hatching). HBRC are
working with OSPRI to notify affected PCA land occupiers of this change back to
OSPRI led management.
17. HBRC
undertook possum monitoring this financial year within nine PCA’s that
are within the blue hatched area in attachment 1. These PCA areas had an
average residual trap catch (RTC) of 2.9%, well below the 4% RTC requirement to
meet the plan rule. This monitoring data has been shared with OSPRI.
18. HBRC
staff were of the view that the transition process for vector control areas to
the PCA programme was working adequately. Staff were not aware of, nor held
information that could have made them aware of the imminent TB threat. This
outbreak was a surprise to HBRC staff.
19. What has
become apparent through the TB outbreak, largely across TB-Free vector control
areas, is that more regular operational communication is required again between
HBRC Catchment Services and OSPRI TB-Free staff. While OSPRI is the statutory
authority to manage bovine tuberculosis, any TB outbreak potentially impacts on
both HBRC’s management of the PCA programme and farmer relationships
within outbreak areas which HBRC values.
Discussion
20. For absolute
clarity, the current outbreak is not the result of HBRC failing in respect to
any of our operational or legislative requirements. While enhanced
communication between HBRC and OSPRI is desirable in future, a lack of
communication between the agencies was equally not the cause of this outbreak.
21. HBRC is
committed to maintaining low possum numbers within the PCA programme to help
minimise the risk of TB spreading in Hawke’s Bay. It is important to
note, however, the roles and responsibilities of each organisation.
22. HBRC has
a regional leadership role under the Biosecurity Act in managing pests, such as
possums. OSPRI is a not-for-profit limited liability company comprising a group
of companies inclusive of TBfree NZ Ltd and NAIT Ltd. TBfree NZ Ltd is the
statutory management agency for the National Bovine Tuberculosis Pest
Management Plan, pursuant to the Biosecurity Act 1993 and the Biosecurity
(National Bovine Tuberculosis Pest Management Plan) Order 1998. The
implementation of this legislation is funded through government contributions
and levies. HBRC has not has any formal input into the OSPRI vector management
programme since ceasing management of it in 2016.
23. It is
important that HBRC and OSPRI have a strong operational relationships and work
collaboratively. HBRC sits on the Hawke’s Bay TB Free committee and works
with the local OSPRI team in transitioning properties out of TB vector managed
areas into the HBRC PCA programme.
24. HBRC
staff were not approached nor privy to the recent review undertaken by OSPRI
and raised in discussion by OSPRI staff during the council presentation on 8
April 2020. Accessing this review might be useful in supporting the necessary
closer relationship between OSPRI and HBRC staff to assist in the coordinated
management of possums within the region. Staff are working with OSPRI to access
this report.
25. The
BioManagers Special Interest Group has formally approached OSPRI to take a
sector led process of re-engagement at a strategic level with OSPRI leadership.
We are particularly wanting to minimise risks of future outbreaks, and to
discuss how councils can better engage with OSPRI.
26. HBRC has
been working with OSPRI, attending community meetings, providing PCA data
offering assistance with land occupier contact information. The HBRC
Communications team has also offered to work with OSPRI in getting key messages
out.
Next Steps
27. Staff are
in the process of conducting an efficiency and effectiveness review of a range
of biosecurity operations including the PCA programme in advance of the next
LTP. This will be fully reported to Council at a future meeting.
28. The Group
Manager – ICM has approached OSPRI leadership to request that discussions
about our collective issues and exploration of how the two organisations can
work more collaboratively in future continue. This has been positively received
and we will seek to ensure engagement occurs both at a senior leadership level
and operationally within each organisation.
Decision
Making Process
29. Staff have assessed the
requirements of the Local Government Act 2002 in relation to this item and have
concluded that, as this report is for information only, the decision making
provisions do not apply.
|
Recommendation
That the Māori Committee receives the “Review
of HBRC Activities in relation to the Mohaka Valley TB Outbreak”
report.
|
Authored by:
|
Mark Mitchell
Team Leader/Principal Advisor,
Biosecurity/Biodiversity
|
Campbell
Leckie
Manager Catchment Services
|
Approved by:
|
Iain Maxwell
Group Manager Integrated Catchment
Management
|
|
Attachment/s
|
PCA
OSPRI Map 3
|
Attachment 1
|
HAWKE’S BAY REGIONAL COUNCIL
Māori
Committee
Wednesday 06 May 2020
Subject: Heretaunga Plains Flood
Control Scheme Level of Service Review
Reason for Report
1. This report provides an update on progress of the Heretaunga Plains
Flood Control Scheme Level of Service Review examining the merits of upgrading
the scheme from current level of protection 1 in 100 year (1% Annual Exceedance
Probability (AEP)) to a new level of protection 1 in 500 year (0.2% AEP).
Executive
Summary
2. The current levels of service are based on legal requirements,
community expectations and physical restrictions inherited over the evolution
of the Scheme. The flood control river assets are designed and maintained to
provide protection from flooding with up to a 1% chance of being exceeded in
any one year.
3. The Scheme, as we know it today, has evolved over the last 130 years
from the effort of Local River Boards in the late 1800s, through to the
Hawke’s Bay River Board, the Hawke’s Bay Catchment Board and since
1989, the Hawke’s Bay Regional Council. Improvements in the scheme
have followed significant flood events and specific catchment and asset
reviews.
4. Council operates and maintains a network of stopbanks, live edge
protection zones, hydraulic structures and pump stations, as well as managing
the river, stream and drainage channels to ensure they work as expected during
flood events. The overall aim of the scheme is to reduce the risk of
flood and erosion damage while maintaining a high quality river environment.
Background
5. The Heretaunga
Plains Flood Control Scheme covers the low lying historic river plains of the
Tutaekuri, Ngaruroro, Clive and lower Tukituki Rivers. It provides protection
against frequent flooding to most of Hastings, Flaxmere, Havelock North and
Napier urban areas. The area directly benefiting from the Scheme covers
approximately 39,000 hectares with a population of around 138,000 people living
within the scheme boundary. This equates to approximately 82% of the
Hawke’s Bay population.
6. Anticipated
projection of climate change in the Hawke’s Bay region suggests lower
total overall rainfall but more frequent, more intense, rain events in the
future. Seasonal changes are also anticipated with lower rainfall in
winter and spring and greater rainfall in summer and autumn. Greater
intensity events are likely to result in increased frequency of flooding and
may be a key driver for increasing the design level of protection afforded by
the flood control scheme.
7. The most recent
upgrade of the flood control scheme was undertaken more than 20 years ago
when land use on the plains was less intensive and land values much lower than
they are today.
8. Through the
2012 LTP process, HBRC noted that Level of Services would be reviewed over
time, but no further specific consultation was carried out. In the 2018-28 LTP
consultation document “Facing our Future,” the Heretaunga Plains
Flood Control Scheme Level of Service Review was not specifically consulted on
however the project was included as a major works in the pipeline and potential
for future consultation was identified. The project Heretaunga Plains Flood
Control Scheme named in this document states “Improve flood carrying
capacity from a “1 in a 100-year” event level to a “1 in a
500-year” level, in response to climate change.” No further
consultation with the public has been carried out since the Facing the Future
document was released.
9. In recent
years, the Ministry for Environment provided guidance to local government on
the significance of climate change and therefore this puts additional emphasis
on understanding the impact of climate change and considering the level of
service provided. (Climate Change Effects and Impacts Assessment – A
Guide Manual for Local Government in New Zealand (2nd edition
2008)).
10. A budget of $20M has been
allocated for the next 10 years (2018-28).
Discussion
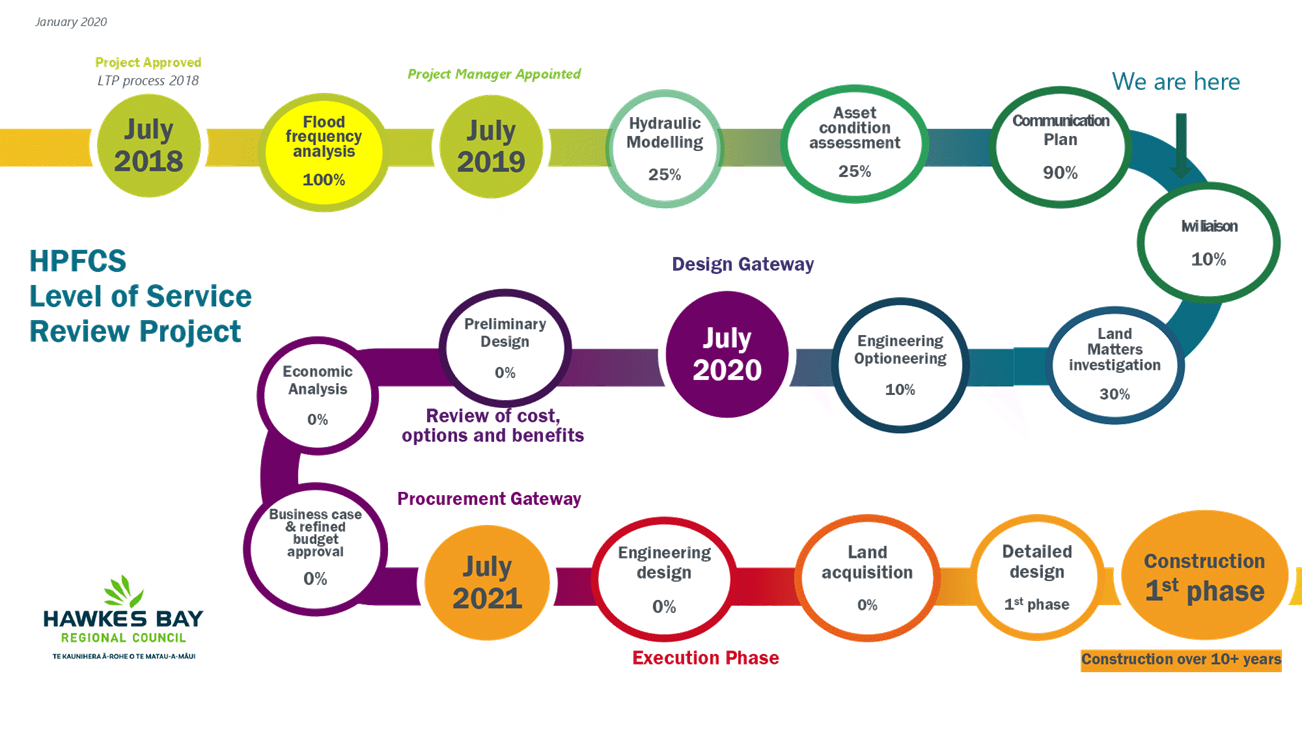
11. The
paragraphs below describe a high level schedule, key deliverables and project
gateways. Alternatively, Attachment, Heretaunga Plains Flood Control
Scheme Level of Service Review shows a diagram of key project activities.
12. July
2018 – The project was approved for
delivery through approval of the LTP. During the 2018-19 financial year,
flood frequency analysis (based on existing hydrological records), has been
carried out on Tutaekuri, Ngaruroro, Clive and lower Tukituki rivers.
Flood frequency analysis is a technique used to predict flow values corresponding
to specific return periods for a given river. The information is used as
an input to the hydraulic modelling.
13. July
2019 – A dedicated project manager was
assigned and project team briefed on deliverables, timeframe and budget was
allocated to specific tasks.
13.1. Hydraulic Modelling
– 1:500, 1:200 and 1:100 event scenarios are being developed for each
river.
13.2. Asset Condition
Assessment – Assessing the condition and likely performance of the
existing flood protection assets. To date we have completed the
assessment for the Tutaekuri River and the assessment for remaining assets in
the scheme will follow this year (2020).
13.3. Consultation and
Communication – One of the key steps moving forward is to understand
how we proceed with communication and consultation with iwi and
stakeholders. A detailed plan is currently being developed.
13.4. Iwi engagement –
We are seeking early engagement from effected iwi group so the cultural
assessment and effects of this project on these values is encounter from the
beginning.
13.5. Land
Management Investigation – This includes land identification, risk
assessment, ownership, land use and what future land acquisition we may require
for the potential engineering work. Also
looking into significant cultural sites which are likely to be effected by the
flooding.
13.6. Engineering
Optioneering – It is possible that a 1:500 year flood protection may
be unachievable in some areas due to financial constraints, land constraints,
engineering limitations, economic analysis or environmental impact. This
part of the work will indicate what other options there might be for enhancing
the current flood protection to deal with the effects of climate change.
14. July 2020- Project Gateway for Design
14.1. Preliminary Design and
Economic Analysis – Preliminary/concept design work and economic
analysis from engineering optioneering work.
14.2. Business case and
refined budget approval – Final report and council paper with refined
budget for 10 year period with design options for each river including a
detailed project risk assessment.
15. July 2021- Project Gateway for Procurement
15.1. Engineering design
and detailed design – This process allows us to identify, refine and
solve problems for recommended options and it will also allow us to define
phases for construction, land requirements, consents, tendering, contract
preparation, etc.
15.2. Construction
phase 1 – Contract Award and commencement of construction on high
priority locations.
Decision making
Process
16. Staff
have assessed the requirements of the Local Government Act 2002 in relation to
this item and have concluded that, as this report is for information only, the
decision making provisions do not apply.
|
Recommendation
That the Māori Committee receives the “Heretaunga Plains Flood
Control Scheme Level of Service Review” staff report.
|
Authored by:
|
Martina
Groves
Acting Regional Asset Manager
|
|
Approved by:
|
Chris Dolley
Group Manager
Asset Management
|
|
Attachment/s
|
⇩1
|
Heretaunga
Plains Flood Control Scheme - Level of Service Review Project
|
|
|
|
Heretaunga
Plains Flood Control Scheme - Level of Service Review Project
|
Attachment 1
|
HAWKE’S BAY REGIONAL COUNCIL
Māori
Committee
Wednesday 06 May 2020
Subject: Hawke's Bay Summber
2019-20
Reason for Report
1. Drought conditions developed in Hawke’s Bay and across the
North Island during summer 2019-20, leading to the declaration of a
“large scale adverse event” by the Agriculture Minister Damien
O’Connor on 12 March 2020. This paper places the rainfall, river
flows, groundwater levels and soil moisture levels of summer 2019-20 in an
historical context and describes how the dry conditions evolved.
Executive Summary
2. Hawke’s Bay had below normal rainfall, above average
temperatures and relatively high rates of potential evapotranspiration from
November 2019 to April 2020. Rainfall accumulations from November to
April were lower in 2019-20 than in the 2012-13 drought in all areas of the
region, apart from Waikaremoana and the Kaweka Range.
3. River flows have generally tracked below normal this summer.
Northern parts of Hawke’s Bay did not experience extreme low flows.
Ngaruroro River experienced levels comparable to the 2012-13 drought. The
Tukituki River recorded the lowest mean flows on record.
4. This pattern was reflected in the groundwater levels, with the Ruataniwha
basin (in the Tukituki catchment) having the highest proportion of monitoring
wells at their lowest recorded water levels.
5. The weather pattern in 2019-20 featured higher than normal mean sea
level pressure to the northwest and east of New Zealand and lower than normal
pressure to the southwest. A relatively deep, warm and stable layer of
air over the North Island meant that active systems approaching from the
southwest weakened as they moved north. Above average sea temperatures
contributed to the hot weather and high evaporation rates.
6. The El Niño-Southern
Oscillation was in a neutral phase through summer and is expected to remain
that way through the coming autumn and winter. A westerly flow was
predominant during the summer and seasonal forecast models continue with that
pattern for the next few months.
Background
7. Prior to summer 2019-20, the most recent drought experienced in
Hawke’s Bay was in the summer of 2012-13. The 2012-13 drought
affected much of the North Island and was declared a medium scale adverse event
on 15 March 2013 by the Minister for Primary Industries. With respect to
different parts of Hawke’s Bay, NIWA assessed the 2012-13 drought as
either the worst in 40 years or second only to 1997-98. The summer
weather was dominated by “blocking” high pressure systems which
prevented rain-bearing fronts from moving over New Zealand1.
8. Following the 2012-13 drought, NIWA developed a New Zealand Drought
Index (NZDI) based on four common indices of climatological drought. Throughout
summer 2019-20 the NZDI typically categorised Hawke’s Bay as very dry or
extremely dry, with parts of the region in drought or severe drought.
Drought or severe drought levels were largely along the western ranges,
particularly the Ruahine Range and adjacent hill country and surrounds.
At the end of April the NZDI still categorized eastern Hawke’s Bay as dry
but extremely dry or in drought on the Heretaunga Plains, the Ruataniwha Plains
and southern coastal areas.
Discussion
Rainfall and Potential
Evapotranspiration
9. The 2019-20 drought began its development in November and followed a
wetter than average early spring. November was not only a month of below
normal rainfall, but temperatures were very hot. Daytime temperatures
reached 3°C above the
monthly average and the average potential evapotranspiration (PET) rate for the
month was the highest recorded on the Ruataniwha Plains for November since
monitoring began in 2007. PET is the amount of moisture that would be
lost by evaporation and transpiration from a reference crop, such as grassland,
if sufficient moisture is available.
10. Both
December and January had below normal rainfall and temperatures between 0.5 -1°C warmer than average. The dry
conditions that developed during late spring and into summer rapidly worsened
in February when all, but northern areas of the region received approximately
10% of normal February rainfall. Temperatures were again very hot and
reached 3°C above the
February average, resulting in high but not record rates of PET.
11. March
brought some welcome rain to northern Hawke’s Bay and to the south coast.
However the remainder of the region received less than half the March average
and even the rain on the south coast didn’t bring its total into the
month’s normal range. The region received only 30% of average April
rainfall and the areas worst affected were the Heretaunga Plains (13%), Tangoio
(14%), southern Hawke’s Bay (15%) and the Ruataniwha Plains (23%).
12. Table 1
shows the percentage of average rainfall received in different parts of the
region from November to April inclusive and compares it to 2012-13. Most
of the region shared similar or more severe levels of below normal rainfall in
2019-20 than in
2012-13 except for the Kaweka Range and Waikaremoana.
|
Area
|
2012-13
% Average Nov-Apr Rainfall
|
2019-20
% Average Nov-Apr Rainfall
|
|
Waikaremoana
|
52
|
64
|
|
Northern
Hawke’s Bay
|
56
|
54
|
|
Tangoio
|
47
|
41
|
|
Kaweka
|
48
|
52
|
|
Ruahine
|
59
|
45
|
|
Heretaunga
Plains
|
42
|
36
|
|
Ruataniwha
Plains
|
46
|
36
|
|
Southern
Hawke’s Bay
|
51
|
44
|
|
Hawke’s
Bay Region
|
50
|
47
|
Table 1: November to April rainfall totals for 2012-13 and
2019-20 for different parts of Hawke’s Bay as a percentage of average
November to April rainfall totals. Areas where the dry conditions appear worse
in 2019-20 than in 2012-13 are highlighted in red.
13. The
November to February rainfall totals in the Ruahine Range and Ongaonga were the
lowest recorded in the past 50-60 years, surpassing those of 1997-98 and
2012-13.
14. Much of
Hawke’s Bay is considered “summer dry”, i.e. PET exceeds the
amount of rainfall typically received. The difference between rainfall and PET
can be used to gauge the magnitude of dry conditions. Figure 1 shows cumulative
rainfall minus cumulative PET for the hydrological year (July to June) at the
Ongaonga Climate site and includes average conditions as well as the 2019-20
and 2012-13 levels. The graph indicates a greater moisture deficit than
average for most of the period and greater than that of 2012-13. This is not
the case at Bridge Pa on the Heretaunga Plains (Figure 2), where early spring
rainfall raised 2019-20 above both average levels and those of
2012-13, before dipping below average in February.
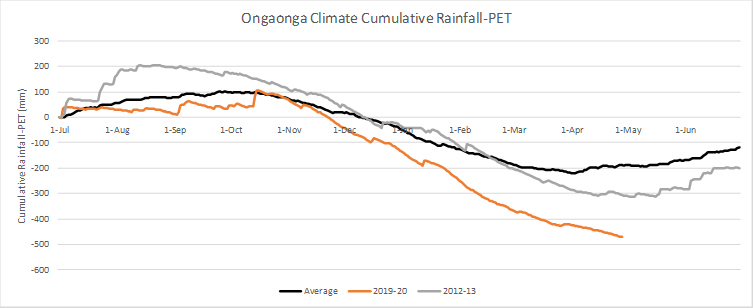 Figure 1: A comparison of average, 2012-13 and 2019-20 levels
of cumulative rainfall – PET at Ongaonga Climate station over the
hydrological year. Data for 2019-20 is shown up until 30th
April 2020.
Figure 1: A comparison of average, 2012-13 and 2019-20 levels
of cumulative rainfall – PET at Ongaonga Climate station over the
hydrological year. Data for 2019-20 is shown up until 30th
April 2020.
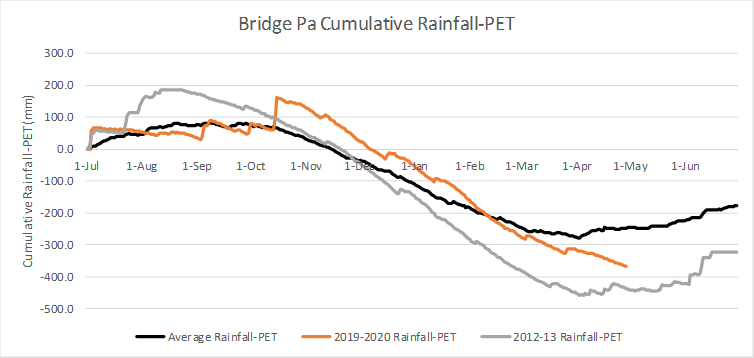 Figure 2: A comparison of average, 2012-13 and
2019-20 levels of cumulative rainfall – PET at Bridge Pa Climate station
over the hydrological year. Data for 2019-20 is shown up until 30 April
2020.
Figure 2: A comparison of average, 2012-13 and
2019-20 levels of cumulative rainfall – PET at Bridge Pa Climate station
over the hydrological year. Data for 2019-20 is shown up until 30 April
2020.
Soil moisture
15. The lack
of rainfall and high rates of PET from November to April resulted in soil
moisture levels tracking below normal, apart from northern areas where soil
moisture followed median levels. For many areas, such as around and south
of the Heretaunga Plains and also to the north up to Taharua, soil moisture
levels were typically in the lowest 10% of readings at individual sites. Levels
were comparable to 2012-13 for much of summer, especially on the Ruataniwha
Plains where the onset of dry conditions mirrored that of 2012-13 (Figure 3).
Elsewhere the onset tended to be delayed by a month by the early spring rain.
However by the end of April, soil moisture levels were below 2012-13 and the lowest
in the 15-20 year records of the Ongaonga, Bridge Pa and Crownthorpe sites.
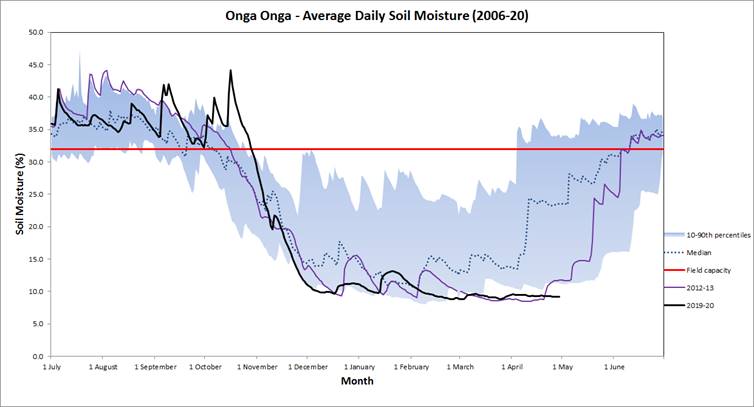
Figure
3: Soil moisture levels at
Ongaonga Climate Station for 2019-20 compared to median levels and
2012-13. Data for 2019-20 is shown up until 30th April.
River Flows
16. With
below normal rainfall in November, river flows began dropping across the Hawkes
Bay. The dry, hot summer resulted in average river flows below 25% of their
long-term average, particularly in the southern Hawke’s Bay. In
comparison, 2018-19 was within 75% of the long-term average river flow.
17. In the Northern
Hawke’s Bay, river flows have been below 50% of their long-term
average. However, river levels have remained above those seen in the dry
season of 2012-13. Hangaroa River dropped throughout the summer months, but has
seen a rise in its average level in March due to rain in northern Hawke’s
Bay during this period. The Esk River has steadily dropped below
the normal range through the summer months, reflecting similar river levels to
2012-13. River levels from February to March saw very little change.
18. The Ngaruroro
River dropped below the normal flow range from December onwards, declining
significantly through the summer months. February average river levels were the
lowest for the month on record (1980-2020). Current data for March shows river
levels have remained steady with no further decreases.
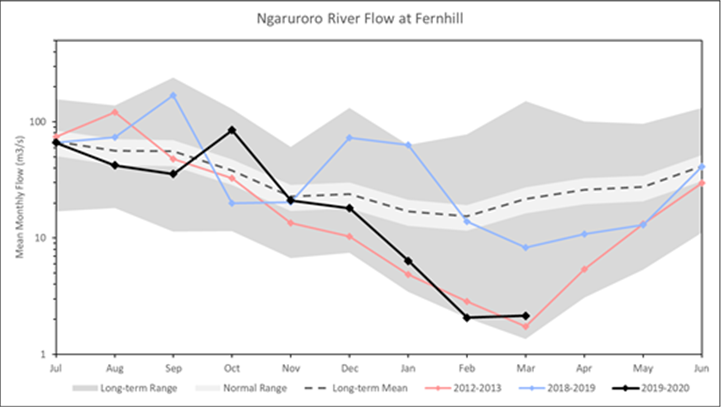
Figure 4: River flow levels at Ngaruroro – Fernhill for
2019-20 compared to river levels of 2018-19 and 2012-13. Data for 2019-20 is
analysed up until late March.
19. Central
Hawke’s Bay river levels have been below 25%
of the long-term average from November onwards. The Tukituki River
dropped to below normal in November to similar drought levels of
2012-2013. River levels continued to drop in the following months with
December-March mean flows the lowest on record. However, flow recession has
levelled off in March, with the dry season coming to an end.
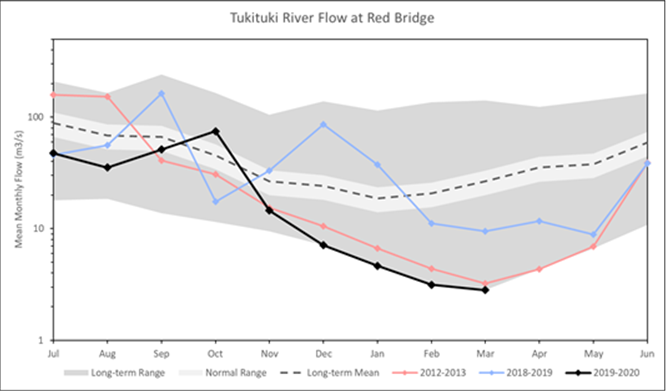
Figure 5: River flow levels at Tukituki – Red
Bridge for 2019-20 compared to river levels of 2018-19 and 2012-13. Data for
2019-20 is analysed up until late March.
20. Despite
the lower average river flows recorded for 2019-20, compared to 2012-13, the
7-day mean minimum flows recorded are comparable with those recorded in 2012-13
(Table 2). Minimum flows of the Ngaruroro and Tukituki have been similar
to those recorded in the 2012-13 drought period and are considerably lower than
the 2018-19 minimum flow records.
|
River
|
2012-13 Minimum River Flow (l/s)
|
2018-19 Minimum River Flow (l/s)
|
2019-20 Minimum River Flow (l/s)
|
|
Northern Hawkes Bay
– Hangaroa River
|
284
|
866
|
594
|
|
Esk Central Coast
– Esk River
|
1669
|
2918
|
1816
|
|
Heretaunga Plains
– Ngaruroro River
|
1330
|
7089
|
1514
|
|
Central Hawkes Bay
– Tukituki River
|
2888
|
7003
|
2774
|
Table 2: Minimum river flows (7-day mean, L/s) so far this
year at key sites across the Hawke’s Bay region for the hydrologic years;
2012-13, 2018-19, and 2019-20.
Groundwater
21. Groundwater
levels began their normal seasonal decline in late October and early November
2019. Early spring rainfall, coupled with increased river flows, provided much
needed recharge to the Heretaunga and Ruataniwha Plains aquifer systems. This
caused groundwater levels to measure near normal for November and December. Since
December, below normal conditions became increasingly more prevalent in
addition to an increasing number of wells measuring lowest ever monthly
measurements.
22. Groundwater
level conditions for March measured below normal with only 5 wells out of 50,
measuring normal or above for the Heretaunga and Ruataniwha Plains (see pie
chart below).
23. On the
Ruataniwha Plains, over 60% of wells measured their lowest-ever levels for
March. Here, the less transmissive aquifers, with lower storage
properties, experience deeper drawdown impacts and slower recovery in response
to water use. In contrast, on the Heretaunga Plains, aquifers are highly
transmissive with strong surface-water connections resulting in shallow and
widespread drawdown impacts despite an overall greater volume of pumping than
in the Ruataniwha.
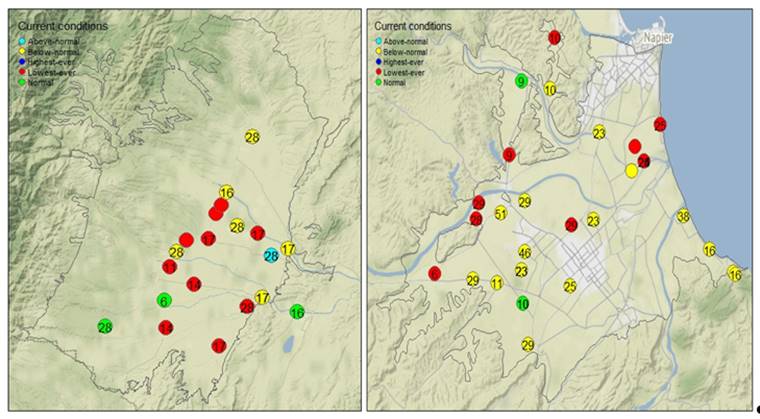
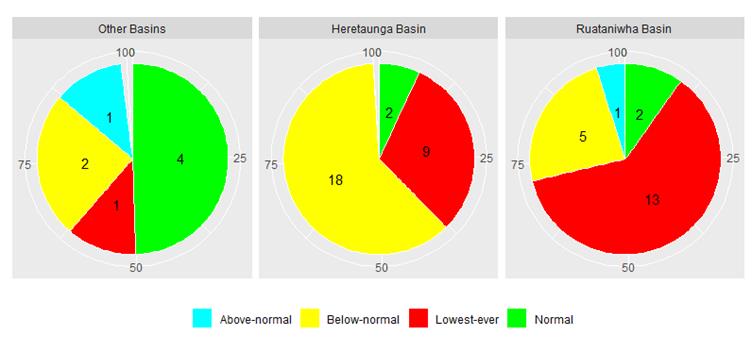
Figure
6: Groundwater level
conditions for March in the Heretaunga and Ruataniwha Plains. Note: Numbers
within the maps represent years of monitoring. Sites less than 5 years are
excluded from the analysis.
24. In
Ongaonga, groundwater levels are at their lowest-recorded (monitoring started
2004) and measured 42cm lower than the previous annual minimum measured in
January 2017. Telemetered data from our new multi-level wells for the Ongaonga
and Tikokino indicates groundwater levels in the shallow system are still
declining. In the deeper bores, there are indications groundwater levels maybe
beginning their normal seasonal rise back toward winter levels. On the
Heretaunga Plains, telemetered groundwater levels indicate groundwater levels
are beginning to recover.
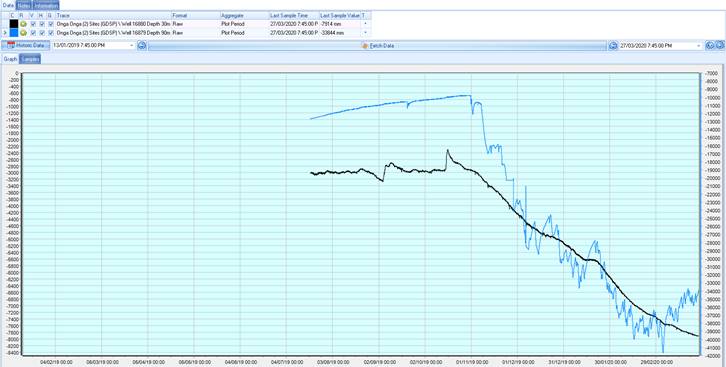
Figure
7: Telemetry from the Ongaonga
wells. Black line represent the shallow well (30m) and the blue line represents
the deeper system (90m).
25. The
conditions experienced this summer have been, for many wells, the most extreme
on record. This means that at many wells’ (but not all) groundwater
levels are lower than the water levels measured in 2012-2013. The plot below
shows that a larger proportion of wells experienced the lowest recorded water
levels in 2020, and represents about 20% of the number of our monitoring
network.
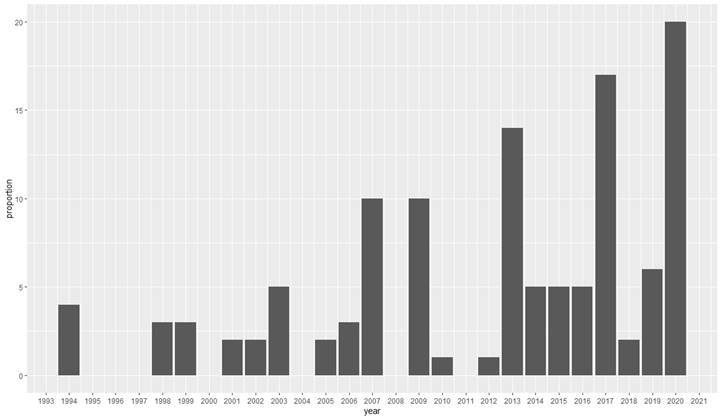
Figure
8: The number of wells
experiencing the lowest water levels recorded, expressed as a percent of the
total number of wells monitored that year.
Weather pattern
26. The El Niño-Southern Oscillation (ENSO) is a
broad-scale climate mode known to influence Hawke’s Bay’s weather1.
The El Niño and La Niña phases are typically associated
with higher and lower risk respectively of a dry Hawke’s Bay
summer. Neither of these phases were in place for recent droughts and
instead neutral ENSO conditions existed for both the 2012-13 and 2019-20
droughts.
27. Another
climate mode that can play a role in the region’s spring weather is the
Indian Ocean Dipole (IOD). Positive IOD events increase the probability
of a drier than normal Hawke’s Bay spring2. The IOD was
strongly positive during spring 2019 and although the season had a very wet
start, the event may have contributed to the onset of dry conditions in late
spring and into summer.
28. The Southern
Annular Mode (SAM) is another climate driver of New Zealand’s
weather. The SAM index refers to the north-south movement of the mid to
high latitude westerly wind belt of the southern hemisphere. During a
negative SAM the belt shifts north and westerlies increase over New Zealand
while lighter winds and anticyclones are expected in the positive mode. Average
monthly values of SAM were mostly negative during late spring and most of
summer.
29. Dominant
weather features during the dry conditions included the presence of higher than
average mean sea level pressure (MSLP) in a zone extending northwest of New
Zealand and to the east (Figure 9). Ridging was also evident in the upper
atmosphere indicating a depth of warm, stable air. Lower than average MSLP
occurred to the southwest of the country and over the lower South Island.
Sea surface temperatures were above average around New Zealand and
significantly higher than normal in an area to the east of New Zealand (Figure
10).
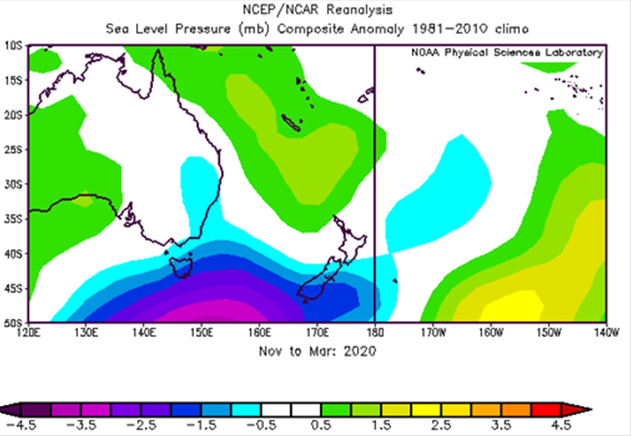
Figure
9: Mean sea level pressure
anomalies (mb) for November to March 2019-20 inclusive (NCEP/NCAR Reanalysis
using the1981-2010 climatology).
Figure
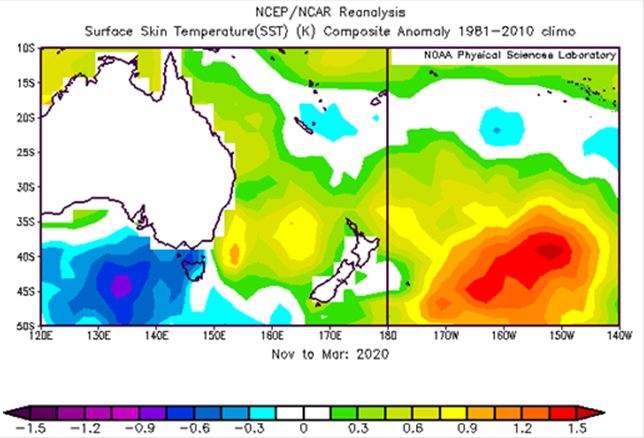
10: Sea surface temperature
anomalies (degrees Kelvin) for November to March 2019-20 inclusive (NCEP/NCAR
Reanalysis using the1981-2010 climatology).
30. The
anticyclones and an upper level ridge, extending from east of New Zealand to
the northwest, meant active fronts struggled to make progress over the North
Island as they moved onto the country from the low pressure systems to the
southwest. More often than not, the fronts weakened considerably as they
moved north and delivered very little rain to Hawke’s Bay and many parts
of the North Island.
31. The sea
level pressure pattern and predominantly negative SAM lead to a westerly wind
anomaly over Hawke’s Bay (Figure 11). Tropical cyclones tended to
track east of New Zealand or down the western Tasman Sea as they moved
southward. The warm sea surface temperatures around and to the east of
New Zealand contributed to the warm summer temperatures that were
experienced. All of these factors produced a scenario of low rainfall and
high rates of PET that particularly affected southwestern areas of the region.
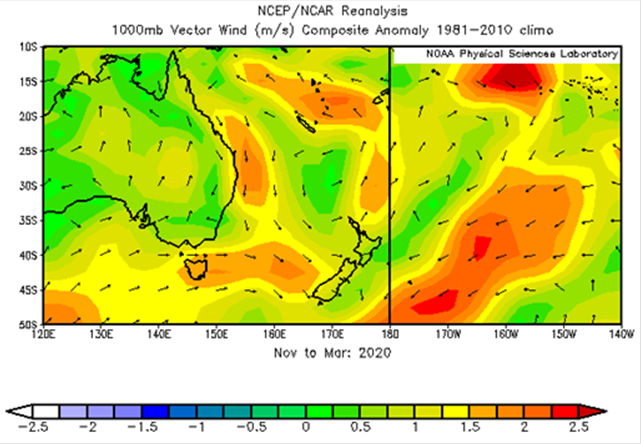
Figure
11: Vector wind anomaly (m/s)
for November to March 2019-20 inclusive (NCEP/NCAR Reanalysis using
the1981-2010 climatology).
32. The
pattern of weather observed in 2019-20 was different to that in 2012-13. In
2012 /13, higher than normal pressure extended across all of New Zealand
and the Tasman Sea (Figure 12). Sea temperatures around the North Island were
cooler than in 2019-20 (Figure 13). The dominance of anticyclones brought a
prevalence of fine days to much of the country and the cooler sea temperatures
reduced the moisture holding capacity of weather systems.
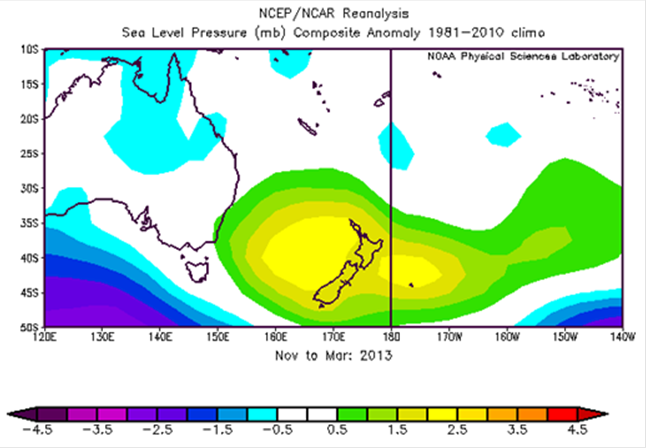
Figure
12: Mean sea level pressure
anomalies (mb) for November to March 2012-13 inclusive (NCEP/NCAR Reanalysis
using the1981-2010 climatology).
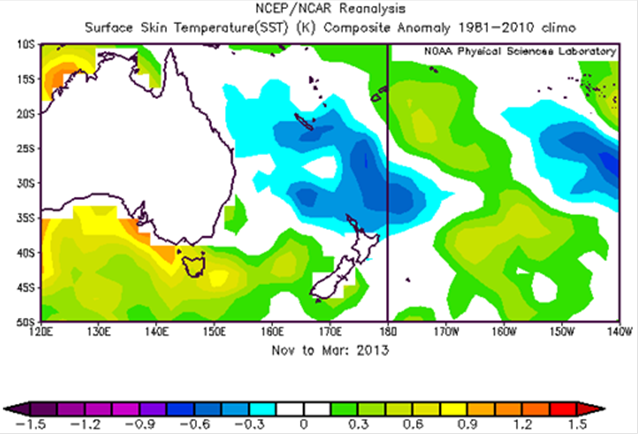
Figure
13: Sea surface temperature
anomalies (degrees Kelvin) for November to March 2012-13 inclusive (NCEP/NCAR
Reanalysis using the1981-2010 climatology).
Outlook
33. ENSO
neutral conditions are expected to persist through autumn and winter and
possibly into spring. The tropical cyclone season closed at the end of April
but it doesn’t preclude tropical lows or depressions influencing our
weather in the months ahead.
34. The dry
conditions since late spring stemmed from lower than normal pressure over
southern New Zealand and higher pressures to the northwest and east, which
resulted in a predominantly westerly flow. Seasonal forecast models persist
with this pattern over the next few months, with normal or below normal
rainfall expected.
35. The most
recent NZ Drought Index map from NIWA is shown in Figure 14. While the drought
in parts of Hawke’s Bay might not have been as intense as in northern
regions, the event has persisted longer. This means that drought-breaking rain
is now unlikely to bring immediate relief to primary production because winter
is nearly upon us and pasture growth will be limited by colder temperatures and
short daylight hours.
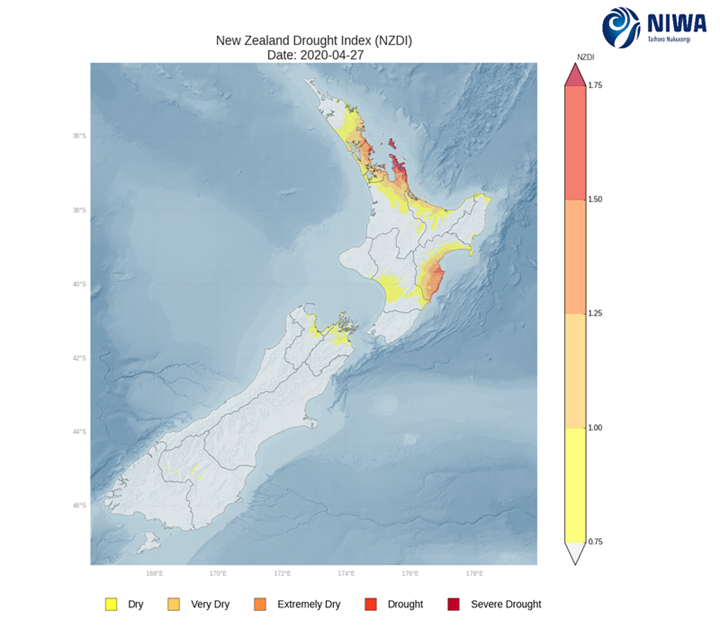
Figure
14: NZ Drought Index map from
27 April 2020. The Drought Index combines rainfall, evaporation and soil
moisture indices into one map.
1Porteous, A. and Mullan, B., 2013. The 2012-13 drought: an assessment
and historical perspective. NIWA Client Report No. WLG2013-27.
2Fedaeff, N. and Fauchereau, N. 2015. Relationship between Climate
Modes and Hawke’s Bay Seasonal Rainfall and Temperature. NIWA
Client Report No. AKL2015-016.
Next
Steps
36. An update
is expected to be provided if this paper is presented to the Māori Committee, to provide more recent
information if the situation has changed since this report was finalised.
Decision Making Process
37. Staff have assessed the
requirements of the Local Government Act 2002 in relation to this item and have
concluded that, as this report is for information only, the decision making
provisions do not apply.
|
Recommendation
That the Māori Committee receives the “Hawke’s Bay Summer
2019-20” report.
|
Authored by:
|
Simon Harper
Senior Scientist
|
Dr Kathleen
Kozyniak
Principal Scientist (Air)
|
|
Dr Jeff Smith
Manager ScienCE
|
|
Approved by:
|
Iain Maxwell
Group Manager Integrated Catchment
Management
|
Tom Skerman
Group Manager
Strategic Planning
|
Attachment/s
There are no
attachments for this report.
HAWKE’S BAY REGIONAL
COUNCIL
Māori
Committee
Wednesday 06 May 2020
Subject: Climate Change Working
Group Update
Reason for Report
1. Reason for this report is to provide a brief report back on
preliminary discussions amongst the climate change working group.
Executive Summary
2. The Working Group has met on one occasion to date (16 March).
Discussions traversed a range of matters. There are two key dimensions to
the work – adaptation to, and mitigation of, climate change.
Both are essential. There are also two key focus areas:
2.1. Hawke’s Bay Regional Council as an organisation; and
2.2. Hawke’s Bay as a region.
3. The working group has prioritised several matters that warrant
progress sooner rather than later, bearing in mind the modest budgets currently
available for work in the 2020-2021 financial year. But importantly,
these matters were prioritised before the COVID-19 lockdown period.
4. Due to staffing commitments to the COVID-19 and drought response
effort, the pace of progress on this project has slowed considerably since the
working group’s initial meeting.
Background
5. At its meeting on 5 February 2020, the Committee had agreed to form
an interim climate change working group. The working group is to assist
staff in shaping a regionally coordinated programme for responding to climate
change. Councillors Rick Barker, Hinewai Ormsby and Martin Williams are
group members. The Māori Committee had nominated Michelle McIllroy and Dr Roger Maaka to
join the group. After the working group’s first meeting,
tāngata whenua members of the Regional Planning Committee nominated Apiata
Tapine to also join the group.
6. The working group met with key HBRC staff on Monday, 16 March for a
semi-structured discussion on relative priorities and other suggestions arising
from the Committee’s discussions in February.
Discussion
7. The working group’s preliminary discussions focused on two
areas:
7.1. HBRC as an organisation undertaking corporate business activities
and activities relating to mitigation of, and adaptation to, climate change
7.2. Hawke’s Bay as a region, with wide ranging community interests
and capabilities to take action responding to climate change.
HBRC as an organisation
8. As an organisation, HBRC must lead by good example and continue to
drive reductions in its own direct emissions, energy consumption, and waste
etc.
9. Further to that, we should begin with a ‘stocktake’ of
existing and planned actions as to both adaptation and mitigation.
Earlier staff briefing papers to this Committee have documented several
iterations of the actions HBRC has underway or planned that directly and
indirectly relate to climate change.
10. From
there, evaluate ’gaps’ in HBRC’s actions compared to other
regions. This can help build a more complete picture of potential
initiatives and their relative cost-effectiveness. The stocktake and gap
assessment can be completed by staff.
11. In
parallel to that work, we would complete a fulsome assessment of HBRC’s
own carbon footprint. That would provide us with better understanding of
HBRC’s current baseline and to target further ongoing improvements in its
own corporate operations such as energy use, waste reduction, travel and
procurement policies. A comprehensive carbon footprint assessment requires
specialist external consultants.
12. While we
may aspire to do lots of things with many other agencies and groups, limited
budgets for remainder of 2019-20 and 2020-21 financial years pose tight fiscal
constraints. Nevertheless, we will look for opportunities with partner agencies
to leverage co-resourcing of some initiatives where relevant.
13. The
2021-31 LTP presents an opportunity to further boost priority and associated
resourcing of a regionally coordinated programme of climate change response
actions. In the meantime, our focus ought to be on developing community
awareness and changing behaviours through various media, publicity and
communication-related initiatives.
Hawke’s Bay as a region
14. At a
regional level, we need to understand our region’s current carbon
emissions profile if we are serious about a time bound net carbon zero
target. A regional inventory of the emissions profile will paint a
‘snapshot’ picture of where we are today, so we’re better
informed of pathways to our region becoming carbon neutral in a few
decades. This is key to understanding the policy priorities and settings
for any interventions and support. Based on similar inventories done by
other regions, this work can be done by specialist consultants (estimates are
around $50,000).
15. Commissioning
a climate change community perceptions survey (phone/mail/digital) will also
provide insights beyond what was the 2019 HBRC Residents Perception Survey.
16. HBRC
alone cannot ‘fix’ climate change or make our region
carbon-neutral. HBRC must lead work with others to strengthen local
community messages about efforts to mitigate human-induced effects of climate
change. There are already a variety of agencies, organisations and
businesses doing really valuable work showing what can be done. To this
end, a number of suggestions were made during the working group’s meeting
about communications and messaging for community engagement so HBRC does not
duplicate others’ work.
Preliminary Priorities
17. The
following are three of the ‘big ticket item’ priorities for 2020
arising from the working group’s initial discussion. These are
being presented to the Committee for information update purposes at this time.
17.1. Build a
‘stocktake’ of existing and planned actions as to both adaptation
and mitigation, then a ’gaps’ assessment of those actions compared
to other regions
17.2. Undertake
a regional inventory of greenhouse gas emissions in Hawke’s Bay[1]
as a present day ‘snapshot,’ yet repeatable at regular intervals in
future years
17.3. Undertake
a community survey of HB residents’ climate change perceptions etc.
18. The three
big-ticket priorities for 2020 above can be readily augmented by a variety of
smaller-scale initiatives which can be progressed within existing staff
capacity. Some examples of these include:
18.1. refreshing
webpage content
18.2. developing
a collection of short videos profiling examples of what individuals can do
themselves to reduce their own carbon footprints
18.3. developing
closer ties with other councils in the region to better align climate
change-related actions and activities
18.4. further
reducing energy use and waste disposal across HBRC’s buildings and
facilities.
COVID-19 and next steps
19. COVID-19
poses some challenges for immediate term and an indefinite time period.
For example, limits on public gatherings, meetings, workshops, conferences etc.
20. COVID-19
is disrupting many of the day-to-day activities of businesses and people.
Commissioning new research work, developing digital tools, media packs or
making general contact with people is no longer simply as it used to be.
21. COVID-19
also presents some opportunities for lessons and behaviours to transfer across
to climate change response, e.g. increased use of virtual meetings in lieu of
travel for in-person meetings. This may also be a good time to develop
the stocktake, inventory and preliminary thinking on the future policy options
ahead of 2021-31 LTP preparation. However, many of the project’s
key staff are likely to continue assisting with the CDEM Group’s response
to the COVID19 and drought. That ongoing involvement will certainly
influence the pace and degree of progress that key staff can make on this
project over at least the April/May period.
Decision Making
Process
22. Staff have assessed the
requirements of the Local Government Act 2002 in relation to this item and have
concluded that, as this report is for information only, the decision making
provisions do not apply.
|
Recommendation
That the Māori Committee receives the “Climate Change Working Group
Update” report.
|
Authored by:
|
Gavin Ide
Principal Advisor
Strategic Planning
|
|
Approved by:
|
Tom Skerman
Group Manager
Strategic Planning
|
|
Attachment/s
There are no
attachments for this report.
HAWKE’S BAY REGIONAL
COUNCIL
Māori
Committee
Wednesday 06 May 2020
Subject: FRESHWater SECURITY
Update
Reason for Report
1. This item
provides Committee members with an update on the Regional Freshwater Security
programme with a specific focus on the aligned work streams addressing medium
term supply certainty for all water users in the Heretaunga and Central
Hawke’s Bay districts.
2. The paper then
provides context for a presentation by Dr Bob Bower on a proposed groundwater
replenishment pilot study in Central Hawke’s Bay which forms a part of
the programme.
Introduction and Executive Summary
3. Regional
freshwater supply security is one of Council’s core responsibilities,
particularly in the context of climate change. Such is the importance of
freshwater to the environment, iwi, the broader community and the economy,
certainty of freshwater supply arguably represents HBRC’s most important
area of impact on the long term wellbeing of the community.
4. The Regional
Freshwater Security programme is a discrete work stream which forms a subset of
Council’s wider freshwater responsibilities and work streams, including
freshwater quality initiatives that bridge both instream and land-based
activities, allocation and enforcement regimes, continuous improvement in the
region’s regulatory framework (e.g. implementing the NPSFM), and the
establishment and execution of key non-regulatory interventions that will
deliver multi-value outcomes (e.g. the Erosion Control Scheme). In total, the
focus on freshwater occupies a significant proportion of HBRC’s overall
resourcing and activity.
5. The programme
is capital funded with $5m through the current Long Term Plan and guided by the
Freshwater Security Scheme Policy approved by Council in March 2019.
Council has also secured approx. $4.7m co-funding from the Provincial
Growth Fund to support and accelerate the delivery of the programme’s
objectives:
5.1. the
completion and delivery of the Regional Water Assessment
5.2. the
conclusion of full feasibility on an option(s)/solution(s) for a Heretaunga
flow maintenance scheme
5.3. the
conclusion of full feasibility on an option(s)/solution(s) for improving
Central Hawke’s Bay freshwater supply security.
6. Staff are
continuing to initiate a multitude of work streams across these three projects.
While the Regional Water Assessment is more straightforward, the physical and
social complexity of the Heretaunga and Tukituki projects commands the
requirement for a clear and transparent decision pathway for governors in order
to ensure wider community trust and confidence in these critical
projects. Accordingly, the work under commission is focussed on scoping
(problem definition, issues assessment and options analysis) so that governors
can make decisions whether and how to proceed to pre-feasibility as soon as
possible.
Regional Freshwater Security Programme – Why?
7. In 2010 Stephen
Solomon, author of “Water – The epic struggle for wealth, power and
civilization” wrote:
“Every
era has been shaped by its response to the great water challenge of its time.
And so it is unfolding – on an epic scale – today.”
8. Climate change
will impact our freshwater systems in many ways and a transition to more
extreme drought-flooding hydrological patterns could have profound consequences
for freshwater ecosystems, and severe social and economic impacts. The
effects of higher temperatures, declining precipitation and more frequent
extremes will have implications not only for land and water management, but
also community resilience and well-being (see also paragraphs 45 – 48).
9. That HBRC
carries the highest level of responsibility for meeting this challenge in this
region is reflected in the significance of its resourcing dedicated to
improving freshwater quality and quantity, which is in turn driven by its
statutory obligations under legislation, national direction and regulation.
A qualitative analysis of the Strategic Plan demonstrates that over 50% of the
organisations 23 Strategic Goals are directly linked to freshwater
objectives. A similar exercise for the Long Term Plan identifies
approximately 35% of HBRC’s 48 core function Level of Service Measures as
contributing to and resourcing improved freshwater outcomes.
10. This effort represents a
core public-good function of this organisation and one which the ratepayers of
this region rightly expect local government to provide. Measuring the
objective impact of Council’s provisions of public goods is difficult and
in this instance presents the challenge of quantifying the value of loss
avoidance as opposed to value of wealth creation. Whereas economic
development traditionally focusses on economic growth in absolute terms,
ensuring that the region’s freshwater supply provides for both the
environment’s needs and the broader community’s will ensure the
region avoids both the costs and opportunity costs of mismanagement of our
freshwater resource.
11. The impacts of failing to
avoid a water-scarce future should not be underestimated. The summer of
2019-20 has witnessed multiple local and regional authorities having to grapple
with acute and unexpected water deficits. Independent economic analysis
completed for the TANK plan change demonstrated that the impacts of even
relatively modest alterations to the reliability of water takes from the
Ngaruroro River translated to negative GDP impacts in approaching $100m per
annum. Furthermore is was found through social and cultural
assessment that poorer communities were likely to disproportionality bear the
impact of lower water security. In this regard, sensible and sustainable
management of our freshwater supply delivers long term benefits in an order of
magnitude over and above other economic development and growth
initiatives. A key part of the “Why” of this work will be
captured in supporting analysis that will be provided to decision makers that
will assess the economic and social impacts of inaction, or the ‘do
nothing’ scenario.
12. The potential impacts of
lower water security are increasingly coming into focus at a time when the
demands for water security are only escalating. The 2018 census revealed
that Hawke’s population increased at the rate of 10% over 5 years, the
highest rate of increase in the lower North Island. This growth likely
reflects the buoyant economic growth the region is experiencing with
Hawke’s Bay annual GDP growth last year outstripping the national
average. These statistics reflect the activity within the region
including residential and commercial property growth, horticultural expansion
on both the Heretaunga and Ruataniwha plains and the significant transport
infrastructure investments completed in recent years to manage the movement of
people and goods. The Port of Napier’s capital requirements for
Wharf 6 were a driver behind its successful listing by this Council.
13. The main focus of the
Tukituki and Heretaunga projects is the investigation of water storage to carry
winter water surpluses through to periods of summer deficit. However,
regional freshwater security will not be achieved through storage alone.
Our freshwater plan changes will continue to attempt to make more water
available for the environment and communities through tighter allocation
regimes as well as requirements for conservation and efficient use by all water
users. Accordingly, this programme of work should be viewed as one of a
matrix of interventions by HBRC to deliver a more certain freshwater future.
14. Therefore it is important
to be transparent about the ideological driver behind this body of work.
Climate change will inevitable intensify the competing tensions associated with
freshwater use and allocation. Water storage is seen by many as a
maladaptation that only sustains unsustainable water use (particularly
associated with agriculture and horticulture) in areas already experiencing
environmental stress and now threatened by lower rainfall, drought and other
climate disruption. A February 2020 report supported by MPI’s
Sustainable Land Management and Climate Change Fund observes how “debates
over irrigation highlight the deeply held social, cultural and environmental
values held by many New Zealanders about their natural environment, privileged
groups and the delays in addressing the lock in of unsustainable
intensification pathways, leading to overuse and compounding nutrient run-off,
leaching and degradation of water quality.”
15. With these factors in
mind, this programme of work may be criticized for a lack of ambition by some
who believe that our focus should be on larger scale storage solutions that
solve for the environment, for growth and for future-proofing our communities
all at once. The primary, but not sole, focus of this programme is to
identify solutions, in the Central Hawke’s Bay and Heretaunga catchments,
that seek to offset the collective environmental impact of our current use of
water, and to recover the cost of this offset from water users as the price to
pay for continuing to access existing reliability of supply (or reliability
standards set down in a regional plan change). Apart from relatively
small “growth” water opportunities (see Maori development below),
the first objective is to find water for the purpose of environmental flows
other than by way of radical and disrupting reductions in exiting water
allocations. That is not to say that through the options analysis
pathways ahead decision makers will not have opportunities to consider or direct
a focus on storage options that can deliver on both environmental and growth
objective (and in this regard it is further worth noting that in the Heretaunga
Catchment the need to future-proof municipal and industrial water security will
be equally as important as the issue of irrigation water security).
16. Policies guiding the
funding of this programme (see next section) overtly refer to the requirement
for Māori social and economic wellbeing to be addressed through the
delivery of the programme. The proposals are consistent with the
Crown’s and Local Government’s treaty partner obligations and that
the programme provides concise, prioritised and specific opportunities to
participate and benefit from individual projects. Identifying and
developing solutions for undeveloped Māori owned land, or creating a
pathway to take advantage of the TANK proposal to set aside an iwi-allocation
of high-flow water on the Ngaruroro River are two such examples of
opportunities that might be advanced through these projects, over and above the
environmental objectives that will be on interest to tangata whenua and the
wider community (see also paragraphs 49 – 51).
Regional Freshwater Security
Programme – What?
17. The 2018-28 LTP proposed
the establishment of a $5m fund to be available for water augmentation, not
fixed to any particular programme but available for technical investigation and
feasibility.
18. In late 2018 a guidance
policy in respect of this funding was developed and the Freshwater Security
Scheme Policy (Attach) was adopted by Council in March 2019. The policy
states:
“Through experience and
engagement, the Regional Council understands the region is demanding an
integrated and holistic set of freshwater solutions. The Programme is part of a
multi-layered approach to identifying and supporting the development of water
management solutions that maximise the benefits of water available for users
today, without compromising current and future ecosystem health or the ability
of people to meet their needs in the future. Two concurrent work streams will
set an evidence-based platform for community engagement and investigate
opportunities for water security and reliability through conservation,
efficiency or storage.”
19. The policy proposed the
$5m be allocated between a technical investigation of the entire region’s
long term freshwater supply and demand balance and a ‘ready reaction
fund’ to enable targeted investment for further investigation into and
support for specific initiatives. It was intended that the ready reaction fund
be used where the Council has completed issues and objectives assessments with
the community, such as the Tukituki and TANK catchments. These projects
are described in greater detail in the next section.
20. Concurrently with the
development of the Freshwater Security Scheme Policy the coalition government
launched the Provincial Growth Fund, including a specific funding pool
allocated to support water storage. The objectives of PGF
investment are to:
20.1. strengthen regional
economies by shifting to higher value sustainable land uses
20.2. address disparities in
Māori access to water for land development
20.3. support micro to
medium-scale water storage projects that strengthen regional partnerships and
provide wider public benefits
20.4. support land use that
does not increase - and ideally reverses – negative impacts on water
quality, and maintains and improves the health of waterways.
21. In meeting these
objectives, PGF investment will also consider how investment can:
21.1. contribute to a
transition to a low emissions economy and/or
21.2. contribute to building
community resilience to climate change
21.3. provide an incentive to
change land use that risks degrading the environment to high value more
sustainable uses.
22. In early 2019 staff made a
suite of applications to the PGF with a view to leveraging HBRC’s
Freshwater Security Scheme funding. The specifics of the PGF applications
mostly mirrored what was originally proposed under the Freshwater Security
Programme projects but with allowances for better alignment with the
PGF’s objectives.
23. Note that the 3D Aquifer
Mapping project which secured PGF funding as a part of the application package
is in fact a HBRC science project promoted and managed by the Integrated
Catchment Management group. HBRC’s co-funding share sits in ICM
budgets and is not sourced from the $5m sitting within the Freshwater Security
Programme.
24. The four projects
encapsulated under the Freshwater Security Programme are depicted in Diagram 1
including a breakdown of the primary funding sources and where this budget
resides within the Council.
Diagram 1 – Freshwater Security Programme
composition and funding sources
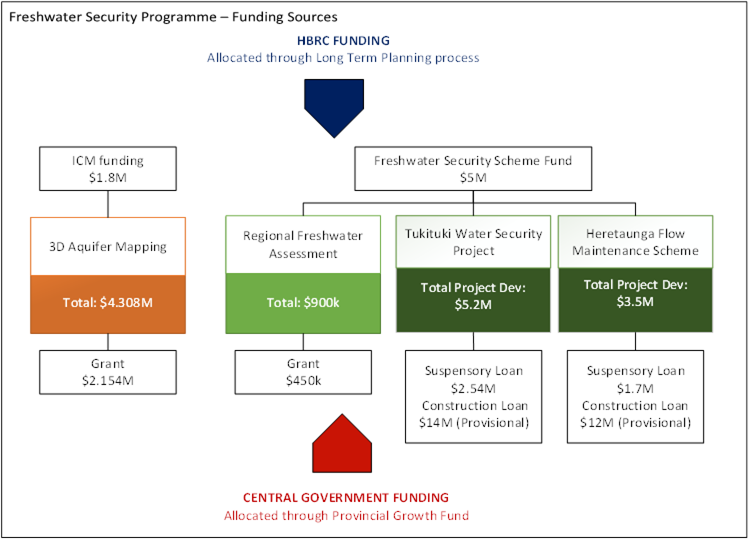
25. The 3D Aquifer Mapping
project uses the airborne electromagnetic technology developed by SkyTEM that
provides imagery of our sub surface to depths of approximately 300m. It
will provide a detailed coverage horizontally and to depths we haven’t
seen before. The data captured through this project will significantly
enhance our understanding of the region’s key aquifer systems in the
Heretaunga, Ruataniwha and Poukawa/Otane Basins and provide information
critical for effectively managing our freshwater resources in the future.
The aerial operation was recently completed within budget and ahead of
schedule. Now follows a two and half year comprehensive science work
programme to process, analyse, interpret the data and develop (or enhance)
select models.
26. The Regional Freshwater
Assessment will put in place the framework and tools to collectively shape and
generate pathways via a range of solutions for long term water use and
management (with a horizon of 30-50 years). In pursuing an assessment of
the region’s water resources, linkages and synergies to environmental
reporting and natural capital accounting practices are being employed to
enhance the ability of local authorities, iwi and other stakeholders to make
informed policy and investment decisions. This work is designed to
support the region in taking a long-term outlook to ensure that our natural
assets are valued, managed effectively and continue to balance the
region’s economic, social and cultural well-being.
27. The Central Hawke’s Bay Water Security project, centred
around the Ruataniwha plains, will
identify and assess viable option(s) or pathways to:
27.1. Mitigate the depletion
impacts (both ground and surface)
27.2. Recover the aquifer and
groundwater system improving the health of the waterways and
27.3. Provide reliable access
to a level of water necessary to secure a sustainable supply to the Tukituki
Catchment.
28. These solutions are
necessary to provide for growth water to provide viable options to the district
in transitioning to lower emission land use (such as horticulture or other
feasible alternatives) that demand increased water and certainty of supply.
29. The Heretaunga Flow
Maintenance Project’s origins lay in findings and recommendations of the
TANK collaborative group and ultimately the policy direction of the draft TANK
plan change. The Council, in conjunction with the TANK Community group,
explored options strongly focussed on mitigating the impact of groundwater
abstraction on the environment as well as maintaining acceptable standards of
water security to current consent holders. This project aims first and
foremost to mitigate the impacts of declining groundwater levels from
groundwater abstraction to:
29.1. Protect ground water
dependent ecosystems and improve the overall health of our waterways and
29.2. Provide existing consent
holders confidence of a secure and reliable water supply to sustain their
current level of investment.
30. Additionally the solution
aims to deliver “new” water to”:
30.1. Promote iwi well-being
through access to a new allocation of water available at times of high and
medium flow
30.2. Allow issuing of new
consents to support smart growth to continue to contribute to the
region’s economic future.
31. The Heretaunga and
Tukituki projects aim to develop and implement schemes that deliberately
targets both the avoidance of loss in the region’s economy (given the
inevitable negative economic consequences of reduced levels of water security -
particularly in relation to investment decisions and community confidence)
alongside the aim to unlock further potential and enable ‘new’
water to support smart growth.
Regional Freshwater Security Programme
– How?
32. The Regional Freshwater
Security Programme is planned to be delivered over the next 3.5 years. Whilst
projects will leverage resource and intelligence across the programme where
applicable they are managed as individual projects and run to their own
timelines. The Regional Water Assessment is due to be delivered within 12
months (Dec 20) and the 3D Aquifer Mapping project is scheduled to be completed
by March 2023 with the first of the products released in March 2021. Both the
3D Aquifer Mapping project and Regional Water Assessment project plans are
approved and in varying stages of design and delivery.
33. The Central Hawke’s
Bay and Heretaunga projects differ somewhat in that each phase of project
development is seeking to explore and assess viability to manage investment
risk. They will follow a standard and accepted infrastructure development
process and staged with clear and definitive decision points for Governors
approvals. The plans for each phase will be submitted for approval
following an assessment of ongoing viability and commitment.
34. The infrastructure process
that the Tukituki and Heretaunga projects will follow is depicted in diagram 2
and whilst they will ultimately run to different timelines the process and
decision points are consistent.
Diagram
2 – Infrastructure project development process
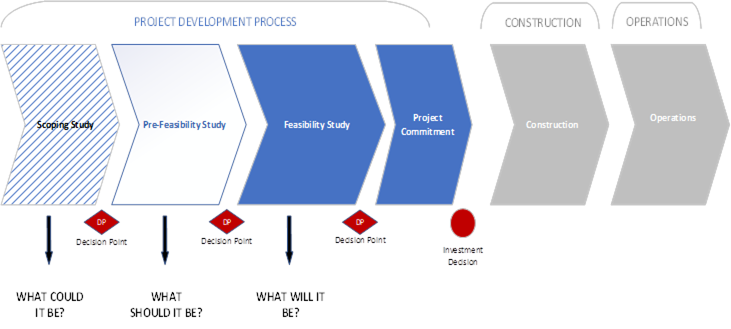
35. The Central Hawke’s
Bay Water Security Project scoping and options analysis phase will draw upon
previous studies completed and look to revise the outputs and assumptions based
on current objectives. We propose a two-part study running on
simultaneous but different tracks (and timelines) as storage options are
explored and a Managed Aquifer Recharge (MAR) field pilot is run. This is
an investigation to determine whether groundwater replenishment might form a
tool or option that supports freshwater security objectives. In this
respect we are looking to investigate MAR so as to ‘rule it in or rule it
out” as a long-term option in this catchment.
36. Exploring an optimal
groundwater scheme is dependent on a related HBRC project that is building a
Ruataniwha groundwater model (managed through HBRC’s science team).
Part one of the prefeasibility is planned to be completed by December 2020 and
Part two by June 2021.
37. Staff have met with CHBDC
who have expressed a strong desire for HBRC to step up momentum and engage
community stakeholders during the process to help support and shape solutions. The
Tukituki Leaders Forum, a group comprising key stakeholder representatives from
across the district, has been mandated by the CHB District Council for the
project to engage with to provide input and community intelligence. A
consulting group, Catalyze, who specialise in supporting organisations with
complex decisions and multi-stakeholder engagement was identified by the
District Council as a necessary resource to support that forum. This will
be similar to the role the consultancy Mitchell Daysh played in supporting the
development of the Coastal Hazards Strategy.
38. Subsequent discussions
with the Tukituki Leaders Forum secured that group’s approval to fulfil
the role of community reference group and to receive presentations from
Catalyze and Bob Bower from WGA (a hydrology consultancy) Dr Bower will discuss
MAR and the opportunity to conduct a field pilot as part of the prefeasibility
investigations. The project will subsequently be seeking a decision from
Council to approve a MAR field Pilot, estimated at approximately $1M, to be run
for 12 months commencing during the pre-feasibility stage. The pilot would test
whether MAR is a viable and effective tool that can work in tandem with water
storage to replenish groundwater within Ruataniwha area. Dr Bower has recently
presented to both HBRC and the Tukituki Leaders and the committee will receive
that presentation at the meeting.
39. The Heretaunga Flow
Maintenance project, as with the Tukituki project, will explore storage options
that deliver the environmental outcomes in the first instance with an option of
additional storage for “new” water. Similar to the Tukituki
project, this work will revisit expert analysis completed in 2011 that
identified medium-scale storage sites in the Ngaruroro catchments but this time
seeking to identify small scale sites that are ideally located to feed water
back into waterbodies affected by groundwater takes during periods of low
flows. This information will be presented to decision makers as soon as
it is available so that directions can be made in respect of a transition to
prefeasibility investigations on preferred options. The pre-feasibility
is planned to be completed by December 2020.
Programme
Governance
40. The 3D Aquifer Mapping
project and the Regional Water Assessment sit as HBRC work streams with
dedicated project management structures and operate according to normal
internal accountability and governance structures.
41. However, for the
substantially larger Tukituki and Heretaunga projects, the Provincial
Development Unit’s funding agreement directs HBRC to investigate a
broader governance model that is consistent and aligned with the regional
leadership’s support of the application. Specifically, the
agreement proposes that:
[HBRC] undertakes to comply with the
following additional undertakings:
In recognition of the representations
made by Hawke's Bay's regional leaders that water security was the agreed
priority they wished the Ministry to consider and support for Provincial Growth
Fund funding, [HBRC] undertakes that it will use reasonable endeavours, within
6 months from the date of this agreement to:
investigate and propose a model for
the ownership, structure and governance of the Project, being the
pre-construction phase of the Scheme, that is appropriate for Hawke's Bay and
consistent with the priority of and interests in water; and
if required, transfer this Agreement
and all other interests to an entity established under such a model;
subject to the Ministry's approval.
42. Council have affirmed that
staff are to engage with local government and treaty partners to progress the
Crown’s direction by writing to seek feedback from:
42.1. Ngahiwi Tomoana, Chair
of Ngāti Kahungunu Iwi Inc (NKII)
42.2. Liz Graham, Chair of
Heretaunga Tamatea Settlement Trust (PSGE)
42.3. Mike Paku, Chair of Te
Taiwhenua o Heretaunga
42.4. Dr Roger Maaka, Chair of
Te Taiwhenua o Tamatea
42.5. The Mayors of NCC, HDC
and CHBDC.
Climate Change Considerations
43. Climate change will impact
our freshwater systems in many ways and a transition to more extreme drought-flooding
hydrological patters could have profound consequences for freshwater
ecosystems, and severe social and economic impacts. The effects of higher
temperatures, declining precipitation and more frequent extremes will have
implications not only for land and water management, but also community
resilience and well-being.
44. It is safe to say that we
expect more extremes, which includes becoming more drought prone and more
severe rainfall events leading to flooding, and this impacts the reliability
and quality of the region’s water resources. We expect temperatures
to increase in our lakes, rivers and streams which will affect the freshwater
ecology.
45. A February 2020 report
supported by MPI’s Sustainable Land Management and Climate Change Fund
recorded that, under extreme climate scenarios, the Karamu catchment could
experience up to 60 additional ‘hot days’ per year, 10% less spring
rainfall and 10% more extreme rainfall and a 160mm increase in PED (potential
evapotranspiration deficit or drought proneness).
46. In general, rainfall is
projected to decrease across the region but there are seasonal
differences. Even under a moderate climate change scenario, decreases in
annual rainfall of up to 5% are projected for most of the region. The exceptions
are coastal areas where an increase in annual rainfall of up to 5% is
projected. At the seasonal scale, spring exhibits a drying signal across
the region. In parts of the Hastings district the decrease in spring rainfall
is projected to be up to 15%. Winter is the season with the largest increase in
rainfall projected, with up to 10% more rainfall projected for parts of the
Hastings district.
Considerations of
Tangata Whenua
47. The Provincial Development
Unit’s position paper “Water Storage and the Provincial Growth
Fund” includes the following statement under the heading “PGF
Investment Principles”
Māori land development:
Projects will be prioritised that support Māori to achieve higher returns
from their land by addressing access to water. There are catchments where
Māori have undeveloped land but low levels of access to water, which
creates a barrier to Māori land development. A comparison of
Kerikeri and Kaikohe illustrates the issues, where differences in levels of
water storage and Māori ownership of land drive very different land prices
and economic returns between the two towns. In parts of Northland and East
Coast, Māori communities lack water as a key enabler of development.
48. HBRC’s applications
to the PGF specifically references the opportunities for these projects to
contribute to Māori.
49. TANK has identified that
higher temperatures and declining rainfall may reduce water availability, while
demand for water is likely to increase. Freshwater resources also have
significant cultural significance for Māori. Shading along riverbanks,
stream flow and water quality have effects on aquatic habitats which support
mahinga kai – food gathering – which is highly valued.
Financial and
Resource Implications
50. This paper has identified
the existing LTP and PGF funding sources for this programme. Perhaps the
greater risk right now is a failure to conclude full feasibility before June
2021 as a result of time delays in relation to the PGF application process and
allocation of dedicated staff resourcing, combined with the general
availability of both internal and external subject matter experts.
51. However, it is likely that
HBRC will need to continue to resource a comprehensive work programme focussed
on regional water security into the next LTP and beyond. Staff will be
addressing the longer term resourcing requirements via the business cases for
the 2021-31 LTP.
52. In respect of HBRC’s
financial contribution to or involvement in the ownership and/or construction
of infrastructure, it is premature to speculate what shape or form that will be
until such time a preferred options are under investigation. It is
unlikely that this can or will align with the 2021-31 LTP consultation window,
but it is a possibility. In any regard, Council’s usual
Significance and Engagement criteria will apply which will trigger the need for
appropriate community consultation.
53. Given the
nature and significance of the issue to be considered and decided, and also the
persons likely to be affected by, or have an interest in the decisions made,
Council can exercise its discretion and make a decision without consulting
directly with the community or others having an interest in the
decision.
Decision Making Process
54. Staff have assessed the
requirements of the Local Government Act 2002 in relation to this item and have
concluded that, as this report is for information only, the decision making
provisions do not apply.
|
Recommendation
That the Māori Committee receives and notes the “Water Update”
staff report.
|
Authored &
Approved by:
|
Tom Skerman
Group Manager
Strategic Planning
|
|
Attachment/s
|
⇨1
|
Wallbridge
Gilbert Aztec Central Hawke's Bay MAR Pre-feasibility Assessment report
|
|
Under
Separate Cover
|
HAWKE’S BAY REGIONAL
COUNCIL
Māori
Committee
Wednesday 06 May 2020
Subject: HBRC 28 April 2020
Organisational Activities Update
Reason
for Report
1. The commentary attached provides updates from
across the Council, on the status of initiatives and work programmes.
Decision Making Process
2. Staff have assessed the requirements of the Local Government Act
2002 in relation to this item and have concluded that, as this report is for
information only, the decision making provisions do not apply.
|
Recommendation
That the Māori
Committee receives and notes the “HBRC 28
April 2020 Organisational Activities Update” staff report.
|
Authored by:
|
Drew Broadley
Community Engagement and Communications
Manager
|
Jenny Brown
Principal Business Advisor - RBP
|
|
Vicki
Butterworth
Cycle Network Coordinator
|
Desiree Cull
Strategy and Projects Leader
|
|
Peter Davis
Manager Environmental Information
|
Ceri Edmonds
Manager Policy and Planning
|
|
Russell
Engelke
Team Leader Open Spaces
|
Dean Evans
Manager Catchments Delivery
|
|
Hamish
Fraser
Works Group Manager
|
Olivia
Giraud-Burrell
Business Analyst
|
|
Craig Goodier
Team Leader Engineering
|
Martina
Groves
Manager Regional Projects
|
|
Mark Heaney
Manager Client Services
|
Nathan Heath
Catchment Manager (Wairoa/Mohaka)
|
|
Dr Andy Hicks
Team Leader/Principal Scientist Water
Quality and Ecology
|
Leeanne
Hooper
Governance Lead
|
|
Gavin Ide
Principal Advisor Strategic Planning
|
Dr Kathleen
Kozyniak
Principal Scientist (Air)
|
|
Campbell
Leckie
Manager Catchment Services
|
Dr Barry
Lynch
Team Leader/Principal Scientist (Land Science)
|
|
Anna
Madarasz-Smith
Team Leader/Principal Scientist Marine and
Coast
|
Louise
McPhail
Principal Advisor (Policy Implementation)
|
|
Malcolm
Miller
Manager Consents
|
Mark Mitchell
Team Leader/Principal Advisor,
Biosecurity/Biodiversity
|
|
Thomas Petrie
Project Manager Environmental Hotspots
|
Stacey
Rakiraki
Facilities and Fleet Manager
|
|
Anne
Redgrave
Transport Manager
|
Gill
Riley
People and Capability Manager
|
|
Helen Shea
Principal Advisor Communications
|
Andrew
Siddles
Acting ICT Manager
|
|
Bronda Smith
Chief Financial Officer
|
Dr Jeff Smith
Manager Scientist
|
|
Nick Zaman
Manager Compliance
|
|
Approved by:
|
Chris
Dolley
Group Manager Asset Management
|
Jessica
Ellerm
Group Manager Corporate Services
|
|
Liz Lambert
Group Manager Regulation
|
Joanne
Lawrence
Group Manager Office of the Chief Executive
and Chair
|
|
Iain Maxwell
Group Manager Integrated Catchment
Management
|
Tom Skerman
Group Manager Strategic Planning
|
Attachment/s
|
⇩1
|
Asset
Management Group Significant Activities Update
|
|
|
|
⇩2
|
Corporate
Services Group Significant Activities Update
|
|
|
|
⇩3
|
Integrated
Catchment Management Group Significant Activities Update
|
|
|
|
⇩4
|
Maori
Partnerships Group Significant Activities Update
|
|
|
|
⇩5
|
Office of the
CE & Chair Significant Activities Update
|
|
|
|
⇩6
|
Regulation
Group Significant Activities Update
|
|
|
|
⇩7
|
Strategic
Planning Group Significant Activities Update
|
|
|
|
Asset
Management Group Significant Activities Update
|
Attachment 1
|
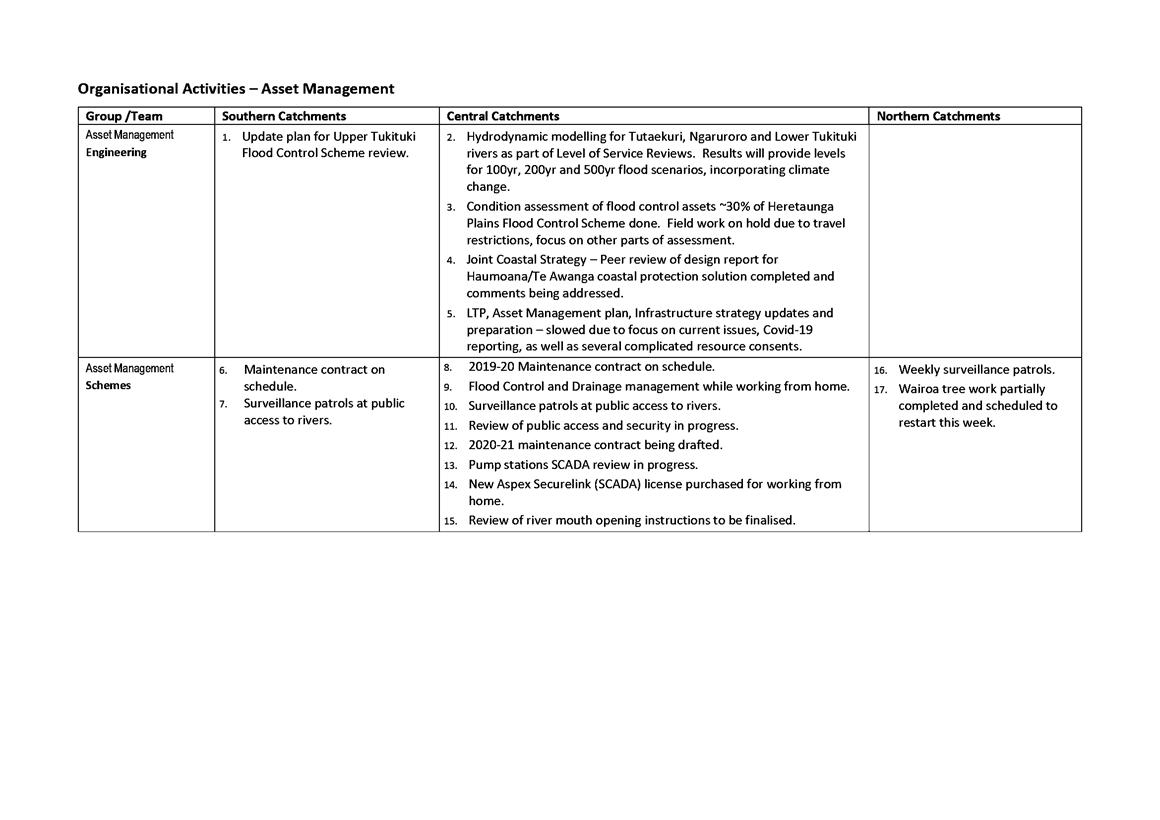
|
Corporate Services Group
Significant Activities Update
|
Attachment 2
|
|
Integrated Catchment
Management Group Significant Activities Update
|
Attachment 3
|
|
Maori Partnerships Group
Significant Activities Update
|
Attachment 4
|
|
Office of the CE &
Chair Significant Activities Update
|
Attachment 5
|
|
Regulation Group
Significant Activities Update
|
Attachment 6
|
|
Strategic Planning Group
Significant Activities Update
|
Attachment 7
|
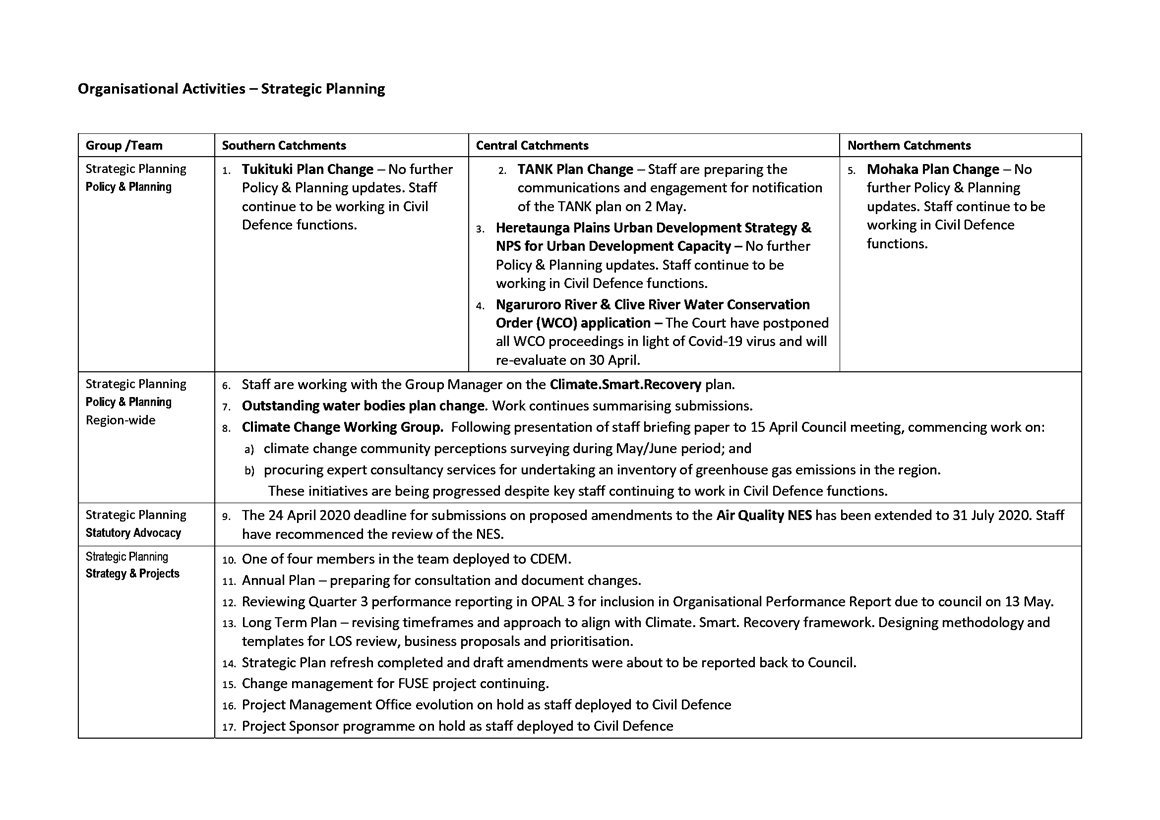
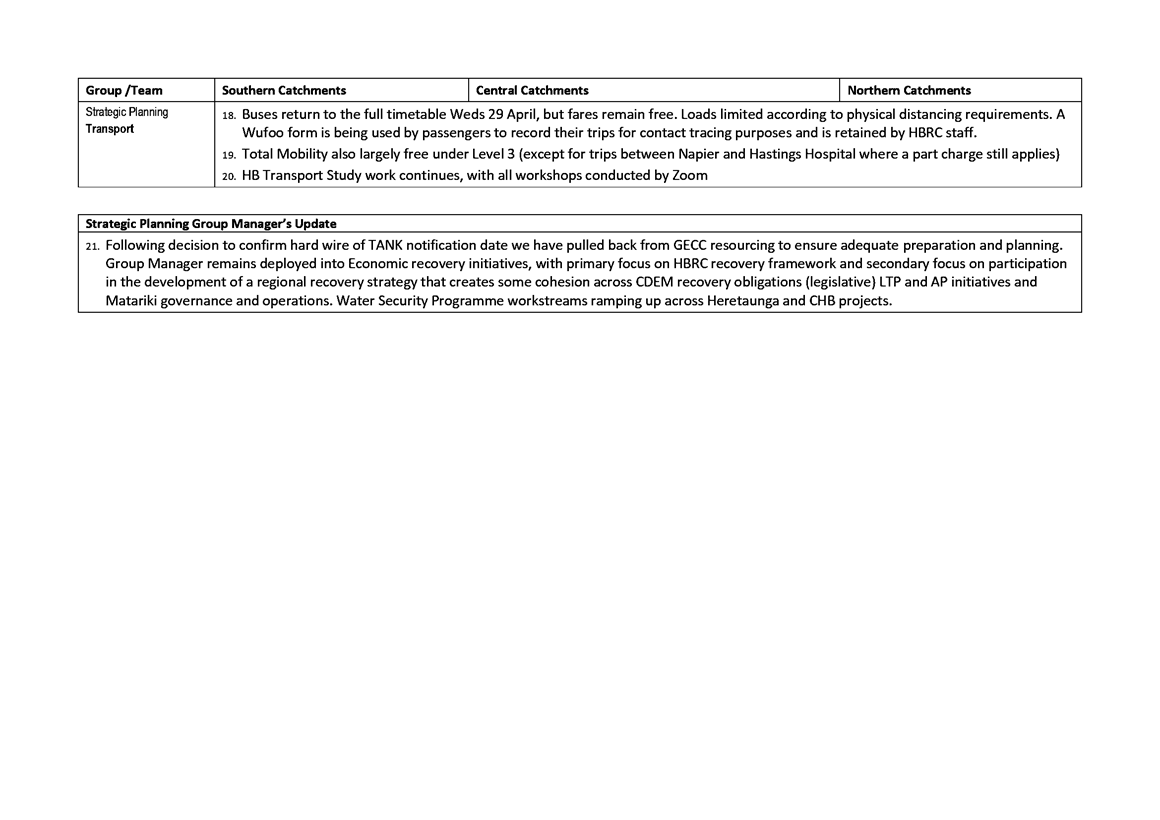
HAWKE’S BAY REGIONAL COUNCIL
Māori
Committee
Wednesday 06 May 2020
Subject: Discussion of Minor
Matters Not on the Agenda
Reason for Report
1. This document has been prepared to assist
Committee members note the Minor Items to be discussed as determined earlier in Agenda Item
5.