Meeting of the Environment and Services Committee
Date: Wednesday 21 February 2018
Time: 9.00am
|
Venue:
|
Council Chamber
Hawke's Bay Regional Council
159 Dalton Street
NAPIER
|
Agenda
Item Subject Page
1. Welcome/Notices/Apologies
2. Conflict
of Interest Declarations
3. Confirmation of
Minutes of the Environment and Services Committee held on 15 November 2017
4. Follow-ups from
Previous Environment & Services Committee Meetings 3
5. Call for Items of
Business Not on the Agenda 9
Decision Items
6. Enforcement Policy
Review 11
Information or Performance Monitoring
7. Hawke’s Bay
Biodiversity Strategy Implementation – Ecosystem Prioritisation 13
8. Science Monitoring
Network Review 17
9. Hawke's Bay Marine
and Coastal Group Update 21
10. February 2018 Hot
Spot/Freshwater Improvement Projects Update 23
11. Six Monthly Public Transport
Update 43
12. 11:00am Verbal Presentation - Chillean Needle
Grass Incursion and Control
13. 11:30am Verbal Presentation of the Te Mata Park
Trust Vision
14. February 2018 Operational
Activities Update 47
15. Discussion of Items Not on the
Agenda 63
HAWKE’S BAY REGIONAL COUNCIL
Environment
and Services Committee
Wednesday 21 February 2018
SUBJECT: Follow-ups from Previous Environment
& Services Committee Meetings
Reason for Report
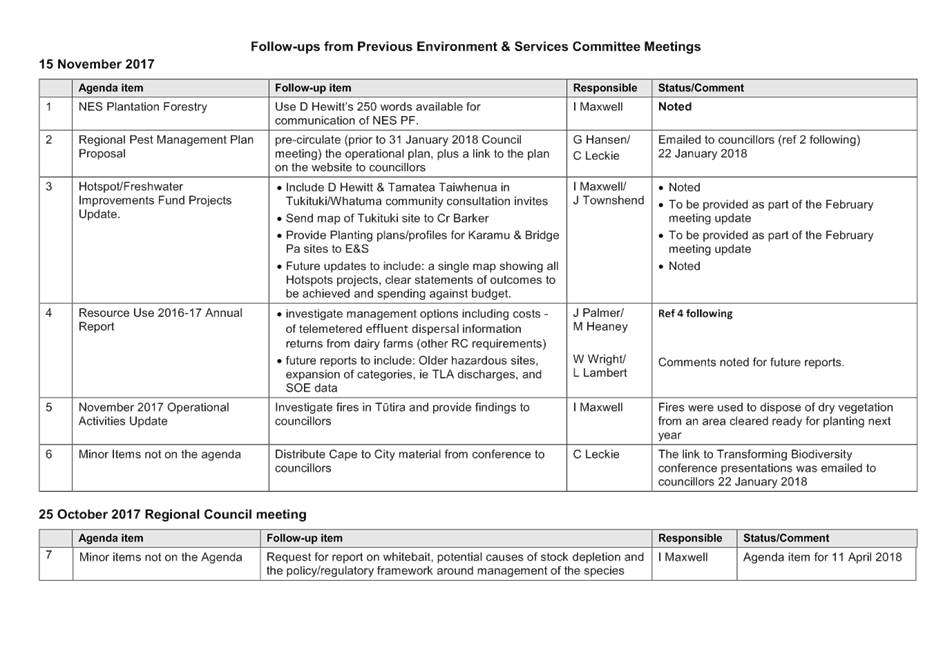
1. Attachment 1 lists items
raised at previous meetings that require follow-ups. All items indicate who is
responsible for each, when it is expected to be completed and a brief status
comment. Once the items have been completed and reported to the Committee they
will be removed from the list.
Decision
Making Process
2. Staff have assessed the requirements of the Local Government Act
2002 in relation to this item and have concluded that, as this report is for
information only, the decision making provisions do not apply.
|
Recommendation
That the Environment and Services Committee
receives and notes the report “Follow-up Items from Previous
Environment & Services Committee Meetings”.
|
Authored by:
|
Judy Buttery
Governance Administration Assistant
|
|
Approved by:
|
Liz Lambert
Group Manager External Relations
|
|
Attachment/s
|
⇩1
|
Follow-ups
from Previous Environment & Services Committee Meetings
|
|
|
|
Follow-ups
from Previous Environment & Services Committee Meetings
|
Attachment 1
|
HAWKE’S BAY REGIONAL COUNCIL
Environment
and Services Committee
Wednesday 21 February 2018
Subject: Call for Items of
Business Not on the Agenda
Reason
for Report
1. Standing order 9.12 states:
“A meeting may deal with
an item of business that is not on the agenda where the meeting resolves to
deal with that item and the Chairperson provides the following information
during the public part of the meeting:
(a) the
reason the item is not on the agenda; and
(b) the
reason why the discussion of the item cannot be delayed until a subsequent
meeting.
Items not on the agenda may be brought before the
meeting through a report from either the Chief Executive or the Chairperson.
Please note that nothing in this standing order removes
the requirement to meet the provisions of Part 6, LGA 2002 with regard to
consultation and decision making.”
2. In addition,
standing order 9.13 allows “A meeting may discuss an item that is not
on the agenda only if it is a minor matter relating to the general business of
the meeting and the Chairperson explains at the beginning of the public part of
the meeting that the item will be discussed. However, the meeting may not make
a resolution, decision or recommendation about the item, except to refer it to
a subsequent meeting for further discussion.”
Recommendations
1. That
the Environment and Services Committee accepts the following “Items of
Business Not on the Agenda” for discussion as Item 15:
1.1. Urgent items of Business (supported
by tabled CE or Chairpersons’ report)
|
|
Item
Name
|
Reason not on Agenda
|
Reason discussion cannot be delayed
|
|
1.
|
|
|
|
|
2.
|
|
|
|
1.2. Minor items for discussion only
|
Item
|
Topic
|
Raised
by
|
|
1.
|
|
|
|
2.
|
|
|
|
3.
|
|
|
|
Leeanne Hooper
GOVERNANCE MANAGER
|
Liz Lambert
GROUP MANAGER
EXTERNAL RELATIONS
|
HAWKE’S BAY REGIONAL COUNCIL
Environment
and Services Committee
Wednesday 21 February 2018
Subject: Enforcement Policy
Review
Reason for Report
1. To provide the
Committee with the opportunity to provide feedback on the HBRC Enforcement
Policy draft document and agree amendments for inclusion to enable Council
adoption.
Background
2. The
Council’s Enforcement policy has historically been housed in a series of
manuals and online directories, up until this document, they had not been
reviewed or updated for over 10 years.
3. With an increasing
demand for transparency of all council enforcement decisions, it is important
to demonstrate how we carry out our enforcement functions, what we do, why we
do it and how we do it. This document will be freely available to all members
of the public and published on the Council website.
4. As part of
providing assurance of our decision making process, the policy outlines the
principles and guidelines that we apply and adhere to. This includes
transparency, consistency, fairness, proportional and evidence based approach,
laws and ethics, accountability, targeted compliance and responsive and
effective enforcement solutions.
5. This document
will be a valuable reference tool to members of the public, Council staff
Councillors, and Environmental Officers.
Decision Making
Process
6. Council is required to make every decision in accordance with the
requirements of the Local Government Act 2002 (the Act). Staff have assessed
the requirements in relation to this item and have concluded:
6.1. The decision does not significantly alter the service provision or
affect a strategic asset.
6.2. The use of the special consultative procedure is not prescribed by
legislation.
6.3. The decision does not fall within the definition of Council’s
policy on significance.
6.4. The decision is not inconsistent with an existing policy or plan.
6.5. Given the nature and significance of the issue to be considered and
decided, and also the persons likely to be affected by, or have an interest in
the decisions made, Council can exercise its discretion and make a decision
without consulting directly with the community or others having an
interest in the decision.
|
Recommendations
1. The Environment and Services Committee receives and considers the “Enforcement
Policy Review” staff report and HBRC Enforcement Policy.
2. The Environment and Services Committee recommends that Council adopts the HBRC Enforcement Policy inclusive of any amendments
agreed at the 14 February 2018 Committee meeting.
|
Authored by:
|
Wayne Wright
Manager Resource Use
|
|
Approved by:
|
Liz Lambert
Group Manager External Relations
|
|
Attachment/s
|
⇨1
|
Hawke's Bay
Regional Council Enforcement Policy
|
|
Under
Separate Cover
|
HAWKE’S BAY REGIONAL COUNCIL
Environment
and Services Committee
Wednesday 21 February 2018
Subject: Hawke’s Bay
Biodiversity Strategy Implementation – Ecosystem Prioritisation
Reason for Report
1. To provide the Environment and Services Committee with an update on
ecosystem prioritisation, which is one of the six priority actions identified
in the Hawke’s Bay Biodiversity Action Plan 2017-2020 (the Action
Plan).
Background
2. Ecosystem-based conservation, as opposed to species-based, has
become the mainstream approach to protect indigenous biodiversity. At the
heart of this approach is maintaining and restoring a full range of
remaining natural habitats and ecosystems. It focuses on habitat and
ecosystems as a means of conserving species, diversity and processes within
them. This recognises that, by focusing on ecosystems we should maintain viable
populations of indigenous species across their natural range.
3. Hawke’s Bay region has approximately 500,000 ha of indigenous
ecosystem areas remaining today. It is unrealistic to aim for protecting
and restoring all of the remaining indigenous habitats and ecosystems
immediately, in terms of time and resources needed to do so. This is the
underlining driver for the current project - ecosystem prioritisation which
will inform where to invest scarce resources in the next 10, 20 and 30 years
for the best chance of achieving the outcomes sought.
4. The process of ecosystem prioritisation consists of four stages:
4.1. Data preparation for Zonation, including the terrestrial ecosystem
mapping (delivered by an external consultant)
4.2. Zonation analysis (delivered by an external consultant)
4.3. Refinement and interpretation of Zonation output (primarily
delivered in-house with support from partner agencies and local experts)
4.4. Development of management prescription for each site (initially
facilitated by an external consultant and predominantly delivered in-house with
support from partner agencies and local experts).
5. We are at the ‘Refinement and interpretation’ stage, and
this paper reports on the process and outputs so far.
Potential terrestrial
ecosystem mapping
6. The region was mapped for potential ecosystem types (i.e. pre-human
inhabitation) using the latest ecosystem classification system developed by the
Department of Conservation. Classification is based on climate and soil
(including substrates and susceptibility to waterlogging), but also takes into
account a known influence of volcanic (and glacial, if present)
activities. A range of other existing documentations were deployed to
create a comprehensive spatial layer of the ecosystem pattern.
7. The resulting map shows the pattern of terrestrial ecosystems that
should occur under certain environmental conditions. 61 potential
ecosystems types are mapped.
8. This base layer was intersected with the Land Cover Database (LCDB
4.0) and indigenous land cover types were extracted to estimate the remaining
areas of each ecosystem type.
9. There are approximately 500,000 ha of indigenous terrestrial areas
left in the region, which includes 58 ecosystems types. 22 of these ecosystems
are threatened (less than 30% of original area left), mostly of lowland forest
types, coastal and dune vegetation types, braided riverbed vegetation, and
wetlands. Three ecosystem types were presumed extinct (one lowland forest
type, one coastal herbfield type, and one wetland type) whose historic extents
were very small.
Types of rivers and
lakes present in the region
10. Hawke’s
Bay’s rivers and lakes are broadly characterized as below, using the
national dataset Freshwater Ecosystem of New Zealand (FENZ);
10.1. Our
22,566 km of rivers and streams consist of 33 river ecosystem types.
10.2. Our 125
lakes are divided into three geomorphic types (landslide, riverine, and
shoreline). There are 130 dams/reservoirs that sustain deep open water
systems. The total area of deep open water ecosystem (i.e. lake area) is
approximately 7,400 ha.
Zonation –
systematic conservation planning tool
11. Zonation
is undertaken using a software tool that prioritises ecosystem or habitat sites
based on their representation (i.e. ecosystem types for terrestrial and rivers,
and geomorphic types for lakes), conditions and connectivity.
12. Zonation-based
prioritisation has been adopted by a number of regional councils, including
Auckland, Bay of Plenty, Greater Wellington, and Waikato. The tool was
also used for Department of Conservation’s prioritisation on public
conservation land.
13. It
requires ‘a cap’ in which it produces the best set of sites to
achieve full representation. It is generally an area-based cap which is
set by asking ‘of the remaining indigenous ecosystems, how much area can
we manage within a given timeframe?’
14. For the
Hawke’s Bay, we have set the cap of 30% (of the 500,000 ha of indigenous
areas remaining) by 2050. The principle behind the 30% is the
species-area curve, i.e. when habitat (or a population) is reduced to 20% of
the original extent (or a population), the rate of species loss is
exponentially accelerated. Therefore 30% was chosen as a reasonable
target that balances species response with achievability and affordability.
15. The scope
of the Zonation prioritisation included terrestrial ecosystems (including
wetlands and braided riverbeds), and lakes and rivers. Three sets of
rankings were made for these ecosystem domains, which required three different
datasets. For terrestrial ecosystems, primarily a regional dataset was used
which included the potential ecosystem layer (as explained above), logging
history data and indicative pest distribution data. For the rivers and
lakes, the national dataset FENZ was used, which contains stream and lake types
(as described above) and freshwater conditions.
16. Although
ranking was done separately for the three ecosystem domains, ranking of
terrestrial ecosystems reflects the connectivity with lakes and/or
rivers. For example, if there are two sites representing the same
ecosystem type, but one intersects with high-ranked streams and the other
doesn’t, Zonation will rank the former higher as it would account for the
connectivity of the terrestrial ecosystem with the river ecosystem.
Zonation output and
interpretation
17. Zonation
identified 900 terrestrial sties (150,000 ha), 10,034 segments of rivers (6,700
km), and 77 lakes (1,700 ha) as the priority 30%. These sites/segments
represent a full range of ecosystem types that are present in the region.
18. 529 of
the 900 priority terrestrial sites are less than 10 ha in size. Many of
these small sites represent threatened ecosystem types whose remnants are
becoming scarce, small and fragmented.
19. Interpretation
of the Zonation output has been done in collaboration with local experts with
ecological and site knowledge, and involves verification of the ecosystem types
and reviewing the boundaries indicated by the Zonation. Where expert knowledge
or information doesn’t exist, the sites were labelled as
‘ground-truthing required’.
20. To date,
over 200 hours of contribution by DOC and HBRC staff, and Biodiversity Strategy
Implementation Planning Group members have been spent on interpreting and
refining the terrestrial ecosystem sites ranking. This process is still
underway (85% complete).
21. The
ranking of terrestrial ecosystem sites takes into account the connectivity to
rivers and lakes. Many of the top 30% terrestrial sites adjoin to, or
contain highly ranked river segments and lakes. Given the very large
volume of river segment and lake sites which are ranked top 30%, staff propose
that they do not review river/lake sites individually. If significant
values associated with river/lake sites that are not currently associated with
the top 30% terrestrial ecosystem sites, they will be added.
22. As with
any modelling tool, Zonation has limitations which need to be considered in the
decision making process. Examples of the limitations include the
prioritisation framework on lakes, including the following issues:
22.1. Lack of
a regional dataset for conditions of lakes
22.2. Lack of
a regional dataset for degree of threats towards lakes
22.3. The
limitation of the area-based cap, which discourages larger lakes such as
Waikaremoana from being ranked higher
Using ecosystem
prioritisation to achieve the Biodiversity Strategy outcomes
23. Ecosystem-based
site prioritisation is a critical first step to achieving the Biodiversity
Strategy objectives and outcomes of sustaining, protecting, and improving the
full representation of native species and habitats.
24. Ecosystem
prioritisation will form part of the informed conversation and decision making
by the Biodiversity Guardians of HB and the HB Biodiversity Trust who drive the
Action Plan and manage funding for biodiversity projects in the region.
25. The
Biodiversity bid for the LTP 2018-28 includes $200k p.a. to fund operations on
the ground, that is for protection or restoration work on identified sites (the
bid also includes $200k for endowment growth, and $150k for a Biodiversity
Strategy Project Manager). Operating expenditure of $40k for outcome monitoring
is also proposed in a Science budget code. This funding will be dedicated to
sites that are prioritised through this process.
26. It is
critical that operational funding is available in year 1 of the LTP 2018-28,
for a range of strategic reasons:
26.1. Some
priority sites and ecosystem sites are on the brink of extinction, and need
immediate action
26.2. Projects
on the ground will keep up momentum generated through Action Plan development
26.3. Projects
on the ground are essential to win hearts and minds in the community
26.4. Evidence
of successful projects help when seeking new funding.
Application of the
ecosystem prioritisation to inform other council activities
27. The
ecosystem prioritisation framework could inform other council programmes, and
contribute to achieving multiple outcomes.
28. The
ecosystem prioritisation framework will become an integral part of integrated
catchment management being proposed through the draft Long Term Plan.
Priority sites that are identified in catchments of interest could also be part
of the solution to address issues such as soil erosion, sediment production,
and water quality. This is because these remnants are providing ecosystem
services such as soil conservation and water retention, at a varying degree
depending on the their condition. These remnants are also proof that the
ecosystem is resilient to the condition of the site, and could be capitalized
upon by afforestation as part of integrated catchment management.
29. Landscape-scale
predator controls will be targeted most appropriately where priority ecosystem
sites occur. Small, fragmented priority sites would particularly benefit
from wide-scale predator control in conjunction with site-specific actions
(e.g. fencing) as gains are larger when pressure from pest plants and animals
are reduced in the surrounding landscape as well as within the sites. An
initial analysis shows that around 350 of the 900 priority ecosystem sites
would receive predator control from the first 8 years of Predator Free
Hawke’s Bay implementation should it proceed.
30. The
Engineering section’s Ecological Management and Enhancement Plan
(EMEP) is currently targeted at the braided river systems in the region.
A large part of their management footprint and adjacent lands contain some of
the priority ecosystem sites. Their enhancement effort could be aligned
and targeted at such sites to deliver multiple outcomes. Some of the existing
enhancement work under the EMEP already coincides with priority ecosystem sites
(e.g. Tukituki River mouth).
Next steps
31. We will
continue interpretation of terrestrial sites identified by Zonation in
partnership with DOC and with contributions from local experts from the
Biodiversity Implementation Planning Group (IPG) members.
32. We will
focus on terrestrial biodiversity sites in terms of data interpretation, given
that most highly ranked river segments and lakes are contained or connected
with the top 30% terrestrial sties.
33. It is
also likely that a prescribed management plan for a terrestrial site
containing/ adjoining rivers and lakes will improve the health of aquatic
systems, given the connectivity of land and water. Should there be any
specific actions needed to improve health of aquatic ecosystems, these will be
integrated as part of the management approaches.
34. It is
proposed to develop management prescriptions using the process and database
template developed by an external consultant for the Bay of Plenty Regional
Council in collaboration with DOC (BOP conservancy). Their process and
templates enable users to identify key actions and estimate costs for those
management actions.
35. We will
be developing management prescriptions for up to 100 priority sites (out of
900) of various ecosystem types across the region. This exercise would be
facilitated by an external consultant with participation from HBRC, DOC and
local experts. Once the process and database template are set up,
management prescriptions for the rest of the priority sites will be
predominantly delivered in-house with support from partner agencies and local
experts.
Decision Making
Process
36. Staff have assessed the
requirements of the Local Government Act 2002 in relation to this item and have
concluded that, as this report is for information only, the decision making
provisions do not apply.
|
Recommendation
That the Environment and Services
Committee receives and notes the “Hawke’s Bay Biodiversity Strategy
Implementation – Ecosystem Prioritisation” staff report.
|
Authored by:
|
Keiko Hashiba
Terrestrial Ecologist
|
|
Approved by:
|
Dr Stephen
Swabey
Manager Science
|
Iain Maxwell
Group Manager Resource Management
|
Attachment/s
There are no
attachments for this report.
HAWKE’S BAY REGIONAL
COUNCIL
Environment
and Services Committee
Wednesday 21 February 2018
Subject: Science Monitoring
Network Review
Reason for Report
1. To outline the
recent comprehensive review undertaken of HBRC’s Environmental Monitoring
Network (EMN), and identifies the key findings.
Background
2. HBRC operates
an environmental monitoring network in part to fulfil its responsibilities
under s35 of the Resource Management Act 1991 to monitor the State of the
Environment (SOE), and also to provide data for other functions undertaken such
as flood risk management, which are driven by other legislation such as the
Soil and Rivers Control Act 1941.
3. The EMN is
reviewed periodically in part or in total by external parties to ensure the network
remains fit for its purposes, and was reviewed recently to inform staff of any
network design issues ahead of the development of the Long Term Plan.
4. HBRC operates
environmental monitoring networks (EMNs) in six domains – groundwater,
surface water, coastal, ecology (including land, freshwater, and coastal), land
and air/climate.
5. Our EMNs are
developed and operated to provide long-term records of environmental variables
such as rainfall, river flow, nutrient flux, riverine algal cover, marine water
quality and habitats, groundwater quality/quantity and air quality.
6. Data may be
collected from individual sites in each network very frequently (e.g. every few
minutes with climate stations or river stations) or quite infrequently (e.g.
2-yearly with estuary habitat surveys).
7. Data from
EMN’s are used to identify state and trends in the six key domains.
Monthly reports are issued for temperatures, rainfall, river flow, groundwater,
soil moisture, lightning strikes, recreational water quality and the climate
outlook. Annual summary reports are published for the state of all the domains.
Five year reports detail long-term trends in those domains.
8. EMN data are
subsequently used by HBRC as key information for other activities such as
policy development, for example for TANK; for monitoring compliance with
National Environmental Standard’s; and for the design and operation of
flood management schemes.
9. Data from our
EMNs are also used by a wide range of stakeholders through our website, through
the LAWA website, and through data feeds taken directly from our online
databases.
10. As land-use activities,
recreational activities and available technologies change over time, HBRC
modifies its EMNs to ensure they continue to meet its needs, and the needs of
its communities and stakeholders.
11. The review just completed
considered how well the EMNs meet HBRC’s objectives and targets. It
examines the costs associated with existing EMNs and likely future costs. It
identifies that collecting data from EMNs is not enough – the data must
be shared readily with communities and stakeholders. Finally, it notes the need
for transparency and quality control in data collection and dissemination.
12. The consultants
undertaking the review consulted widely with HBRC teams and with external
stakeholders about what matters they wished to see included in our EMNs.
13. The general conclusions of
the report include:
13.1. HBRC’s EMNs should
be designed to suit its strategic goals, and their benefits should be
considered against their costs
13.2. EMN design should focus
on integrated catchment management, with a minor focus on hotspots and emerging
issues
13.3. Mātauranga Māori
and citizen science should be included in EMNs, and resourced to improve data
robustness and management
13.4. Data should be made more
accessible from HBRC’s website
13.5. Compliance data could be
integrated into databases for EMNs, with appropriate quality checking and flags
to identify its source
13.6. Annual report cards,
rather than full annual SOE reports, could be produced
13.7. Plan Effectiveness
Reporting should be updated
13.8. Metrics for social,
cultural and economic aspects of resource management could be developed to
track resource use, revenue generated, and ratepayer satisfaction
13.9. Time could be given to
integrating HBRC EMNs with other agencies’ EMNs, to avoid duplication
13.10. Outside advice, such as an advisory
panel, could be used to improve communication of HBRC data and analyses with
communities and stakeholders
14. Specific conclusions of
the report with respect to individual domains include the following:
14.1. Lysimeters could be
mothballed, since they are less effective than other methods
14.2. Short-term
weather/climate sites could be extended through time, to provide more long-term
coverage
14.3. River sites used for
both hydrology and water quality and ecology could be better aligned to be the
same site. The same analysis for groundwater quality and groundwater quantity
networks could be undertaken.
14.4. Continuous monitoring of
groundwater quality is now feasible, and this could focus on nitrate as a key
analyte. Other analytes such as arsenic could be routinely monitored.
Event-based monitoring could take place, and more work on stygofauna and
troglofauna could be undertaken. Water quality may need more monitoring in
smaller aquifers
14.5. Groundwater quantity
(level) monitoring could include more telemetered sites, to reduce maintenance
costs, and further monitoring could take place in smaller aquifers
14.6. Coastal water quality
sites could be aligned with other monitoring locations, and focus more on
specific issues, now that the general baseline has been established for Hawke
Bay
14.7. Citizen science has
significant potential in the water quality and ecology (WQE) team’s work,
and this could be developed further.
14.8. Land science could focus
more on land use management practices, and land use change, and move away from
synoptic work that has established the existing baselines
14.9. Biodiversity and
biosecurity monitoring networks could be established to provide baseline data
for these work programmes
14.10. Alignment of various EMNs could be
improved both to focus on policy priorities and to identify and assess linkages
between land, water and coastal domains
14.11. Reserve funding for emerging issue
investigations is important in all domains
14.12. Gradual upgrading of air quality
monitoring equipment could allow for higher spatial resolution understanding of
problems
Next Steps
15. Some
of the actions suggested as part of the EMN review have already been undertaken
as part of existing work programmes in a variety of budgets. For example,
annual report cards are now produced in lieu of reports, for the State of the
Environment annual reporting (project 153).
16. Other
suggested actions have been incorporated into the Long Term Plan, including a
move to Integrated Catchment Management approaches and integration of citizen
science and Mātauranga Māori.
17. An
initial scan of the recommendations has not revealed anything that required
immediate change or was of likely immediate significant cost. Some
recommendations had been anticipated (moving to greater use of telemetry for
example) and are included within the current LTP.
18. The
further analysis and cross council discussion required for some of the
suggested actions is underway. If any small changes to funding are
required, these will be brought into the Annual Plan in future years. Some
initiatives may occur over several years, and may be funded as part of the next
Long Term Plan.
Decision Making Process
19. Staff have assessed the
requirements of the Local Government Act 2002 in relation to this item and have
concluded that, as this report is for information only, the decision making
provisions do not apply.
|
Recommendation
That the Environment and Services
Committee receives and notes the “Science Monitoring Network
Review” staff report.
|
Authored by:
|
Dr Stephen
Swabey
Manager Science
|
|
Approved by:
|
Iain Maxwell
Group Manager Resource Management
|
|
Attachment/s
There are no
attachments for this report.
HAWKE’S BAY REGIONAL
COUNCIL
Environment
and Services Committee
Wednesday 21 February 2018
Subject: Hawke's Bay Marine and
Coastal Group Update
Reason for Report
1. To provide the
committee with an update on the Hawke’s Bay Marine and Coastal Group
activities.
Background
2. In June 2016 a
Marine Information Review was presented to Council highlighting large gaps in
our knowledge around the marine environment and a perceived ongoing degradation
of the marine environment in the Hawke’s Bay region.
3. Since this
review, the Hawke’s Bay Marine and Coastal Group has been formed. Chaired
by HBRC staff, this includes representatives of Napier Port Fisherman’s
Association, Fisheries Inshore New Zealand, Te Ohu Kaimoana, Legasea
Hawke’s Bay, Pania Surfcasting Association, Ministry for Primary
Industries, Department of Conservation, Ngati Kahungunu, Ngati Kere, Ngati
Pahauwera, and Heretaunga tamatea.
4. This Group has
been meeting quarterly since its inception in September 2016.
5. The Group
engaged Dr Tim Haggitt from ECoast Ltd to develop a roadmap outlining the
research required to inform management of the Hawke’s Bay Coastal Marine
Area.
Hawke’s Bay Marine and Coastal
Group Research Roadmap
6. The
Hawke’s Bay Marine and Coastal Group Research Roadmap was developed
during 2017 and is currently in final draft form. The Roadmap revolves around
three key themes prioritised by the members of the group:
6.1. Terrestrial
and coastal linkages
6.2. Ecosystems
and habitats
6.3. Fisheries
7. Under each of
these themes are sub-themes focused on specific areas of research agreed by the
group.
8. The Roadmap
takes an holistic view of the marine environment, including those areas where
the marine area and coast are linked to freshwater and the land.
Strategic fit
9. The vision of
the Roadmap is that it will inform the direction of marine and coastal research
in Hawke’s Bay for years to come.
10. In turn the knowledge
gained from this research will lead to better informed management of this
resource.
Where to next
11. Where necessary, the HBMAC
group will develop an implementation plan for each of the research themes.
12. It is estimated that the
investment required to complete this research is in the region of $5 million
over the next 5 years. This money will potentially be sourced from agencies
with responsibilities in the marine space.
13. HBRC proposes in the draft
Long Term Plan to increase spending in this domain, to meet its contribution to
research requirements in the marine area.
14. HBRC is committed to
partnering with MPI, commercial and recreational fishers, iwi and the
Department of Conservation to meet the funding required for this research.
Decision Making Process
15. Staff have assessed the
requirements of the Local Government Act 2002 in relation to this item and have
concluded that, as this report is for information only, the decision making
provisions do not apply.
|
Recommendation
That the Environment and Services
Committee receives and notes the “Marine Science Update”
staff report.
|
Authored by:
Approved by:
|
Dr Stephen
Swabey
Manager Science
|
Iain Maxwell
Group Manager Resource Management
|
Attachment/s
There are no
attachments for this report.
HAWKE’S BAY REGIONAL
COUNCIL
Environment
and Services Committee
Wednesday 21 February 2018
Subject: February 2018 Hot
Spot/Freshwater Improvement Projects Update
Reason for Report
1. To provide an update on progress on the Freshwater
Improvement/Hotspots environmental projects.
Background
2. The environmental ‘Hot Spot’ funding of $1m is to
accelerate action on six hot spots during 2017/2018.
|
Ahuriri
|
Tukituki
|
Karamu
|
Marine
|
Tutira (FIF)
|
Whakaki (FIF)
|
|
$200,000
|
$100,000
|
$150,000
|
$150,000
|
$200,000 4 years
|
$200,000 5 years
|
Freshwater Improvement Fund: Lake
Tūtira (Te Waiū oTūtira, The Milk of Tūtira), HBRC
partnership with Maungaharuru-Tangitū Trust
3. MfE is reviewing our final stage two application for the Freshwater
Improvement Fund. All going well we expect to start this project before March
2018. We cannot start working on our project until the Deed is signed.
4. A strong partnership between HBRC and Maungaharuru-Tangitū
Trust continues. We have been working closely throughout this process;
drafting and finalising the work programme and this years’ annual plan.
5. Everything is in place to start. Our first tasks will be; the
development and implementation of our project health and safety plans. A
Governance Group meeting within the first month, and our contractor will start
work on the Integrated Catchment Management Plan.
6. Total project costs: $3,345,264
6.1. FIF contribution $1,557,781
6.2. HBRC contribution $1,732,483
6.3. Maungaharuru-Tangitū Trust contribution $76,000
7. The table below outlines a brief description of the activities
within the project including the deliverable timeframes and costs.
|
Deliverables
|
Overview
|
$
|
Year(s)
|
|
Integrated Catchment Management Plan
|
Work with the community to understand their
vision/aspirations for the catchment. Identify other agency initiatives
and coordinate for better decisions made about land use, water resources and
infrastructure within the Lake Tutira catchment with the overarching objective
of improving the Mauri and water quality of Lake Tutira.
|
$50k
|
2018
|
|
Farm Environmental Management Plans
|
Working with the community to establish
farm environmental management plans. These will include some general
farm information, identification of environmental risks, recorded good
management practices and actions for improvement.
|
$63k
|
2018-2019
|
|
Farmer Incentive / Subsidy Scheme
|
To assist and encourage the implementation
of Farm Environmental Management Plans, a funding scheme for landowners will
be established for land action improvements (planting, fencing etc.
|
$500k
|
2018-2021
|
|
Papakiri Stream Low Flow Connection
|
Re-connection of the Papakiri Stream, low
flow only. The low flow connection will allow 50% of the flow of Papakiri
into the lake, while restricting flows during heavy rain events, which
transport sediment.
|
$66k
|
2018
|
|
Diversion Strengthening (Papakiri Stream)
|
This work is proposed in conjunction with the Papakiri
low flow connection work above, but can be considered a standalone
initiative. Strengthening of the existing diversion embankment through
reconstructing, raising and lengthening the 1,000m stop bank. This will
reduce the over flow of water into the lake during heavy rain events which
normally transports sediment adding to the legacy issue.
|
$49.5k
|
2018
|
|
Lake Tutira Air Curtain
|
Aeration bubbler to be constructed and
installed into Lake Tūtira. The aeration is to address legacy nutrient
levels within the sediment in the bottom of the lake, and stabilise the water
column reducing frequency of algae blooms.
|
$300k
|
2018
|
|
Southern Outlet
|
Strong community desire to see an outlet connection
between Waikopiro Lake and Lake Orakai at the southern end of the Lake
complex. It has the potential to change the flow and direction of currents
within the lakes creating a longitudinal flow. And viable fish passage into
the lakes, which will improve mauri within the lakes.
|
$687k
|
2021
|
|
Tūtira Regional Park Sediment Traps
|
Sediment traps constructed on Tutira
Regional Park sub-catchments Kahikanui and Te Whatu Whewhe.
|
$507k
|
2018-2019
|
|
Monitoring site equipment construct and
upgrade Capex and regime
|
New telemetered flow site and WQ equipment
installed on Papakiri Stream, plus upgrades for the new buoy in Tūtira
and the installation of the old Tūtira buoy into Waikōpiro.
A monitoring programme to measure
effectiveness of works implemented and inform future
action. When the buoys are in place real time monitoring
for oxygen, temperature and chlorophyll a. With monthly monitoring for water
samples.
|
$409k
|
2018
|
|
MTT Cultural Health Index Monitoring
|
A cultural monitoring programme will be
developed, to measure mauri and the effectiveness of the activities
implemented, also building hapū capacity in monitoring.
|
$64k
|
2018-2021
|
|
Riparian Enhancement of Lake Tūtira
|
On-going planting around Lake Tūtira
|
$76k
|
2018
|
|
Project Management role
|
Across the life of the project (4 years).
|
$468.5k
|
2018-2021
|
|
Land Services Advisor
|
Position to coordinate and draft ICPM and
implement as well as coordination of FEMP drafting and implementation.
|
$144k
|
2018-2021
|
|
Health and Safety, Communication + admin
costs.
|
Communications, promotion, community
engagement, Koha. Project Health and Safety plans.
|
$21k
|
2018-2021
|
|
|
Total
|
$3.35m
|
|
Freshwater
Improvement Fund: Whakaki Lake (Sunshine,
wetlands and bees will revitalise the taonga of Whakaki), HBRC partnership with Whakaki Lake Trust
8. MfE is reviewing our final stage two application for the Freshwater
Improvement Fund. This included our work programme and a detailed annual
plan for the first year, and supporting documentation for two new deliverables
added into our application.
9. During this stage two process, the Whakaki Lake flooded surrounding
farmland, as it does most years, causing an increase in nutrient leaching,
reduced production and very high tensions among the community.
Discussions with the community highlighted the priority need for a solution to
manage the water levels of the lake.
10. These
discussions re-shaped our FIF deliverables to include the construction of an
adjustable weir in the Rahui Channel, and the alignment of the Waikatuku
Stream. The weir is a key structure that will help bring certainty around water
level management at critical times of the year. It will help make opening
decisions faster and avoid flooding while retaining enough water in the lake
during spring openings. Detailed water level management plans, including weir
levels, are to be developed with the stakeholders as part of this project when
started.
11. The
alignment of the Waikatuku Stream will help reduce fresh inputs of sediment
from the catchment into the lake, as it will redirect the flow of the Waikatuku
Stream towards the opening end of the Rahui Channel, rather than directly into
the lake. The weir and stream alignment will work in partnership with the weir,
as the lip of the weir will facilitate even more sedimentation, such that when
the lake is opened to the sea via the Rahui channel, it will flush sediment
that has accumulated there rather than in the lake.
12. These new
deliverables added an estimate of $500k to our project costs. This required us
to analyse our budget and find savings without compromising on our objectives.
It also made us look for other potential income sources.
13. Through
MPI’s Regional Growth fund, we have submitted an application for $100k to
cover planting and fencing for the Manuka establishment. MPI are supportive of
our application and we expect to hear the outcome from our submission in the
coming weeks. We have also secured $50k as a contribution from Land Management
to align the stream this financial year. While further research into specific
project costs have provided savings and enabled us to meet all the costs for
our deliverables.
14. Currently there are
different agency work streams in either progress, or being proposed. This is a
potential risk where the community could become overwhelmed by the amount of
activity and disengage completely. To mitigate this we are working closely with
the Whakaki Catchment Group, to establish inter-agency work stream alignment
towards the community’s aspirations. This also provides an
opportunity share knowledge and build our relationships, while establishing a
consistent approach for the community.
15. Dr.
Simone Langhans, a scientist from Germany is revisiting us through the
Marie-Sklodowska-Curie Fellow. Simone will be here to design a
multi-criteria decision making tool, which combines individual and collective
value judgements to be combined with scientific understanding to produce a
transparent decision support tool. She will focus on 'water level management'
for the weir. This will include what needs to go in the consent for how lake
openings and weir configurations be managed.
16. Also, a
visiting Agricultural Engineering student Cindy Asmat, from Peru, has
experience with solar irrigation and will help us investigate and refine
operating parameters of the recirculating wetland this financial year.
17. Total
project costs: $3,273,310
17.1. FIF
contribution $1,605,404
17.2. HBRC contribution $1,548,905
17.3. Fish
and Game $15,000
17.4. MPI
$100,000
18. The table
below outlines a brief description of the activities within the project
including the deliverable timeframes and costs.
|
Deliverables
|
Overview
|
Total
Cost
|
Year(s)
|
|
Weir
|
A weir will be built to better manage water
levels and ease the decision making process of lake opening in the spring.
This activity will have to get support from the Community via a Resource
Consent including a Management plan for the structure.
|
$400k
|
2018-2019
|
|
Recirculating wetland
|
A recirculating wetland will be able to
artificially skim the fine layer of sediment and bacteria sitting on the lake
floor and export it on the land. This filtering system should recirculate the
entire lake water body in one year.
|
$768k
|
2018-2022
|
|
Manuka plantation
|
80 Hectares of Manuka plantation
established, including some fencing will be established. Establishing Manuka
plantations will provide a source of income to help sustain the initiatives
developed through this project. There will be some fencing
|
$274,k
|
2018-2022
|
|
Rahui Fencing
|
Fencing for stock exclusion from the Rahui
Channel and installing water troughs for cattle.
|
$53k
|
2018-2019
|
|
Refurbish Whakaki Lake School
|
The refurbishment of the Whakaki School and
reopened as a centre for cultural and ecological learning.
Ecotourism and learning opportunities at
Whakaki will expand.
|
$200k
|
2018
& 2019
|
|
Waikatuku alignment
|
The Waikatuku alignment will redirect the
flow of the Waikatuku Stream towards the opening end of the Rahui Channel.
This will divert upstream sediment away from the Lake and towards the sea.
|
$100k
|
2018
|
|
Soil conservation plantings
|
$24k per year across the life of the
project.
|
$120k
|
2018-2022
|
|
Water monitoring
|
A robust monthly water quality-monitoring
regime, testing nine varying points in and around the Lake and tributaries.
|
$211.6k
|
2018-2022
|
|
Bird monitoring
|
|
$15k
|
2018-2022
|
|
Tree maintenance
|
|
$120k
|
2019-2022
|
|
Forced closure trial
|
Forced closure trials used until the weir
has built, to make sure the lake is not empty after a spring opening.
|
$40k
|
2018
& 2019
|
|
Public access to Lake
|
At least one entrance point to the lake
will be developed and beautified, including new signage installed.
|
$20k
|
2019-2020
|
|
Honey strain testing
|
|
$5k
|
2018-2022
|
|
Community Engagement
|
Facilitated pakeke hui,
facilitated Hui a Iwi, community day
Development of a blog
Whakaki Catchment Group –
public presentations
|
$68k
|
2018-2022
|
|
Project Management role & Facilitator
role
|
|
$557k
|
2018-2022
|
|
Admin Costs / legal fees/ IT costs/
|
|
$136k
|
2018-2022
|
|
Total
|
$3.27m
|
|
Hot Spot: Tukituki River
|
Tukituki
$100k
|
Project Lead
|
6,167 plants (approx.)
|
1.57km fencing
|
|
$69k Makirikiri restoration
|
Nicola McHaffie
|
2,200
|
530m
|
|
$29.5k Hunt wetland
|
Joanne Hales
|
3,967
|
40m
|
|
$1.5k Flood fencing demonstration
|
Brendan Powell
|
|
1km
|
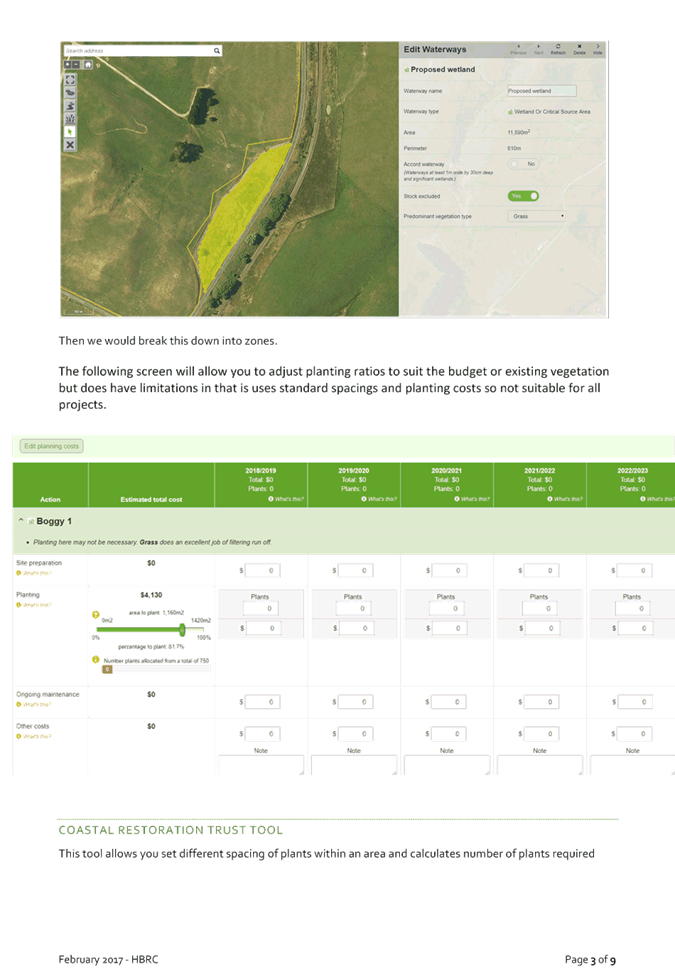
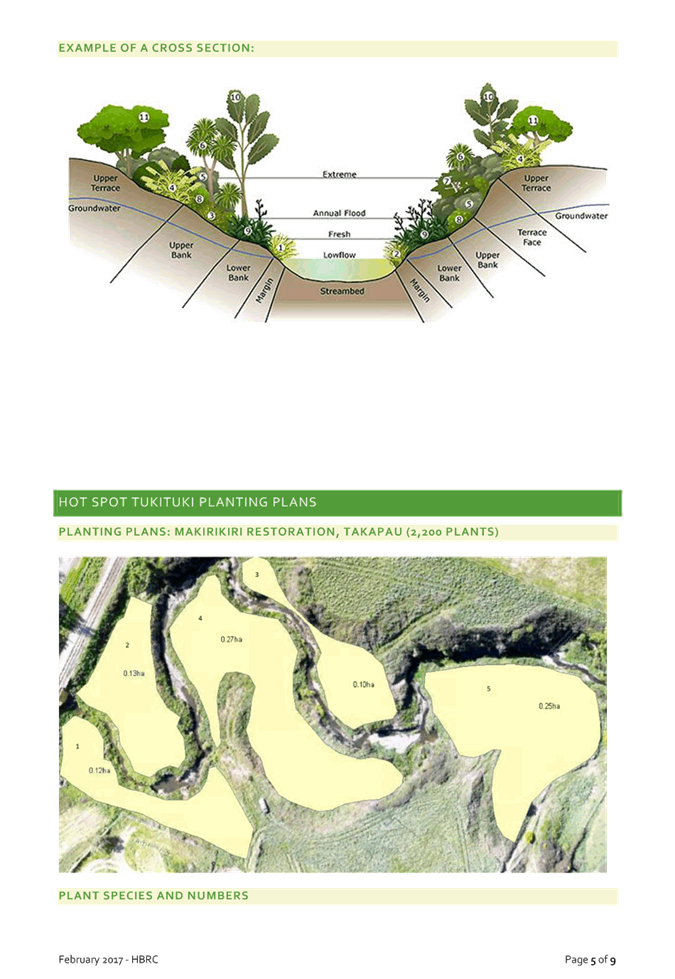
19. The Makirikiri
restoration project, just outside of Takapau, is a demonstration site for
riparian management, for engaging the local community and aligning regional
water quality objectives with wider manawhenua values.
20. We have
completed the first round of weed control including the removal of over-mature
willow trees and other weeds infestations. Contracts are underway for the
fencing, further weed control, planting and installation of the path. A
whakawaatea hosted by the local marae is scheduled for the 11 February
with councillors from both HBRC and CHBDC attending. Next steps; Works Group to
begin site preparation for the limestone path and our fencing contractor will
start erecting the fence over the next few days .Also we are to liaise with the
marae and the community to round up volunteers.
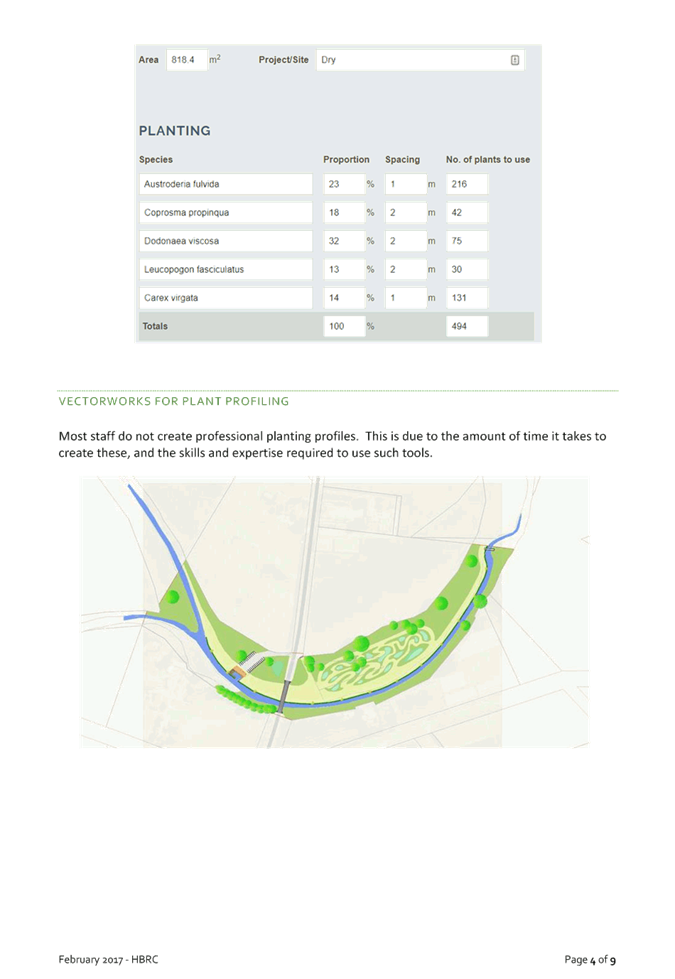
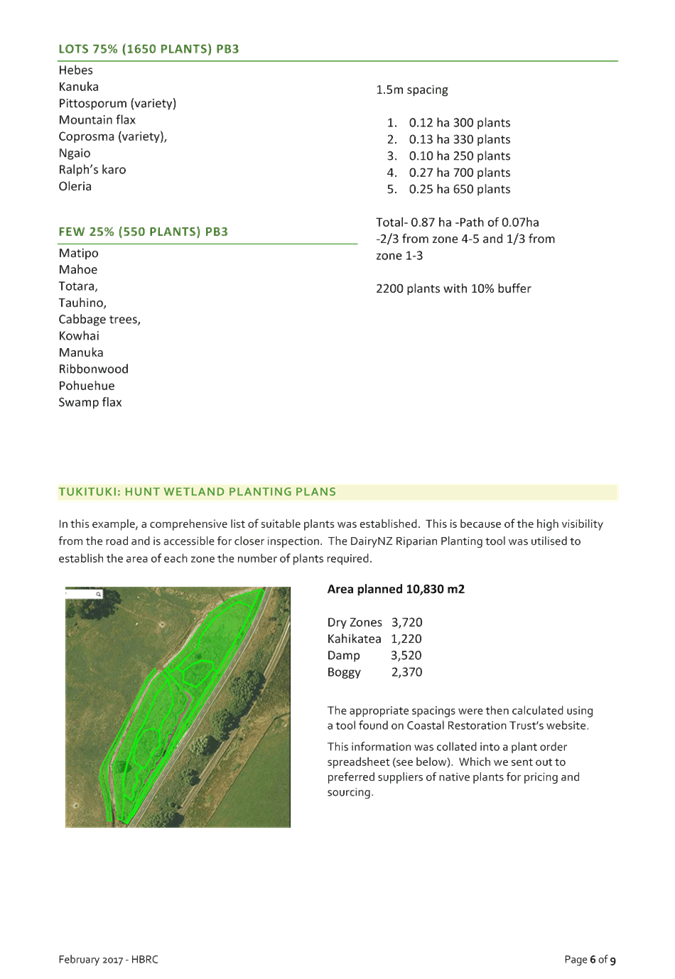
21. Hunt
wetland project is to restore a hectare of wetland,
situated alongside the Takapau Ormondville Road, back to native plants.
Currently this is area is in rank grass with minimal weed problems. The
grass is long and dense so staged spot spraying is required to prepare for
planting in the winter. Educational signage will be erected at the site to
describe the plants and the water quality benefits of a wetland.
22. Flood
fencing demonstration behind Craggy Range. This
project will trial and demonstrate a flood fencing option for areas where
permanent fencing are unsuitable and are repeatedly wiped out by floods. A
fence has been installed at the site before and was wiped out during a
flood. The new fence will use flexible fibreglass standards and
biodegradable polywire.
Hot Spot: Te Whanganui-ā-Orotu (Ahuriri Estuary)
|
Ahuriri
$200k. Project
Lead: Anna Madarasz-Smith
|
|
$40k
Ficopomatus removal
|
|
$20k
Ahuriri Catchment Land Action Plan for
|
|
$80k
Catchment works (plants
5,545, fencing 7.1km)
|
|
$60k
Catchment Hydrology
|
23. Ficopomatus
removal: To restore water flow between the upper
and lower estuary, we (in partnership with Mana Ahuriri Trust) removed 219
tonnes of invasive marine tubeworm from the estuary.
24. The
Ahuriri Catchment Land Action Plan for sediment and
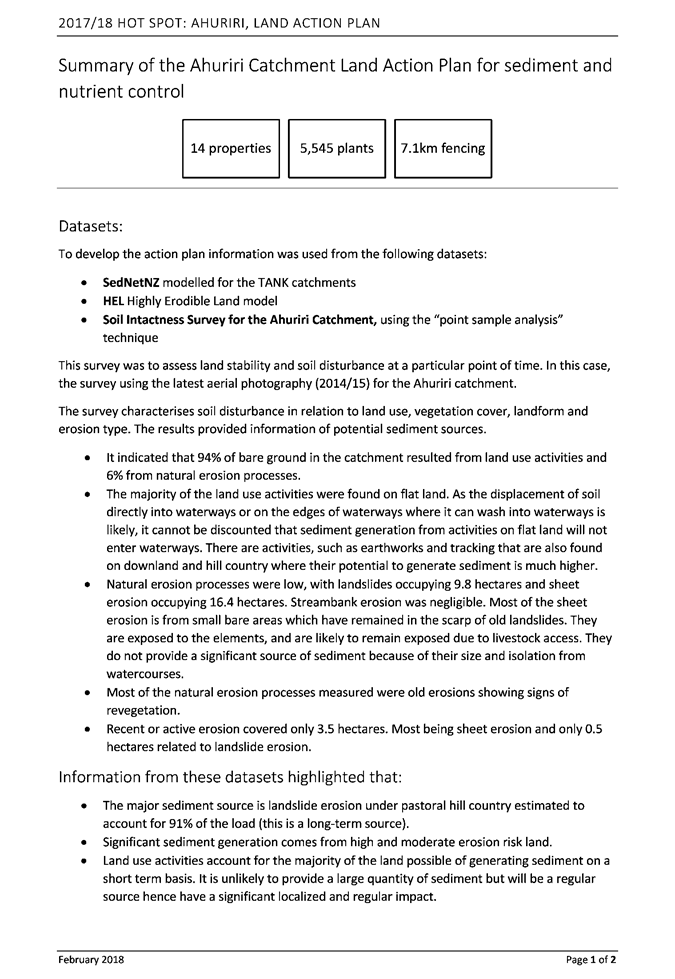
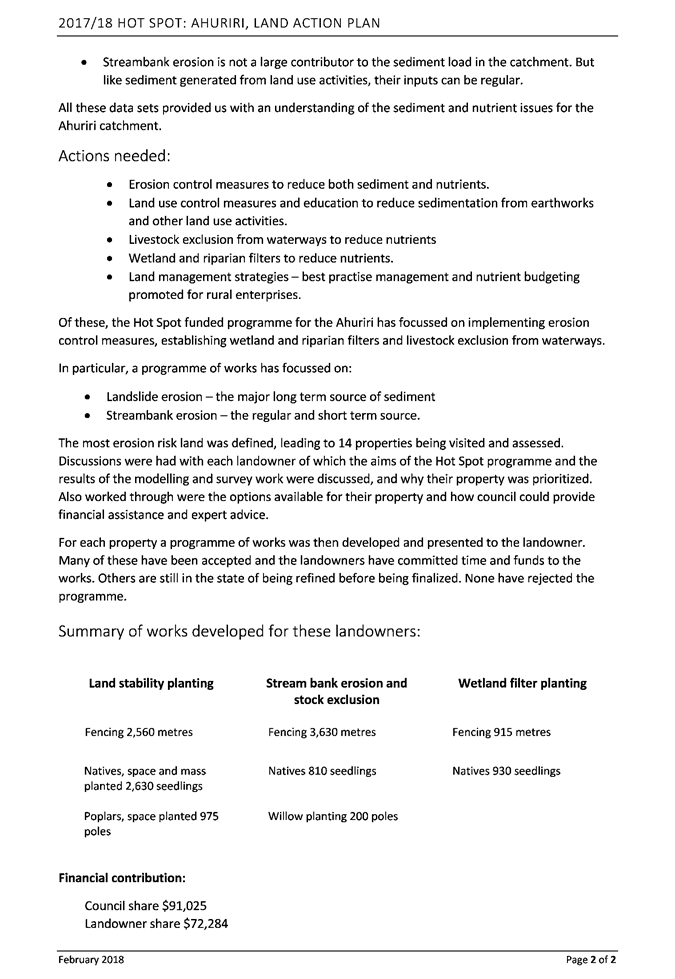
nutrient control identifies high erosion risk land within the catchment. (see summary attached).
25. Catchment
works, identified through the Ahuriri Catchment
Land Action Plan, focus on landslide erosion (the major long-term source of
sediment) and streambank erosion (the regular and short-term source). We are
implementing erosion control measures, establishing wetland and riparian
filters and livestock exclusion from waterways.
26. Catchment
Hydrology: Further research information is required
to better define the water budget, movement and export in this complex and
largely managed catchment. What are the contaminant pathways? How
much healthy freshwater does the estuary need to function. This is being
scoped.
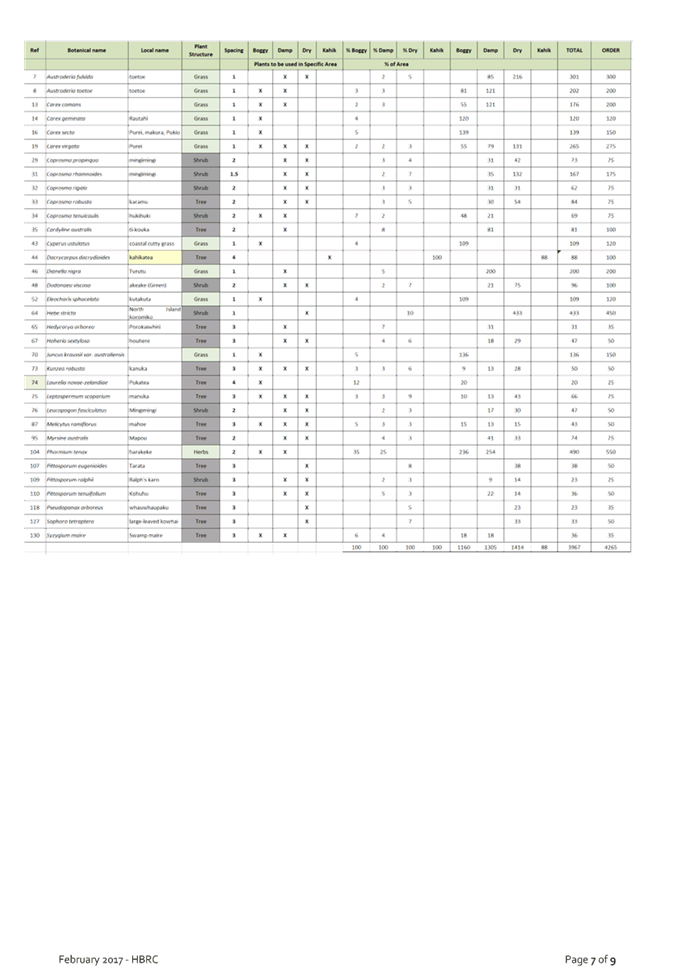
Hot Spot: Te
Karamū 2017-18
|
Karamū
Project
lead: Antony
Rewcastle
|
10,725 plants
10,700 native / 25 exotic
|
1.65 km fencing
|
Budget $150k
|
|
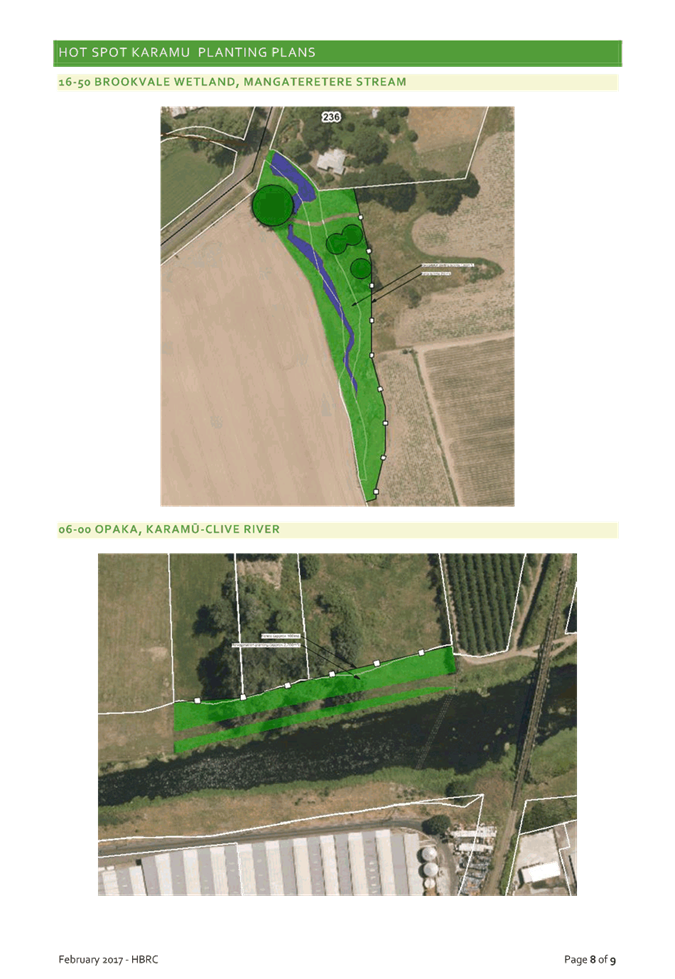
06-00
Opaka, Karamū-Clive River
|
1000
|
155m
|
$12.5k
|
|
16-50
Brookvale wetland enhancement, Mangateretere Stream
|
8000
|
500m
|
$90k
|
|
29-00
Paki Paki enhancement, Hinetemoa Springs and Awanui Stream
|
1000
|
300m
|
$12.5k
|
|
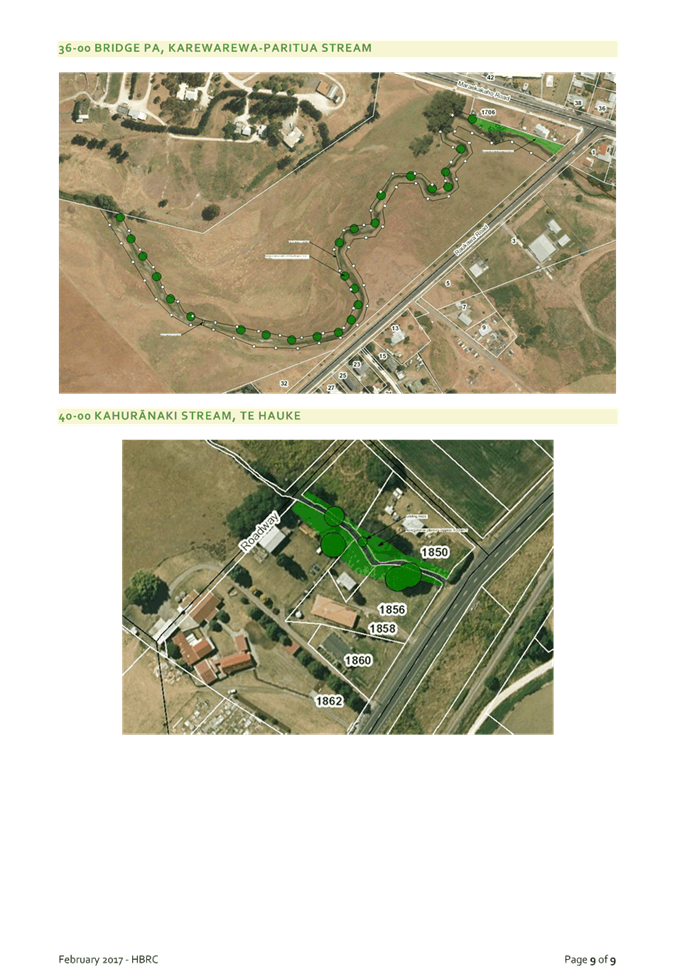
35-00
Bridge Pa fencing, Karewarewa-Paritu Stream
|
25 Weeping willows
|
700m
|
$20k
|
|
40-00
Kahurānaki (Te Hauke) Marae planting
|
700
|
-
|
$15k
|
27. Opaka,
Old Ngaruroro (Karamu-Clive) River, left bank above
Whakatu Railway Bridge. Old man’s beard control
completed. Silver poplar control in progress. Fencing for stock
exclusion and revegetation planting to be completed.
28. Brookvale
wetland – Mangateretere Stream. Protection and enhancement of the stream to exclude stock, improve
water quality, habitat and biodiversity, and demonstrate best practice land
management. Arboriculture work completed. Weed control in
progress. Fencing and revegetation planting to be completed.
29. Paki
Paki enhancement - Hinetemoa Spring, Awanui Stream. Protection and enhancement of the waterway
to exclude stock and improve water quality, habitat and biodiversity for this
culturally significant site, which is visible as the southern entrance to Heretaunga
Plains. Fencing and revegetation enhancement planting in progress.
30. Paritua/Kārewarewa
Stream enhancement, Bridge Pa. Protection and enhancement of the waterway to exclude stock and
improve water quality on the Karewarewa-Paritua Stream, above Mangaroa
Marae. Tree work to create fence alignment. Enhancement planting to
be completed.
31. Kahurānaki
(Te Hauke) Marae, Kahurānaki Stream. We will be working with
representatives from the marae to produce plans weed control, enhancement
planting on the tributary to Lake Poukawa and connection to biodiversity
priority areas.
Hot Spot: Marine
32. Work with the Hawkes Bay
Marine and Coastal Group (HBMAC) and other stakeholders to build understanding
of our coastal environment by investigating subtidal habitats and improve our
understanding of terrestrial impacts on the coastal environment by developing a
hydrodynamic model of the bay.
|
Marine
$150k
|
Project Leads
|
|
$40k Hydrodynamic model of Hawke Bay
|
Oliver Wade
|
|
$110k Collaborative study: Wairoa Hard
|
Anna Madarasz-Smith
|
33. A Collaborative study
with NIWA, MPI and hapu looking at current state Wairoa Hard. This
study will use the NIWA vessel Ikatere to undertake multibeam echo sounder to
define the extent of hard substrate and potential habitats within the
area. NIWA have committed $35k of vessel time to the study, Ministry for
Primary Industries $25k, with the remaining $100k being funded by the HBRC
Hotspot fund. This 14-day mapping study is scheduled for March/April
2018, with further work to be defined with PTSGs in the area.
34. HBRC are examining
software options for building the hydrodynamic model. Consultants
(Advisian) to the Port of Napier have used open source software (Deflt3D), and
they have offered to provide the input bathymetry files, which will save model,
build time if we decide to use Delft3D software to create the model. HBRC
currently have a test version of the Delft3D software, which we can examine the
Advisian files with. Despite being open source software, there are still
costs associated with using Delft3D, with the best support option incurs a
yearly cost of around $5,500.
35. The other option is to
purchase an add-on module to our existing MikeZero software from Danish
Hydraulic Institute (DHI). This has the advantage of continuity with
other DHI models already in use at HBRC. There is a higher upfront cost
with DHI software, however, as a regional council in New Zealand, DHI generally
offer us a 50% discount in purchase price, which puts the software cost in the
order of $35,000 plus an ongoing cost of around $7,000 per year for software upgrades
and support. It is likely, but not tested yet, that the input files
available from Advisian will be able to be converted to be used in the DHI
models.
36. Hydrodynamic model:
Once staff have decided on a model platform we need to establish:
36.1. Focus areas for the
model
36.2. Establish boundary
conditions
36.3. Develop a field sampling
plan.
37. Focus areas: Cawthron
Research Institute have been engaged to provide an initial assessment of water
quality in Hawke’s Bay. They have analysed 15 years of satellite imagery
focussing on proxies for chla, suspended sediment and sea surface temperature.
This analysis is producing maps of mean concentrations and trends over time for
these parameters, which will highlight problem areas within the Hawke’s
Bay CMA.
38. Boundary conditions are
the external forces that influence a model domain (waves; wind; currents;
nutrient loads; suspended sediment etc.). Once staff have examined existing
model platforms and the boundary conditions that have been used for these
models we will have a better idea of what is available. There are also national
level modelling initiatives being proposed that may be able to inform this.
39. Existing models use
boundary conditions that are focussed on physical parameters (wind; waves etc.).
Council staff have fostered a relationship with GNS and NIWA where they are
collecting offshore water samples for us during scientific cruises to begin to
inform understanding of the chemistry of the oceanic currents that influence
Hawke’s Bay waters.
40. Once staff have received
the offshore water quality analysis; the Cawthron satellite imagery analysis
and had a chance to evaluate existing hydrodynamic models of the bay. A
workshop will be held to develop a focussed sampling plan moving forward to inform
the development of a hydrodynamic model.
Decision Making
Process
41. Staff have assessed the
requirements of the Local Government Act 2002 in relation to this item and have
concluded that, as this report is for information only, the decision-making provisions
do not apply.
|
Recommendation
That the Environment and Services
Committee receives and notes the “February 2018
Hotspot/Freshwater Improvement Funding Projects Update” staff
report.
|
Authored by:
|
Te Kaha
Hawaikirangi
Environmental Officer
|
Dr Andy Hicks
Team Leader/Principal Scientist - Water
Quality and Ecology
|
|
Anna
Madarasz-Smith
Senior Scientist - Coastal Quality
|
Peter Manson
Senior Land Management Advisor
|
|
Antony
Rewcastle
Senior Open Space Development Officer
|
Jolene
Townshend
Project Manager, Resource Management
|
Approved by:
|
Iain Maxwell
Group Manager Resource Management
|
|
Attachment/s
|
⇩1
|
Summary for
Ahuriri Catchment Action Plan
|
|
|
|
⇩2
|
Hot Spot
Karamu and Tukituki Planting Plans 2018
|
|
|
|
Summary
for Ahuriri Catchment Action Plan
|
Attachment 1
|
|
Hot Spot Karamu and
Tukituki Planting Plans 2018
|
Attachment 2
|
HAWKE’S BAY REGIONAL COUNCIL
Environment
and Services Committee
Wednesday 21 February 2018
Subject: Six Monthly Public
Transport Update
Reason
for Report
1. This report provides the Committee with an update on Council’s
public transport operations.
Napier-Hastings
Bus Service General Information
2. Napier Library has shifted to the MTG building. As many of our bus
passengers use the library, we have worked with Napier City Council to
establish a new bus stop near the library entrance and to publicise how to
transfer from other routes for free, in order to access the library. The change
seems to have run smoothly, with no complaints from passengers.
3. At the request of residents in Summerset Napier (in Greenmeadows),
we are trialing the extension of Route 13 services to service the retirement
village between 9am and 3pm. An informal bus stop has been established by
Napier City Council, and patronage has been very encouraging. As the
extension only operates off-peak, it adds little extra distance and is at
minimal cost.
4. Bus services between Napier and Hastings continue to struggle with
keeping to time due to roadworks and peak-time congestion in Hastings. This is
an issue that may need a permanent solution, so we will investigate this
through the review of the Regional Public Transport Plan. During February and
March we place an extra bus into the fleet to run some overload services and
help keep the scheduled services running to time.
5. As school children are a significant passenger group, we are running
a campaign during February on how to get to school by GoBay bus service. Fliers
are available on our website outlining the best services to take to each of the
secondary schools from various parts of Hawke’s Bay, and this has been
accompanied by radio advertising and Facebook posts.
District
Health Board Travel Scheme
6. Following the success of its trial staff bus
discount scheme, the District Health Board (DHB) has now further discounted
fares for its staff in order to encourage travel behaviour change and reduce parking
pressure at the hospital. This change took place on 1 February 2018 and
we are hopeful that there will be a further increase on the approximately 500
staff trips taken each month. The patient travel scheme continues
to be very successful, with a 100% increase in bus use over the last year.
New
Bus Ticketing System
7. We are entering the final stages of
implementation of a new bus ticketing system, as part of a consortium of nine
regional councils. The new system will replace an ageing system with
ticketing machines that are past the end of their useful lives, frequently
break down and provide limited information.
8. The new system will provide accurate information
about origin and destination of passengers. Customers will be able to top up
smartcards online and this will considerably reduce the amount of cash carried
on the buses. Eligibility for concession fares will be determined when
smartcards are issued, removing the need for the driver to check eligibility
each time the concession passenger travels, thereby improving loading times.
9. The changes will require a significant lead-in
time with plenty of public information, to ensure that passengers are able to
transition easily to the new system. As our system will not go live until 6
August and after six other councils, there will be time to learn from any
unanticipated issues experienced by the other regions.
Review of Regional Public Transport Plan
10. We have commenced reviewing the Regional Public
Transport Plan with a review of requests received for new public transport
services or improvements. Issues such as late running on the Route 12 services
and some minor policy changes will also be considered, and a revised draft will
be brought to Council for consideration.
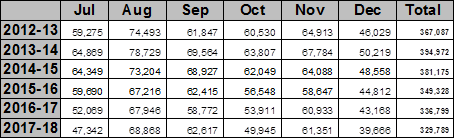
Bus Passenger Trips
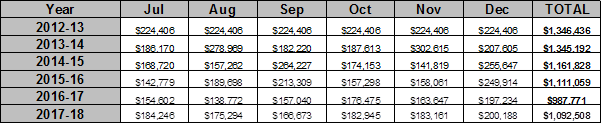
11. Diagram 1
shows monthly bus passenger trips for the years 2012-13 to 2017-18. Bus numbers
are down by 2% for the year to date. Decreases are noticeable on
11.1. Route
12 (Napier–Hastings-Napier via EIT and Pakowhai). These are the services
which are struggling to keep to time.
11.2. Route
14 ( Napier- Maraenui- Onekawa-Napier)
11.3. Route
15 ( Napier –Westshore-Bayview-Napier )
11.4. Route
20 ( Hastings-Flaxmere-Hastings)
11.5. Route
21 ( Hastings-Havelock Nth –Hastings)
12. However,
some services are growing well. There are significant increases in patronage on
12.1. Route
10 – Express service Napier-Hastings via Taradale (40% increase on last
year)
12.2. Route
11 - Express Havelock North—Napier via Hastings and Clive (22% increase).
12.3. Route
16a (Hastings-Camberley-Raureka)
12.4. Route
13 – Napier- Tamatea- Taradale
12.5. Route
17 – Hastings-Parkvale-Akina
Diagram 1
– Monthly Passenger Trips to December 2012-13 to 2017-18
Bus Service Costs
13. The
following diagram shows the net cost (after fares and excluding GST) of
operating the goBay bus service for the six months to December for 2012-13 to
2017-18.
Diagram 3 – Six Month Net Cost (ex GST)
51% of this
cost is met by the New Zealand Transport Agency).
14. We are
now into the second year of operating the new contract with GoBus. Although
still well within budget, indexation payments and lower fare revenue are
responsible for the increase in net cost for the year to date. We are now
paying about 2.5% of the gross contract cost in indexation each quarter, mainly
due to labour and fuel cost increases.
Fare Recovery
15. Fare
recovery is the portion of the total cost of the service that is covered by
fares (including SuperGold payments from central government). The fare recovery
rate is affected by the cost of the contract, including indexation, and the
amount of revenue received from passengers and other sources.
Diagram 4– Fare Recovery Rate –
2012-13 to 2017-18.
|
2012-13
|
34.26%
|
|
2013-14
|
38.24%
|
|
2014-15
|
38.94%
|
|
2015-16
|
37.78%
|
|
2016-17
|
38.49%
|
|
2017-18
|
37.51% (YTD)
|
Total
Mobility
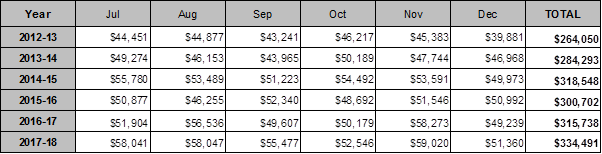
16. The
following tables compare the number of Total Mobility(TM) trips made for the
year to date over the last five years, and the corresponding costs (excl. GST).
17. The
number of TM trips taken for the year to date is fairly consistent with last
year and showing a longer-term trend for growth. This is to be expected,
as our population is not only increasing but also ageing at a faster rate than
previously predicted.
Diagram 5 – Number of Total Mobility
Trips to December for 2012-13 to 2017-18
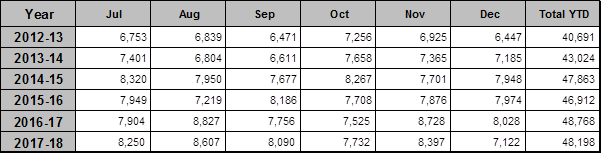
Diagram 6 – Total Mobility Cost ($
excl GST) 2012-13 to 2017-18
(60% of this cost is met by the New Zealand Transport Agency)
|
Recommendation
That the Environment and Services Committee receives and notes the
‘Six Monthly Public Transport Update’ staff report
|
Authored by:
|
Anne
Redgrave
Transport Manager
|
|
Approved by:
|
Liz Lambert
Group Manager External Relations
|
|
Attachment/s
HAWKE’S BAY REGIONAL
COUNCIL
Environment
and Services Committee
Wednesday 21 February 2018
Subject: February 2018
Operational Activities Update
Reason for Report
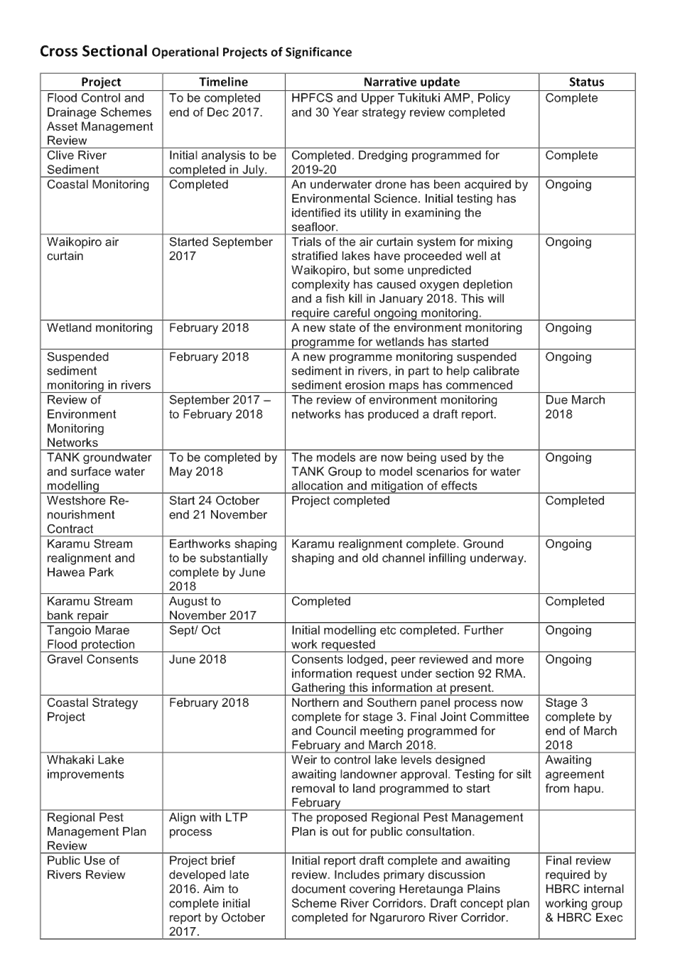
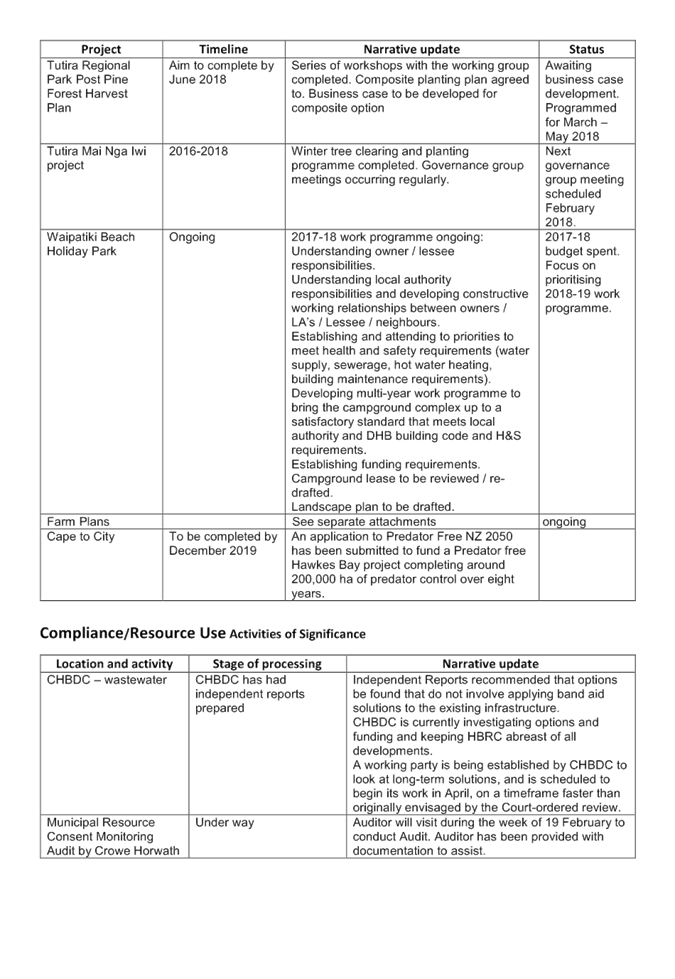
1. To provide an update (attached) on the activities of Council’s
Regulation and Operations teams to the Environment and Services Committee.
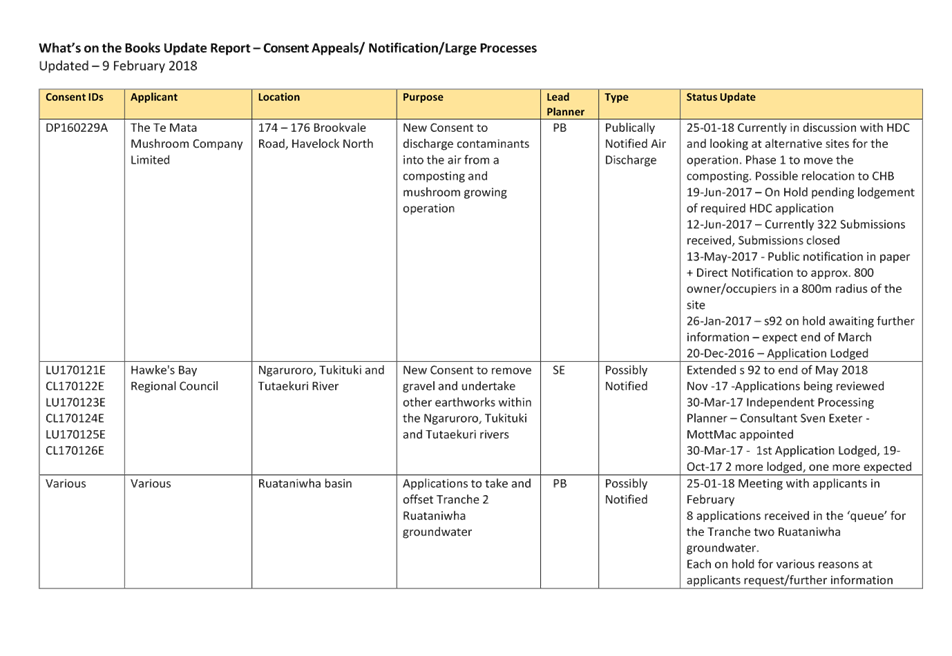
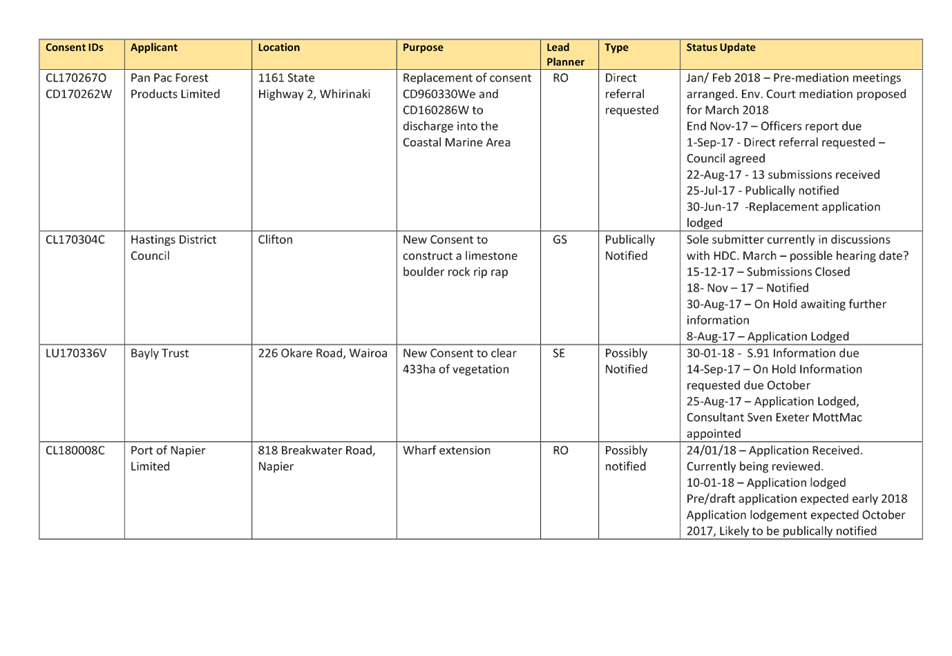
2. There are two parts to the information provided on resource consent
matters.
2.1. The first shows the current significant consents that are at various
processing stages.
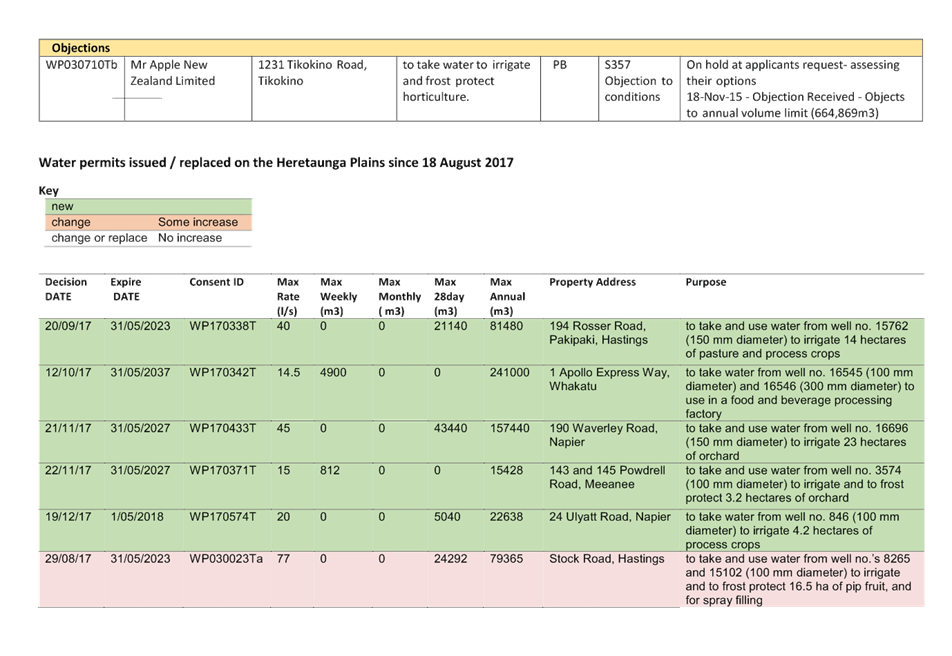
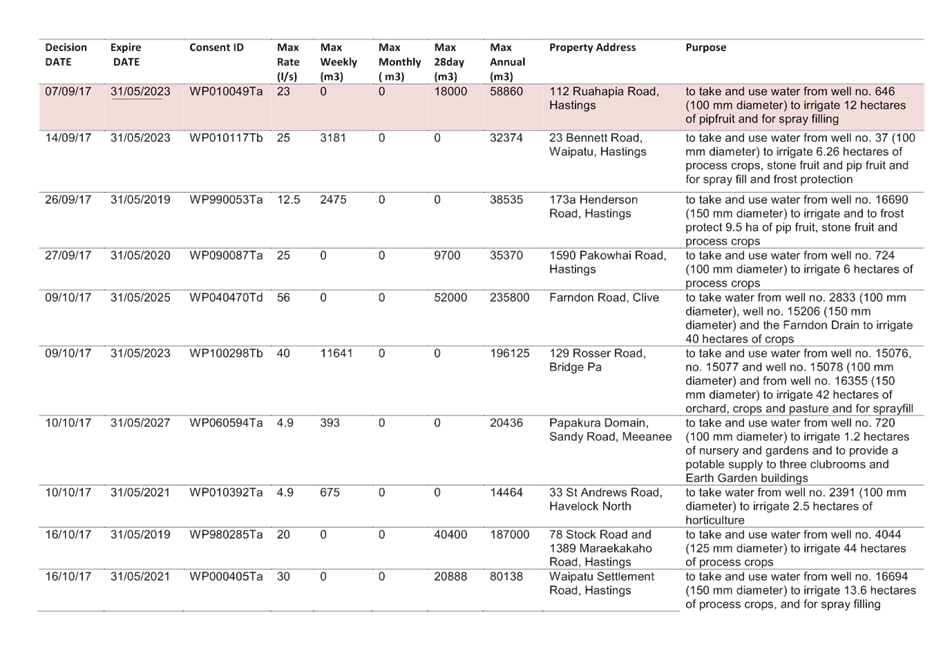
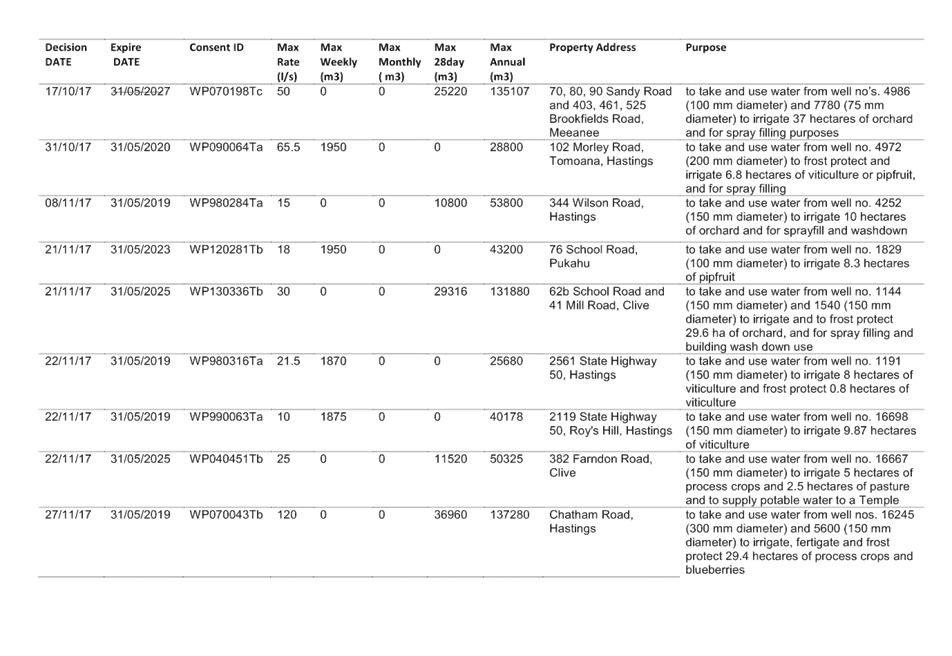
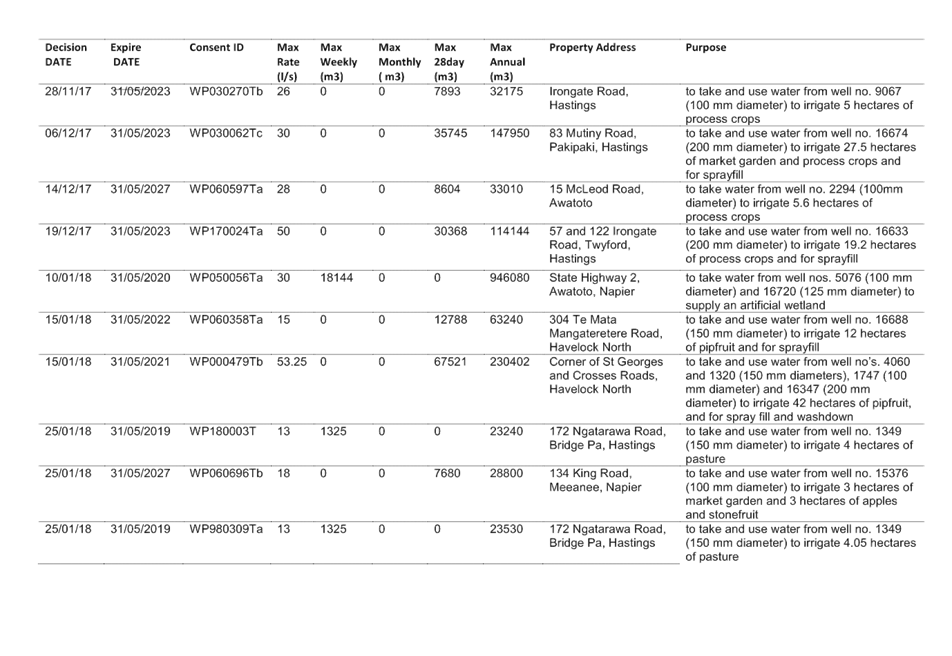
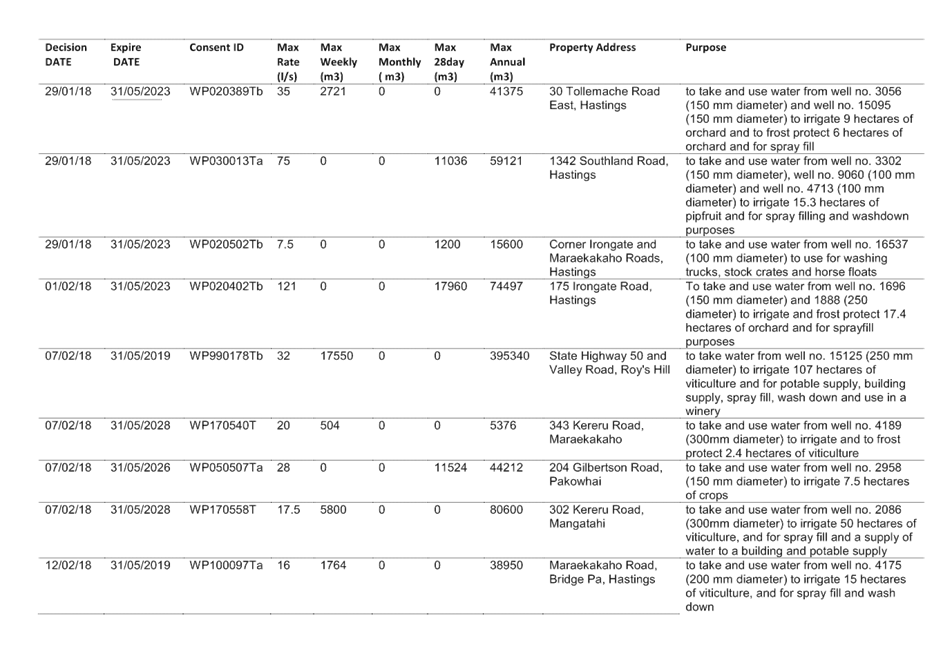
2.2. The second provides a list of water permits that have been
issued/replaced across the Heretaunga Plains since 18 August 2017. This was the
effective date of the interim management approach set at the 13 September 2017
E&S Committee meeting.
2.2.1. Five new
water permits have been issued, another two have been issued with changes
increasing the amount of water allocated. In the case of the five new consents
these were all considered to fall within the guidance provided by Council in 10
and 11 of the Council resolution. That is, they were received by Council prior
to 18 August 2018 or were subject to discussions with Council prior to this
date and which the applicant demonstrated has involved a reasonable capital or
tangible investment.
2.2.2. In the case
of the two changes, these involved increases in the 28 day volumes and the
fixing of annual volumes where these did not exist before.
2.2.3. The
remaining 39 water permits are changes or replacements which involve no
increase in water.
2.2.4. The total
extra water allocated amounts to 517,986 m³/yr. We are aware of at least
three more new resource consent applications in process or to be lodged in the
future.
Decision Making
Process
3. Staff have
assessed the requirements of the Local Government Act 2002 in relation to this
item and have concluded that, as this report is for information only, the
decision making provisions do not apply.
|
Recommendation
That the Environment & Services
Committee receives the “Operational Activities Update”
staff report.
|
Authored by:
|
Gary Clode
Manager Regional Assets
|
Malcolm
Miller
Manager Consents
|
|
Dr Stephen
Swabey
Manager Science
|
Wayne Wright
Manager Resource Use
|
Approved by:
|
Graeme Hansen
Group Manager Asset Management
|
Liz Lambert
Group Manager External Relations
|
|
Iain Maxwell
Group Manager Resource Management
|
|
Attachment/s
|
⇩1
|
February 2018
Operational Activities Update
|
|
|
|
⇩2
|
February 2018
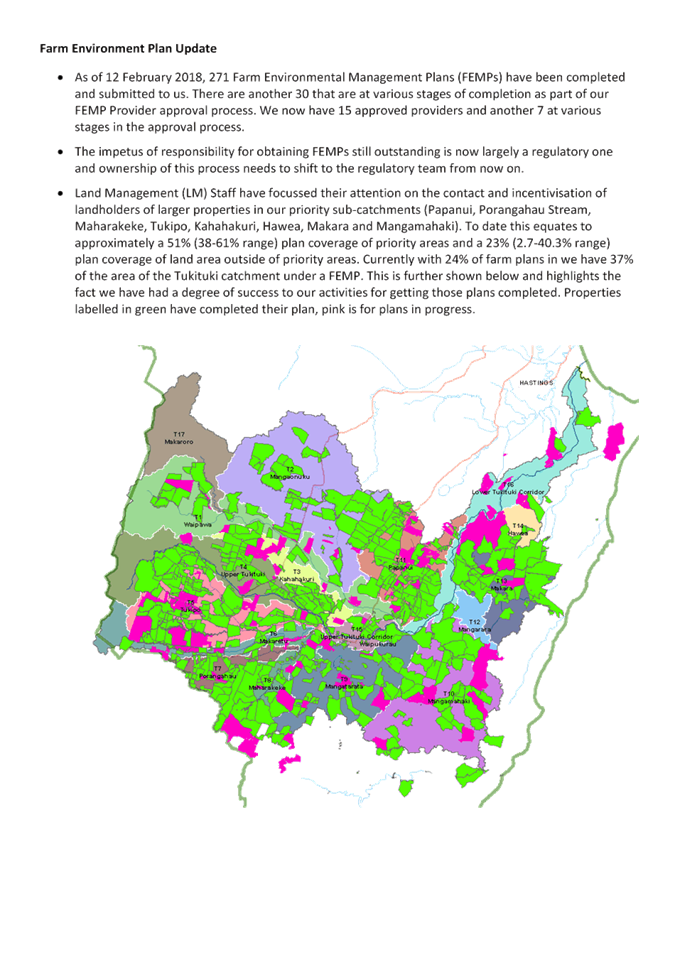
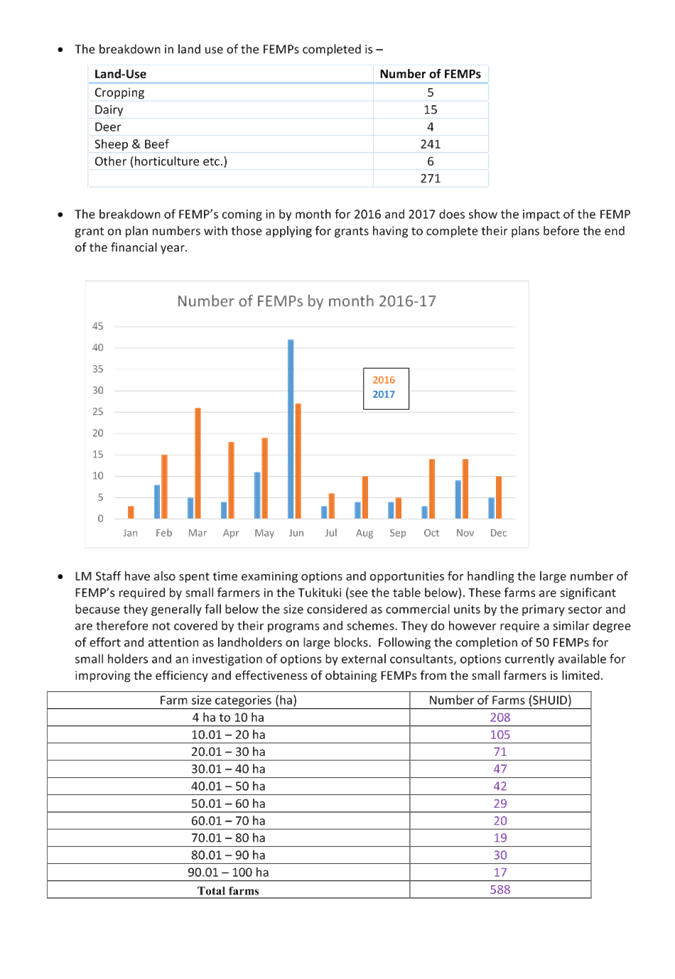
Farm Environmental Plans Update
|
|
|
|
February
2018 Operational Activities Update
|
Attachment 1
|
|
February
2018 Operational Activities Update
|
Attachment 1
|
|
February
2018 Farm Environmental Plans Update
|
Attachment 2
|
HAWKE’S BAY REGIONAL COUNCIL
Environment
and Services Committee
Wednesday 21 February 2018
Subject: Discussion of Items Not
on the Agenda
Reason for Report
1. This document has been prepared to assist
Committee Members to note the Items of Business Not on
the Agenda to be discussed as determined earlier in Agenda
Item 5.
1.1. Urgent items of Business (supported by tabled CE or Chairman’s
report)
|
|
Item
Name
|
Reason not on Agenda
|
Reason discussion cannot be delayed
|
|
1.
|
|
|
|
|
2.
|
|
|
|
1.2. Minor items (for discussion only)
|
Item
|
Topic
|
Councillor
/ Staff
|
|
1.
|
|
|
|
2.
|
|
|
|
3.
|
|
|