Meeting of the Environment and Services Committee
Date: Wednesday 8 October 2014
Time: 9.00am
|
Venue:
|
Council Chamber
Hawke's Bay Regional Council
159 Dalton Street
NAPIER
|
Attachments
Excluded From Agenda
item subject page
9. Recreational
Water Quality Report: Review of the 2013-14 Season
Attachment 1: Recreational
Water Quality Report: Review of the 2013-14 Season 3
|
Recreational
Water Quality Report: Review of the 2013-14 Season
|
Attachment 1
|
Hawke’s Bay Recreational Water
Quality Report
A
review of the 2013-2014 Season
HBRC Report No. RM 14-04
Environmental
Science - Water Quality and Ecology
Hawke’s Bay
Recreational Water Quality
A
review of the 2013-2014 Season
June 2014
HBRC Report No: 14-04. HBRC Plan No.
4613
 …………………………………………………………………….
|
Recreational
Water Quality Report: Review of the 2013-14 Season
|
Attachment 1
|
Contents
1 Introduction........................................................................................................................ 2
1.1 Legislative
responsibility............................................................................................. 2
1.2 Faecal Indicator
Bacteria............................................................................................. 2
1.3 Guidelines.................................................................................................................. 2
1.4 Annapolis Protocol and
Beach Grading........................................................................ 2
2 Recommendations from
2012/2013 and actions.................................................................... 2
3 Methodology...................................................................................................................... 2
3.1 Sampling.................................................................................................................... 2
3.2 Sampling sites............................................................................................................ 2
3.3 Data analysis.............................................................................................................. 2
3.4 Suitability for
Recreation Grade.................................................................................. 2
3.5 Faecal Source Tracking................................................................................................ 2
4 Results................................................................................................................................ 2
4.1 Northern Region........................................................................................................ 2
4.2 Central Region............................................................................................................ 2
4.3 Southern Region........................................................................................................ 2
5 Shellfish gathering
sites...................................................................................................... 2
6 Conclusions......................................................................................................................... 2
6.1 Contact Recreational Use............................................................................................ 2
6.2 Beach Grades for
Hawke’s Bay Recreational Sites........................................................ 2
6.3 Shellfish sites............................................................................................................. 2
7 Further work....................................................................................................................... 2
7.1 Northern Region........................................................................................................ 2
7.2 Central Region............................................................................................................ 2
7.3 Southern Region........................................................................................................ 2
8 Acknowledgements............................................................................................................. 2
9 References.......................................................................................................................... 2
10 Appendix A: SFRG Table and
explanation of changes................. Error! Bookmark not
defined.
Tables
Table‑1-1: Water quality guideline
values and indicator organisms used to assess marine and freshwater
recreational areas (MfE and MoH, 2003). 2
Table 6‑2:
Summary of sites with significant trends following the 2013/14
season.
58
Figures
Figure 1: Hawke's Bay recreational
monitoring sites. 2
Figure‑5-1: Shellfish monitoring
sites in Hawke's Bay and levels of compliance. 2
|
Recreational
Water Quality Report: Review of the 2013-14 Season
|
Attachment 1
|
Executive summary
The
Recreational Water Quality Monitoring is an annual summer programme undertaken
by Hawke’s Bay Regional Council in conjunction with the Public Health
Unit of the Hawke’s Bay District Health board and Territorial Local
Authorities. During the 2013/2014 season (November to March), the
microbiological water quality of 36 popular bathing areas was assessed.
Water samples collected at these sites were analysed on a weekly basis for
faecal indicator (Enterococci and/or Escherichia coli)
contamination. The results were compared with the Ministry for the
Environment (MfE) and Ministry of Health (MoH) Microbiological Water Quality
Guidelines (2003). Trends in water quality over time were also analysed.
The sites
were as follows:
§ Fifteen marine sites (Enterococci)
§ Five freshwater rivers (Escherichia
coli)
§ Twelve estuarine/lagoon/tidal
freshwater sites (Enterococci, Escherichia coli)
§ One freshwater lake (Escherichia
coli)
§ Eight estuarine/coastal sites for
shellfish gathering (Faecal coliforms)
All sites
were monitored on a weekly basis (except for Clive River and Puhokio Stream
which were monitored fortnightly) to assess their suitability for contact
recreation and shellfish gathering.
Fourteen of
the fifteen marine sites achieved 100% compliance with national guidelines,
which is defined as when two consecutive samples collected within 24 hours fall
within guideline values. This indicates that most coastal beaches are
suitable for contact recreation most - if not all - of the time. Opoutama
Beach did not comply with national guidelines on two occasions, probably due to
heavy rainfall within the catchment. Faecal source tracking was
undertaken to assess the potential sources of these contaminants, which were
ruminant faeces in this instance.
Three of
the five river sites achieved 100% compliance with guidelines. These were
the Ngaruroro, Tutaekuri, and Tukituki at Walker Rd Rivers.
This season
eight of the twelve estuarine sites were tested for both Escherichia coli (E. coli) and
enterococci to ensure the most appropriate indicator bacteria were used to
inform public health risk. Selection of the appropriate indicator
organism was determined by the salinity of the water at the time of sampling.
The Maraetotara and Clive Rivers were 100% compliant with national guidelines for
E. coli. Pandora Pond achieved 100% compliance with national
guidelines for enterococci.
Lake Tutira
exceeded the guideline values three times during the season, which were
associated with heavy rainfall within the catchment.
Three of
the eight shellfish gathering sites monitored in Hawke’s Bay were 100%
compliant with MfE and MoH guideline values, while the remaining five sites
failed to comply with one or both of the requirements.
|
Recreational
Water Quality Report: Review of the 2013-14 Season
|
Attachment 1
|
1 Introduction
Hawke’s
Bay’s coastal waters, freshwater lakes and rivers are frequently used for
a range of recreational activities. However, the suitability of these
areas for contact recreation can be compromised through contamination by human
and animal faecal matter, which may carry harmful, illness-causing pathogens.
To monitor
the risk associated with contact recreation, Hawke’s Bay Regional Council
(HBRC) undertake an annual Recreational Water Quality Monitoring Programme in
collaboration with Territorial Local Authorities (TLAs) and the Public Health
Unit of the Hawke’s Bay District Health Board (PHU). Monitoring is
carried out at several sites throughout the region to assess the
microbiological water quality of areas commonly used for contact recreation.
The results are then compared to Ministry for the Environment (MfE) and
Ministry of Health (MoH) guidelines (2003).
The aims of
the programme are to:
§ Determine the suitability of the
coastal, estuarine and freshwater sites for recreational use;
§ Assist in safeguarding public health
and the environment;
§ Compare current water quality with
that of previous seasons;
§ Provide a baseline for future
research;
§ Identify problems and target
investigations to those areas requiring mitigation, remediation or further
research and development.
1.1 Legislative responsibility
Two main
sources of legislation define the monitoring required to assess the water
quality of areas used for contact recreation, the Resource Management Act
(1991) and the Health Act (1956). The responsibility for overseeing these Acts
is shared between Regional Councils, TLAs and the District Health Boards
(DHBs). The document ‘Microbiological Water Quality Guidelines for
Marine and Freshwater Recreational Areas’, MfE and MoH (2003) outlines
how duties may be shared between the agencies involved.
Hawke’s
Bay Regional Council has taken responsibility for the monitoring, and
undertakes all routine monitoring and the facilitation of follow-up sampling
when necessary. The TLAs have responsibility for erecting warning signs
and undertaking sanitary surveys when requested by the PHU. The PHU,
through its health protection officers and Medical Officer of Health, have
responsibility for informing the public; usually through a press release and or
location signage when an exceedance of the guidelines has occurred.
Updated results are also available from the B4U Swim line, and the HBRC
website.
1.2 Faecal Indicator Bacteria
The most common
illnesses associated with swimming include gastroenteritis, respiratory
illnesses, and skin and ear infections. These illnesses can be caused by
a wide range of pathogenic organisms including viruses, bacteria and protozoan
species – these include Salmonella, Campylobacter,
Cryptosporidium, and Giardia (MfE and MoH (2003)). It is not
feasible to analyse water samples for these pathogenic organisms. However,
these pathogens are associated with enterococci and Escherichia coli
(E. coli) bacteria that are specific to the gut of warm-blooded animals.
Measurement of the concentration of these indicator bacteria gives an
indication of the health risk associated with contact recreation arising from
pathogenic organisms.
Samples were analysed
for the indicator bacteria enterococci at marine sites. This is because its
survival rate in saline waters is higher than for E. coli, providing a
better indication of actual bacterial levels and therefore the potential
risk. Samples
collected at freshwater sites were analysed for the indicator bacteria E.
coli. At estuarine
or freshwater sites subject to tidal influences, dual testing of indicator
bacteria was undertaken. This ensured that the indicator organism
appropriately indicated the risk of adverse health effects. Where electrical
conductivity readings indicated a freshwater environment (<10,000
µS/cm), the laboratory analysis was conducted for E. coli only,
otherwise both E. coli and enterococci levels were measured.
1.3 Guidelines
All sampling and
evaluation of results was undertaken in accordance with the
‘Microbiological Water Quality Guidelines for Marine and Freshwater
Recreational Areas 2003’ (MfE and MoH). (Table 1-1).
Table‑1-1: Water
quality guideline values and indicator organisms used to assess marine and
freshwater recreational areas (MfE and MoH, 2003).
|
|
Marine Water
|
Freshwater
|
Shellfish
gathering waters
|
|
Response Level
|
Enterococci
CFU/100 mL
|
E.
coli
CFU/100 mL
|
Faecal coliforms
CFU/100 mL
|
|
|
Single Sample
|
Single sample
|
(over season)
|
|
Surveillance/Green Mode
|
<140
|
<260
|
|
|
Alert/Amber Mode
|
140 -
280
|
260 -
550
|
|
|
Action/Red Mode
|
>280*
|
>550
|
|
|
Seasons results
|
|
|
Median
concentration < 14/100 mL and 90% of samples < 43/100 mL
|
CFU = Colony forming units on an agar
plate.
§ Note:
Two consecutive samples taken within 24 hrs exceeding 280 enterococci/100 mL
are required before action mode is initiated.
When water
quality falls within the limits of the ‘surveillance mode’ (the
‘Green’ mode), the risk of contracting an illness from bathing is
considered acceptable (MfE and MoH, 2003). If the water quality falls
into the ‘Alert/Amber’ category (the ‘Amber’ mode)
there is an increased risk of illness, but this risk is also considered
acceptable. This result signals to agencies a requirement to conduct follow up
sampling of the site to determine whether contamination levels have increased
to the ‘Action/Red’ level (the ‘Red’ mode).
If levels
of bacteria exceed the levels set out in the ‘Action/Red’ mode,
then contact recreation in the water is deemed to pose an unacceptable health
risk. At this stage the PHU informs the public of the elevated risk of
illness through sign-posting, media releases and/or phone or website.
While
freshwater exceedances are assessed for compliance on the result of a single
sample, the guidelines require two samples taken within 24 hours to exceed the
action level of 280 enterococci CFU/100mL for marine waters. For the
purposes of this report we have reported on both:
§ The strict two consecutive sample exceedance protocol;
and
§ Single sample exceedances.
It is
important to note that health-based risk communication generally adopts a
precautionary approach which aims to protect the most vulnerable members of the
public.
The
recreational shellfish-gathering microbiological guideline values are also
obtained from the MfE and MoH Guidelines (2003, section: F). The guidelines
state that:
§ the
season median faecal coliform concentration should not exceed 14 cfu/100
mL, and that
§ no
more than 10% of samples per season should exceed 43 cfu/100 mL.
1.4 Annapolis Protocol and Beach Grading
The MfE and
MoH guidelines (2003) use risk-based management of recreational waters.
This is done by combining 1) an assessment of the potential inputs of adjacent
land use and contaminated water to a site with 2) an assessment of the
historical monitoring results (5 years) from the site to generate 3) a
‘Suitability for Recreation Grade’ (SFRG). These grades are
described with site specific information in Section 4. They may be used
to advise the public of the sites most suitable for swimming and other
recreational activities.
2 Recommendations
from 2012/2013 and actions
1. Signage
could be more descriptive and used when exceedances are present; details on the
signs to raise awareness of the monitoring programme and background details on
what the bacteriological results mean and how that influences human
health.
a. Action:
Hawke’s Bay Regional Council and the Public Health Unit have erected a
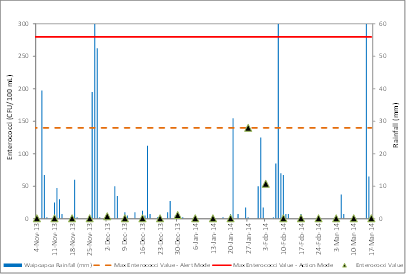
new sign at Clive River, and used an informative layout at Waipatiki Lagoon in
2014. More signage design work is underway for the all exceedances.
2. Faecal
sterol analyses to be undertaken at Waipatiki Beach, Puhokio Stream and Clive
River, or any other problematic sites during the next season when an
opportunity arises, even if rainfall has contributed to the exceedance.
a. Action:
Faecal sterol analysis and PCR analysis undertaken at Waipatiki Beach, Waipuka
Stream, Opoutama Beach (see results section).
3. Better
dissemination of data to public through the website functionality.
a. Action:
HBRC is working on a fully rebuilt map and site structure for the 2014/15
season.
3 Methodology
3.1 Sampling
Thirty-six
sites within Hawke’s Bay were sampled during the 2013/2014 season. These
sites are commonly used for recreational purposes that include swimming, water
skiing, rowing, diving, fishing, surfing and shellfish gathering.
Sampling of
these sites was undertaken on a weekly basis with the exception of the Clive
River and Puhokio Stream sites, which were sampled fortnightly as they have a
history of persistently poor water quality and are permanently
signposted. Due to a ‘Very Poor’ grading, contact recreation
at these sites is discouraged and permanent signs have been erected.
Sampling
was scheduled for Monday of each week for a twenty week period over the summer
season between November and March. Samples were collected and stored in
accordance with the sampling procedures outlined in sections D2 and E2 of the
MfE and MoH guidelines (2003) until laboratory analysis. Associated
environmental information was collected for each site at the time of sampling,
including temperature, turbidity, electrical conductivity and the number of
people present.
When sample
results exceeded guideline values for freshwater sites, the rainfall data for
that particular catchment was reviewed. If cumulative rainfall >8 mm was
recorded at any of the catchment rainfall station(s) over the preceding 72 hour
period, then the exceedance was deemed rainfall related and follow up sampling
was not required. Research has shown that bacterial levels return to green mode
levels within three days following heavy rain (Stansfield, 2002). Where
exceedances were not related to rainfall (<8 mm/72hrs), follow up sampling
was conducted. Follow up sampling was conducted for all exceedances in
marine waters, regardless of antecedent rainfall in accordance with MfE and MoH
guidelines (2003).
The results of the
sampling programme are available from the PHU ‘0800 B4U Swim’
telephone line and the ‘B4U Swim’ tab on the HBRC website.
3.2 Sampling sites
Sites
monitored under this programme are selected according to several
criteria. Each site is either:
§ A
popular recreational site;
§ An
area classified as ‘Contact Recreation’ under the Regional Coastal
Environmental Plan (HBRC, 2008);
§ A
site that will provide information useful when determining the state of the
environment;
§ A
site that will provide data useful for identify trends in coastal, estuarine
and fresh water quality; or
§ A
site selected in co-operation with the TLAs and the PHU.
Most of these sites
are used most heavily over a 2-6 week period around Christmas and New
Year. During this period, the size of the adjacent communities can
increase by several orders of magnitude, leading to associated water quality
issues resulting from overloaded septic tanks.
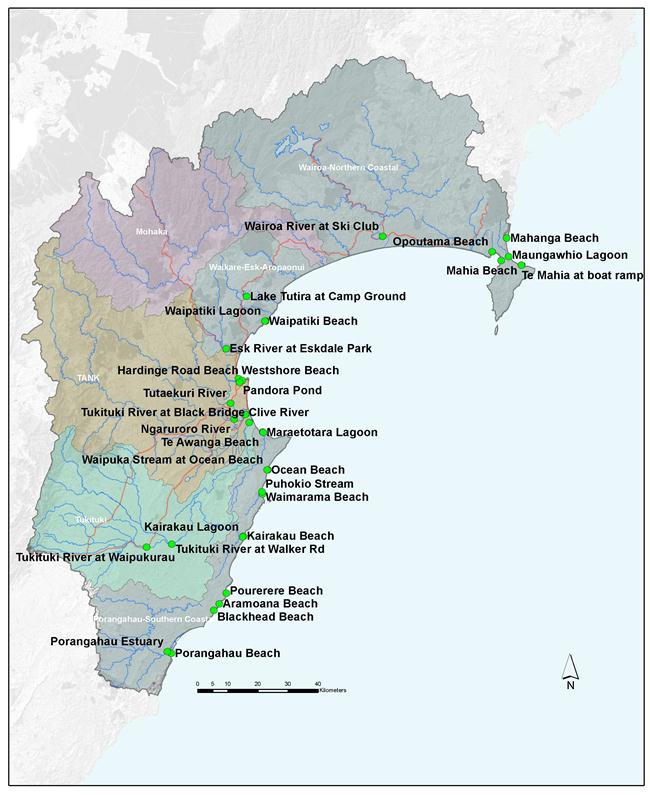
Figure
1: Hawke's Bay recreational
monitoring sites.
3.3 Data analysis
The data derived
from the previous seasons’ monitoring were analysed to identify
significant trends over time. Although
observed bacteria levels may be affected by short-lived flow or weather events,
the record is sufficiently long that these events do not significantly affect
the long-term average.
Data from
all the previous seasons were collated and any follow up samples removed from
the dataset. Temporal trend analysis (Mann-Kendal) was carried out using
NIWA’s water quality trends software (Time Trends).
Test results
were considered significant if they met both of the following criteria:
§ The
results were significant at 95% confidence level; and
§ The
slope of the line indicated a change greater than 1%/yr in the variable
concerned.
3.4 Suitability for Recreation Grade
The Suitability for
Recreation Grade (SFRG) describes the general water quality of a site by
combining monitoring data (the Microbial Assessment Category (MAC)) with a
catchment risk assessment (the Sanitary Inspection Category (SIC)), to produce
is a grade which indicates the general state of water quality at the
site.
The SFRG grade
descriptions can be used to indicate how suitable a site is for contact
recreation, as follows [see also MfE & MoH, 2003]:
Very Good – the site has generally
excellent microbial water quality and very few potential sources of faecal
pollution exist. Water is considered suitable for contact recreation almost all
of the time.
Good – the site has water quality
considered suitable for contact recreation most of the time. Swimming should be
avoided during or following heavy rain.
Fair – the site has water quality
generally suitable for contact recreation, but because significant sources of
faecal contamination exist, extra care should be taken to avoid swimming during
or following rainfall or if signs of pollution, such as discoloured water,
odour, or debris in the water exist.
Poor – the site is susceptible to
faecal pollution and microbial water quality is not always suitable for contact
recreation. During dry weather conditions, ensure that the swimming location is
free of signs of pollution, such as discoloured water, odour or debris in the
water, and avoid swimming at all times during and for up to three days
following rainfall.
Very Poor – the site is very
susceptible to faecal pollution and the microbial water quality may often be
unsuitable for contact recreation. Swimming at these sites is not recommended.
Follow-Up
– a
conflict exists between the bacterial levels observed in the MAC, and the risk
outlined in the SIC which requires further work e.g. the catchment risk based
on the SIC appears low, however the 95% percentile of the observed bacteria
levels is high, or the catchment risk is assessed as high but the 95th%
percentile of the observed bacterial levels is low.
3.5 Faecal Source Tracking
In the 2013/2014
season, two sites; Opoutama Beach and Waipuka Stream at Ocean Beach were
selected for further investigation based on high readings of faecal indicator
bacteria. Additional samples were collected from Opoutama Beach and
Waipuka Stream and sent to Environmental Science and Research (ESR) for Faecal
Sterol and Polymerase Chain Reaction (PCR) analyses.
4 Results
4.1 Northern Region
|
Mahanga Beach
|
|
|
|
Mahanga
Beach lies on the north-eastern side of the Mahia Peninsula. There is a
small resident population and several holiday baches, however the area is
currently expanding, with subdivision occurring inland toward Kaiwaitau
Road. At present, the settlement is serviced solely by septic
tanks. One public toilet exists.
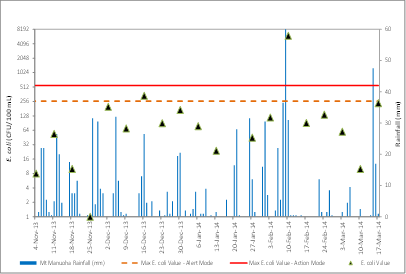
Season summary
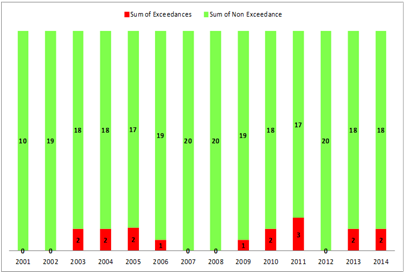
Mahanga
Beach was sampled 20 times this season with 100% of samples in green mode
(see Table 1.1).
|
|
Description
of recreation value
Mahanga Beach is a fine grain sand beach
with associated dune system. The beach is commonly used for swimming,
surfing, fishing and picnicking.
Trend in recreational water quality over
time
There has been no significant change in
water quality at this site.
The SFRG for this site was upgraded this
season from ‘Fair’ to ‘Good’.
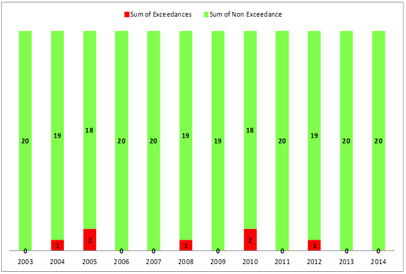
Previous seasons have seen spikes in
indicator bacteria (mostly to alert rather than action levels). Work is
programmed to identify the sources of elevated bacteria concentrations should
these conditions arise again (see 7.1).
|
|
|

|
|
|
Good
|
Historical
Exceedances
|
|
Mahia Beach
|
|
|
|
Mahia
Beach is a small settlement on the north-western side of Mahia Peninsula.
The population of this settlement increases markedly in the summer
months. The area is serviced solely by septic tanks, and stormwater
drains into the marine area near the boat ramp. The coastal settlement
is being connected to a new sewerage system which will irrigate to land. This
is due for completion by December 2014.
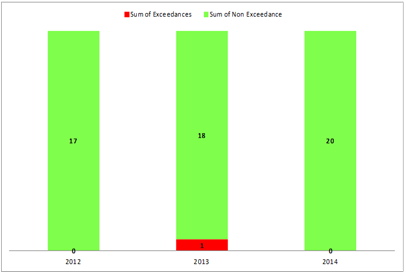
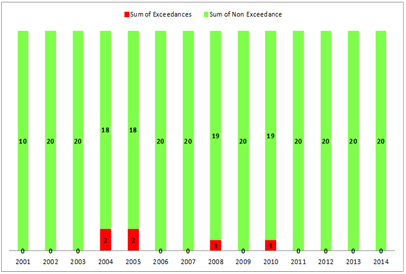
Season
summary
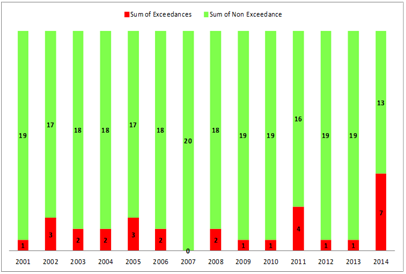
Mahia Beach was
sampled 20 times this season, of which 90% were in green mode (18/20) and 10%
(2/20) in red mode (based on single level exceedances). Both exceedances
were during periods of heavy rain. No exceedances of the
two-consecutive sample protocol occurred.
|
|
Description
of recreation value
Mahia Beach is a long arcing bay of fine
white sand and associated dunes. The beach is commonly used for swimming, diving,
boat launching and many other beach sports.
Trend in recreational water quality over
time
Elevated bacteria concentrations are
generally observed in the height of the holiday period when individual septic
tank systems are subject to pressure, after heavy and prolonged rainfall or
both.
There has been no significant change in
water quality at this site.
The SFRG grade remained unchanged this
season with a ‘Fair’ rating. It is likely that this grade
reflects the history of malfunctioning, overloaded septic tanks in this area,
however further work is programmed to determine the source of faecal
contamination (see 7.1).
|
|
|

|
|
|
Fair
|
Historical
Exceedances
|
|
Te Mahia at boat
ramp
|
|
|
|
The Te
Mahia at boat ramp site lies at the mouth of the Whangawehi Stream.
This area is regularly used by the local community for recreational
activities as well as being the downstream receiving environment of the
largest catchment on the Mahia Peninsula. This catchment includes the
forested area that will receive the Mahia community wastewater via land
application. Te Mahia at boat ramp was added as a new site in 2010/11.
Season summary
Te Mahia was sampled 20 times this season
of which 90% (18/20) were in green mode, 10% (2/20) in red mode (based on single level exceedances).
|
|
Description
of recreation value
Te Mahia is a sandy estuarine environment
with a boat jetty and launch ramp. The channel is used for boating
access to the sea. The area is also used for swimming and fishing.
Trend in recreational water quality over
time
Elevated bacteria concentrations are
generally observed in dry weather and after heavy and prolonged rainfall.
There was a small but significant trend
in the data for water quality improvement.
The Interim SFRG for this site is
‘Fair’ an upgrade from last season, although the site has less
than 5 years data available.
|
|
|

|
|
|
Fair
|
Historical
Exceedances
|
|
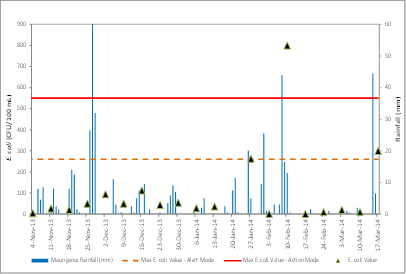
Maungawhio Lagoon
|
|
|
|
The
Maungawhio Lagoon is located on the northern side of Mahia Peninsula.
The estuary is formed at the mouth of the Kopuawhara River. The lagoon
has been identified as a significant area in Hawke’s Bay's Regional
Coastal Environment Plan, and is important for fish spawning, breeding and
roosting of water birds. Maungawhio Lagoon is also monitored for the impacts on
water quality that may compromise consumption of shellfish. There
is a freedom camping site here with a public toilet and changing room.
Season summary
Maungawhio Lagoon was sampled 20 times
this season of which 85% (17/20) were in green mode, 10% (2/20) in amber mode
and the remaining 5% (1/20) in red mode (based
on single level exceedances). No exceedances of the two-consecutive
sample protocol occurred.
|
|
Description
of recreation value
The lagoon has a sand bar and
large sand flats with a raised barrier dune system. The area is regularly
used for swimming, picnicking, fishing and shellfish gathering.
Trend in recreational water quality over
time
Elevated bacteria concentrations are
generally observed after heavy rainfall.
There has been no significant change in
water quality at this site.
The SFRG has an interim result of
‘Very Poor’. Only an interim result has been able to be
achieved at this time, as the indicator was changed from E. coli to
enterococci in 2010, reflecting the sites more saline properties.
Irrespective, further
work is programmed to determine the source of faecal contamination (see 7.1).
|
|
|

|
|
|
Very Poor
|
Historical
Exceedances
|
|
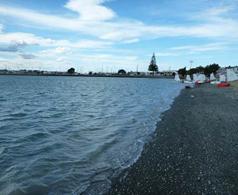
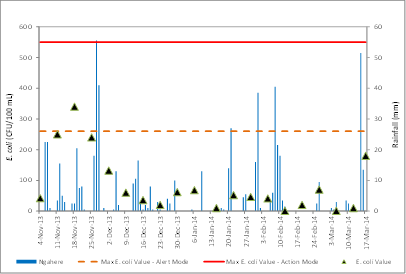
Opoutama Beach
|
|
|
|
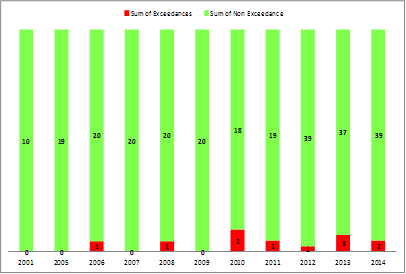
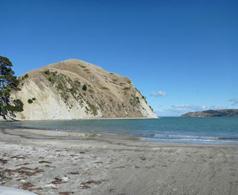
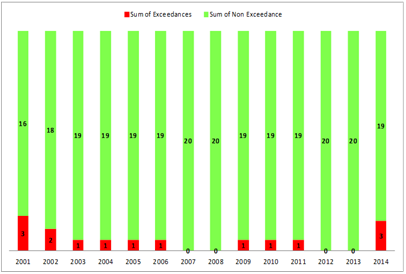
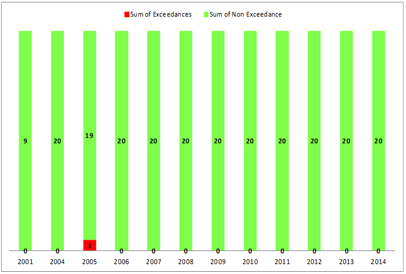
Opoutama
Beach is located on the north-eastern side of the Mahia Peninsula at the
opposite end of the bay from Mahia beach. The beach supports a wide
range of recreational activities in the summer months. There is a
resident community around the Opoutama stream, and on neighbouring lifestyle
blocks. Subdivision of the former campsite is continuing. The
Opoutama Stream runs into the western side of the beach, draining a small
catchment mainly in agricultural land-use.
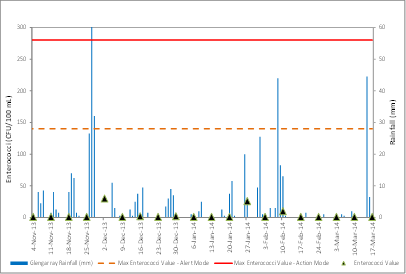
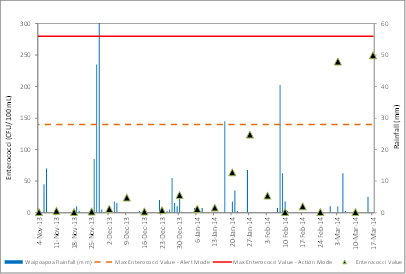
Season
summary
Opoutama Beach was sampled 20 times this
season of which 90% (18/20) of samples were in green mode, 10% (2/20) in red
mode due
to heavy rainfall within the catchment (based on single level
exceedances). No exceedances of the two-consecutive sample protocol
occurred.
|
|
Description
of recreation value
Opoutama Beach is a fine grain sandy
beach and dune system. There is a freedom camping site in the car park
with a public toilet and picnic area. The site is commonly used for
swimming, surfing, fishing and picnicking.
Trend in recreational water quality over
time
Elevated bacteria concentrations are
generally observed in the height of the holiday period when individual septic
tank systems are subject to pressure, after heavy and prolonged rainfall, or
both.
There was no significant change in water
quality at this site from previous seasons.
The SFRG has been downgraded this season
to ‘Poor’ based on an increase in the Sanitary Inspection
Category (SIC) from moderate to high, and a change in the Microbiological
Assessment Category (MAC =water quality results) from C to D. Further
work is programmed to determine the source of faecal contamination (see next
page and 7.1).
|
|
|

|
|
|
Poor
|
Historical
Exceedances
|
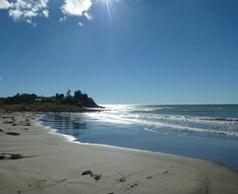
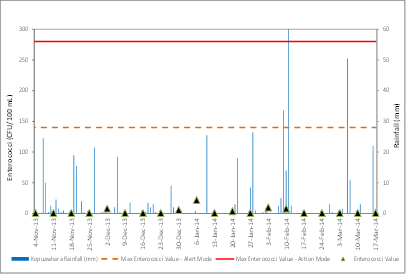
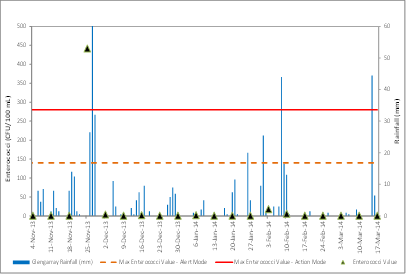
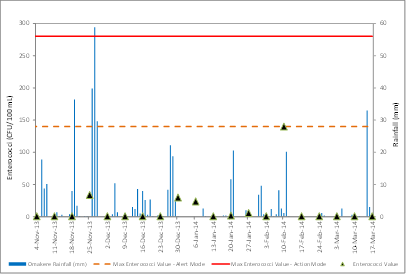
Case Study: Opoutama Beach – Faecal
Source Tracking
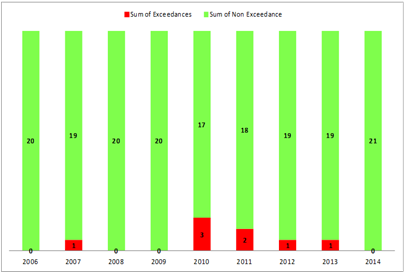
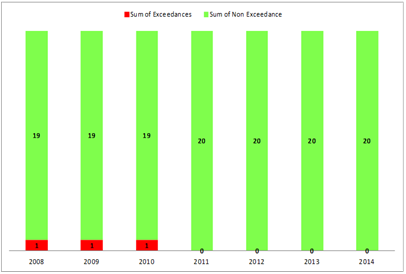
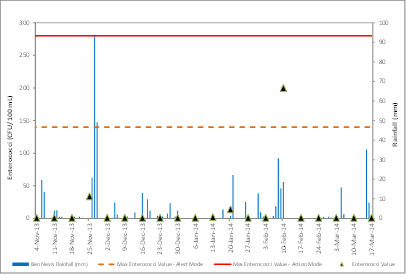
Opoutama
Beach
Opoutama
Beach lies at the south-western edge of the Mahia Isthmus. Bordered by a
mix of grazing, native and exotic vegetation and a small coastal settlement,
Opoutama’s Suitability for Recreation Grade (SFRG) has fluctuated from
‘Poor’ (2007) to ‘Good’ (2009 and 2010) and back to
‘Poor’ in the current year. The primary reason for the grade
changes has been changes in the 95th percentile percentile of
indicator bacteria counts for the previous five years, from 520 cfu/100mL in
2007 (Grade D) to 165 cfu/100mL in 2010 (Grade B). This highlights the
influence that a few high counts can have on the microbiological assessment
category, and therefore the SFRG for a site.
Given
the conflict between the water quality results and the recreational value held
for the area, and that a ‘Poor’ grading is unusual for
Hawke’s Bay’s exposed open coastal beaches, this site was selected
for further investigation into the source of contaminants entering the Opoutama
Beach area, and potential management options.
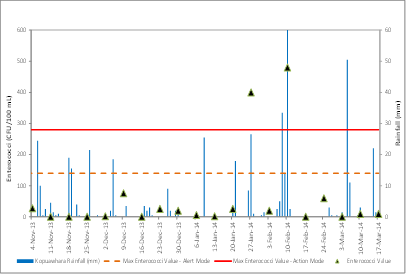
During
the 2013/14 season, samples
were collected for faecal
source tracking using faecal
sterol and PCR marker analyses.
Samples were collected
on the 11th February, 2014 following a rainfall related enterococci count of
1050 cfu/100mL (action level guideline = 280cfu/100mL), when more than 82.5mm
rain fell at Kopuawhara. This exceedance follows an earlier rainfall related
exceedance of 1400 cfu/100mL enterococci on 27th January, 2014. Samples were
sent to ESR Christchurch for analysis.
Both samples were dominated by enterococci from ruminant
sources .
Ruminant
animals include cattle, sheep, deer and goats, all of which are likely to be present in
the Opoutama catchment.
Further sampling is
being completed outside the normal monitoring season to validate the results of
the initial sample. Work is also being undertaken with the Land Management
section of Hawke’s Bay Regional Council to identify potential management
solutions within this catchment.
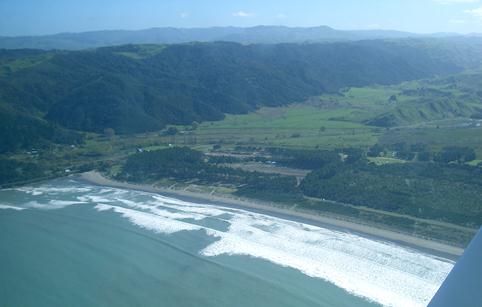
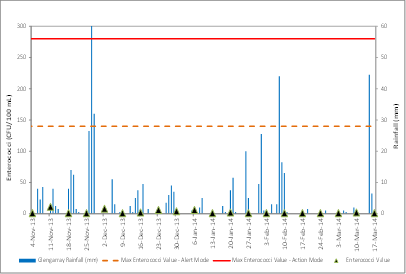
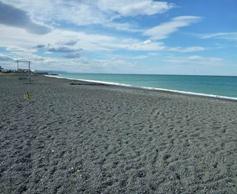
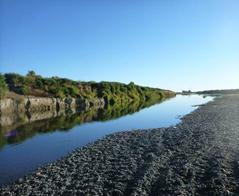
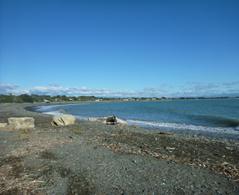
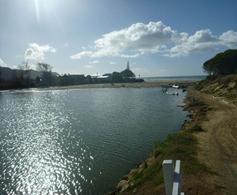
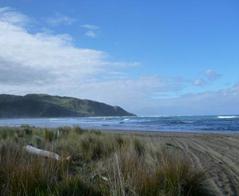
Figure 4-1: Opoutama Beach 2005
|
Recreational
Water Quality Report: Review of the 2013-14 Season
|
Attachment 1
|
|
Wairoa River
|
|
|
|
The
Wairoa River sample site is located on the ski club boat ramp upstream of the
town bridge. The predominant land use within the catchment is
agricultural with sheep/beef farming and some dairying. There are
several discharges into the river, with Frasertown Meats located upstream of
the sampling site and downstream discharges including Affco Wairoa and the
municipal sewage discharge. several stormwater drains also flow into
the river, and both active and closed landfills are located near the mouth of
the river.
Season
summary
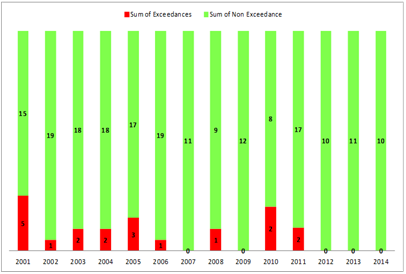
Wairoa River was
sampled 20 times this summer of which 90% (18/20) were in green mode, and 10%
(2/20) in red mode. Both red mode exceedances were rainfall related.
|
|
Description
of recreation value
The Wairoa River site is located on the
boat ramp of the ski club. The river provides calm water for skiers,
rowers and other water sports. There is also a rowing club, which
benefits from long stretches of flat water.
Trend in recreational water quality over
time
Elevated bacteria levels are generally
observed after heavy and prolonged rainfall.
There was no significant change in water
quality at this site.
The SFRG was downgraded this season to
‘Very Poor’ based on an increase in the Sanitary Inspection
Category (SIC) from moderate to high. This was based on the number of
discharge points, and the highest 95thpercentile for indicator
bacteria.
|
The data point not on the seasonal graph
(January 20th) below had a result of: TNTC (Too numerous to
count). However under laboratory standards a discrete number cannot be
assigned to plot.
|
|

|
|
|
Very Poor
|
Historical Exceedances
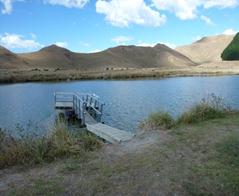
|
|
Lake Tutira
|
|
|
|
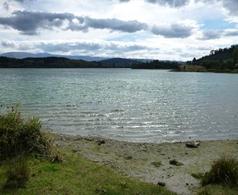
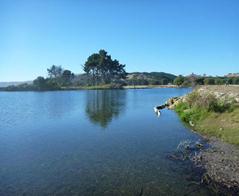
Lake Tutira is
the second largest lake in Hawke’s Bay, located approximately 50km
north of Napier. The surrounding land use is predominantly sheep/beef
farming and some forestry. It is a popular camping and holiday area
throughout the summer period.
Cyanobacteria (blue-green)
algae are present in the lake and these can bloom rapidly. Cercarial
dermatitis (Duck itch) is also present; there is permanent signage at the
lake warning lake users of the water quality issues.
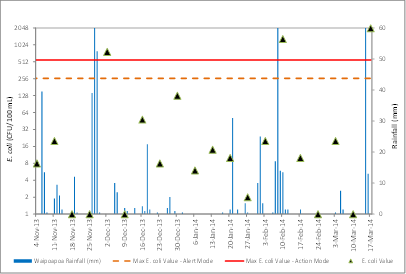
Season Summary
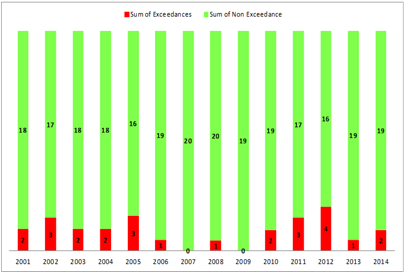
Lake Tutira was sampled 20 times
this season 80% (16/20) of which were in green mode, 5% (1/20) in amber mode
and the remaining 15% (3/20) were in red mode. All three red mode
exceedances were rainfall related.
|
|
Description
of recreation value
Lake Tutira is a designated country park,
with a walking track around the shoreline. The
lake is regularly used for canoeing, swimming, trout fishing and boating. There are
several picnic areas and a popular campground.
Trend in recreational water quality over
time
Elevated bacteria levels are generally
observed after rainfall, when surface water runoff from adjacent farmland
drains into the lake. High numbers of birds around the sampling area may
contribute to elevated bacteria levels.
There has been no significant change in
water quality at this site.
The SFRG remained unchanged this season
with a grading of ‘Very Poor’.
|
|
|

|
|
|
Very Poor
|
Historical
Exceedances
|
4.2 Central Region
|
Waipatiki Beach
|
|
|
|
Waipatiki
Beach is a small cliff-bound beach located approximately 20 km north of
Napier. There is a small permanent community and holiday baches, and a
popular campground. The area is currently being developed, and a
community sewage treatment system was installed in 2006. The Waipatiki
Stream has a steep pastoral and forested catchment with a lagoon behind the
beach in the lower catchment which discharges into the coastal environment.
Season Summary
Waipatiki Beach was sampled 20
times this season 100% (20/20) of which were in green mode.
|
|
Description
of recreation value
Waipatiki beach is a medium sand
beach that is commonly used for swimming, surfing, diving and other beach
sports.
Trend in recreational water quality over
time
Elevated bacteria levels are generally
not observed at this site.
There has been no significant change in
water quality at this site.
The SFRG has remained unchanged this
season with a grading of ‘Good’.
|
|
|

|
|
|
Good
|
Historical
Exceedances
|
|
Waipatiki Lagoon
|
|
|
|
Waipatiki Lagoon
is at the mouth of the Waipatiki Stream. During normal flows the mouth of the
lagoon is at the southern end of Waipatiki Beach however during low flows the
mouth of the lagoon may become closed, restricting water flow. The Waipatiki Stream has a steep pastoral and forested
catchment.
Season summary
Waipatiki Lagoon was sampled 20 times
this season 80% (16/20) of which were in green mode, 10% (2/20) in amber mode
and the remaining 10% (2/20) in red mode. The data point not on the
seasonal graph below had a result of: TNTC (Too numerous to count), however
under laboratory standards cannot be assigned a discrete number to
plot. The two red mode exceedances were rainfall related.
|
|
Description
of recreation value
Waipatiki Lagoon is a sandy and partly
vegetated area. The lagoon is commonly used for swimming and is
especially popular for children.
Trend in recreational water quality over
time
Elevated bacteria levels are generally
observed after heavy and prolonged rainfall, when increased surface water
runoff enters the stream that discharges into the Lagoon.
There was a significant trend in the
data, indicating an improvement in water quality.
The SFRG for this site has remained
unchanged this season with a grading of ‘Very Poor’. Faecal
source tracking was undertaken in 2012/2013 and highlighted wildfowl as
significant contributors of faecal contamination in this system.
|
|
|
|
|
|
Very Poor
|
Historical
Exceedances
|
|
Esk River
|
|
|
The Esk River is
located along the Napier-Taupo highway in the Esk Valley,
15 minutes’ drive from Napier. The surrounding land use is
predominantly sheep/beef farming with some orchards and forestry. A piggery
is also located upstream of the site. The immediate area surrounding
the sample site comprises a park maintained by Hastings District Council
which includes a public toilet on the reserve.
Season Summary
Esk
River was sampled 20 times this season 85% (17/20) of which were in green
mode, 5% (1/20) in amber mode and the remaining 10% (2/20) in red mode.
The
data point not on the seasonal graph below had a result of: TNTC (Too
numerous to count), however under laboratory standards cannot be assigned a
discrete number to plot.
|
|
Description
of recreation value
The river is
regularly used for canoeing, swimming and trout fishing. There are
several picnic areas and a children’s playground.
Trend in recreational water quality over
time
Elevated bacteria levels are generally
observed after heavy and prolonged rainfall, when surface water runoff from
adjacent farmland drains into the river.
There has been no significant change in
water quality at this site.
The SFRG remained unchanged this season
with a grading of ‘Fair’.
|
All exceedances were rainfall related.
|
|
|
|
|
Fair
|
Historical
Exceedances
|
Westshore Beach
|
|
|
Westshore
Beach is located to the north of Napier City, and is popular with both locals
and holidaymakers. A patrolled surf lifesaving club adds to the appeal
of the beach. There are several stormwater discharges into the marine
area near the beach, but these do not appear to affect the water quality at
this site.
Season Summary
Westshore Beach was sampled 20
times this season 100% (20/20) of which were in green mode.
|
|
Description
of recreation value
Westshore Beach has a surf club with a
flagged area maintained throughout the summer. There is a reserve
adjacent to the beach with a children’s playground.
Trend in recreational water quality over
time
Generally bacteria levels are good and
seldom exceed guideline levels.
There has been no significant change in
water quality at this site.
The SFRG was downgraded this season to
‘Good’ to reflect the urban nature of the site. This was a
manual downgrade to better distinguish between remote and urban locations, as
urban locations can be influenced more readily by stormwater outfalls.
|
|
|

|
|
|
Good
|
Historical
Exceedances
|
|
Recreational
Water Quality Report: Review of the 2013-14 Season
|
Attachment 1
|
Pandora Pond
|
|
|
|
Pandora Pond is a
small sheltered area of Ahuriri Estuary that is partially separated from the
main estuary by a sand spit. It is close to Napier and the area
adjacent to the pond has been extensively developed, encouraging increasing
use. There are several stormwater and industrial discharges into the
Ahuriri Estuary adjacent to Pandora Pond.
Season Summary
Pandora Pond was sampled 20 times this
season of which 100% (20/20) were in green mode.
|
|
Description
of recreation value
Pandora Pond is frequently used for
recreational activities such as swimming, kayaking, rowing and sailing.
Practice of waka ama is increasing, and there is now a storage facility there
for the local club.
Trend in recreational water quality over
time
Elevated levels of bacteria can
infrequently occur after heavy and prolonged periods of rain.
There has been no significant change in
water quality at this site.
While Pandora Pond has previously had an
interim grading it now has sufficient data to become standardised. The
SFRG has remained at ‘Fair’.
|
|
|

|
|
|
Fair
|
Historical
Exceedances
|
Hardinge Road
Beach
|
|
|
|
The
beach at Hardinge Road is close to Napier City, and several cafes and shops
now border the area. The site is a central location for summer
recreation with many visitors daily. The beach is adjacent to the
entrance to the Inner Harbour and the Port of Napier.
Season Summary
Hardinge Road Beach was sampled 20
times this season 95% (19/20) of which were in green mode, while the remaining
5% (1/20) were in red mode (based on single level
exceedances).
No exceedances of the
two-consecutive sample protocol occurred.
|
|
Description
of recreation value
Hardinge Road Beach comprises a
coarse sand and pebble mixture, with a grass-covered dune. Multiple
facilities surround the beach including a children’s playground,
beachfront boardwalk and restaurants. The beach is used for swimming,
snorkelling and beach sports.
Trend in recreational water quality over
time
Although water quality at this site has
generally complied with guideline values, elevated bacteria may occur
infrequently following rain events.
There has been no significant change in
water quality at this site over time.
The SFRG for this site has remained
unchanged this year with a grading of ‘Good’.
|
|
|

|
|
|
Good
|
Historical
Exceedances
|
|
Marine Parade
|
|
|
|
This site is
located adjacent to Marine Parade in Napier, in front of the Pacific Surf
Club flagged area. Due to the proximity to metropolitan and residential
areas of the city it has been added to the monitoring programme in 2011 as a
permanent site. The site experiences a high number of bathers
throughout the summer.
Season
Summary
Marine Parade Beach
was sampled 20 times this season 100% (20/20) of which were in green mode.
|
|
Description
of recreation value
Marine Parade Beach comprises a coarse
greywacke pebble beach. The beach has a steep drop off and swimming
within the flagged area is recommended. There is a coastal pathway,
public toilet, bike hire shop and salt water pool complex next to the site.
Trend in recreational water quality over
time
Elevated levels of bacteria can occur
infrequently after prolonged heavy rainfall events.
There has been no significant change in
water quality at this site over time.
Marine Parade has an interim grading
(<5yrs data) of ‘Good’.
|
|
|

|
|
|
Good
|
Historical
Exceedances
|
Tutaekuri River
|
|
|
|
The
Tutaekuri River site is close to Napier and accessed via the end of Guppy
Road in Taradale. During the summer months it is a popular bathing
spot. The river drains a predominantly agricultural catchment, with
some intensive horticultural activities in the lower reaches.
Season Summary
Tutaekuri River was sampled 20
times this season 95% (19/20) of which fell within green mode, 5% (1/20) in
amber mode.
|
|
Description
of recreation value
The Tutaekuri River is a relatively low
flow river which is used by families for swimming. The river hosts a
variety of users, including motor bikers, walkers, cyclists and
swimmers. One of the Hawke’s Bay cycle ways goes along the stop
bank and there is a bike park upstream from the site.
Trend in recreational water quality over
time
Elevated bacteria concentrations
generally follow rain events at this site, during which surface runoff from the
catchment transport bacteria to the river.
There has been no significant change in
water quality at this site over time.
The SFRG for this site has remained
unchanged with a grading of ‘Fair’.
|
|
|
|
|
|
Fair
|
Historical
exceedances
|
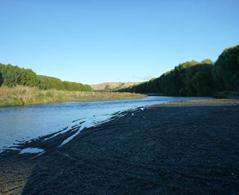
Ngaruroro River
|
|
|
|
The
Ngaruroro River at Chesterhope Bridge site is located between Napier and
Hastings on Pakowhai Rd. The Ngaruroro catchment is predominantly
agricultural and is used for intensive horticulture in the lower
reaches. The river is a popular bathing spot during the summer for
locals from Napier and Hastings.
Season Summary
Ngaruroro River at Chesterhope
Bridge was sampled 20 times this season 85% (17/20) of which were in green
mode, 15% (3/20) in amber mode and are considered rainfall related.
|
|
Description
of recreation value
The Ngaruroro River is bordered largely
by grassy flats with good access by car. Beside the bridge there is a
deep swimming hole. There are many access points to the river along
this run, which provides great family picnicking and swimming areas.
Trend in recreational water quality over
time
Elevated concentrations of bacteria
generally follow rain events when increased surface runoff enters into the
river from the surrounding catchment.
There has been no significant change in water
quality at this site over time.
The SFRG for this site has remained
unchanged with a grading of ‘Fair’.
|
|
|

|
|
|
Fair
|
Historical
exceedances
|
Tukituki River at
Black Bridge
|
|
|
|
The
Tukituki River at Black Bridge site is located at Haumoana. The large
catchment of the Ruataniwha Plains is utilised for pastoral agriculture,
horticulture and viticulture. The river enters an estuarine environment
at Haumoana. The sampling site at Black Bridge is regularly used for
swimming, fishing and other recreational activities.
Season Summary
Tukituki River at Black Bridge was
sampled 20 times this season 90% (18/20) of which were in green mode, 10%
(2/20) in red mode.
|
|
Description
of recreation value
The Tukituki River is widely used for
swimming and fishing. A Hawke’s Bay cycle way goes along the stop
bank and grassy flat areas are present for picnicking. This reach of
the river is used extensively for white baiting during the season.
Trend in recreational water quality over
time
Elevated concentrations of bacteria
generally follow rain events, when increased surface runoff enters the river
from the surrounding catchment.
There has been no significant change in
water quality at this site over time in trend testing, however the SFRG for
this site was downgraded to ‘Poor’ this season based on a change
in the Microbiological Assessment Category (MAC) from C to D grade. See
table 6.2 for an explanation of the relevance of this change.
|
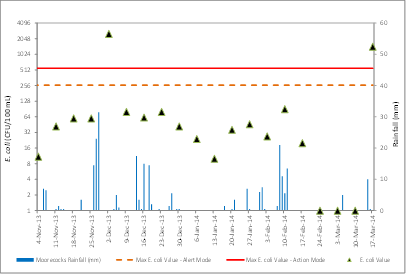
Note log2
concentration scale
|
|

|
|
|
Poor
|
Historical
exceedances
|
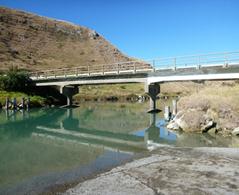
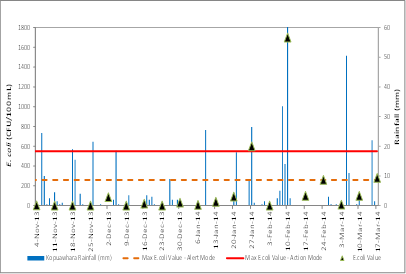
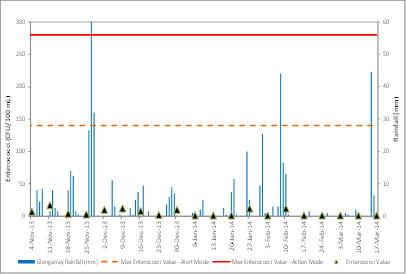
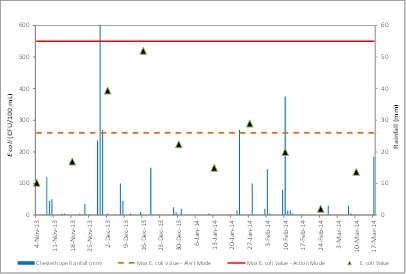
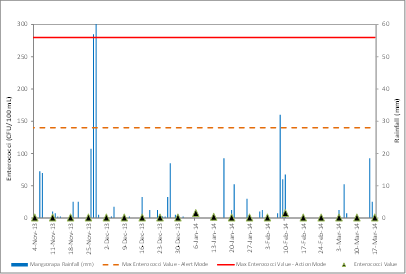
Clive River at
SH2 Bridge
|
|
|
Description
of recreation value
The river is used for rowing,
water skiing, jet skiing and fishing. There is a free camping site and
picnic tables.
|
The
Clive River at SH2 Bridge site is downstream of the road bridge at the boat
ramp. The area includes a large body of relatively calm water that hosts many
different user groups. This site is sampled fortnightly as it is permanently
signposted. The catchment is characterised by pastoral,
horticultural, viticultural, industrial and urban land use. The river
is the main receiving environment for stormwater from Hastings City and
Havelock North.
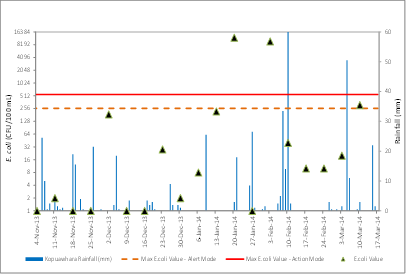
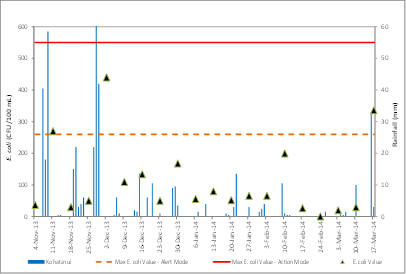
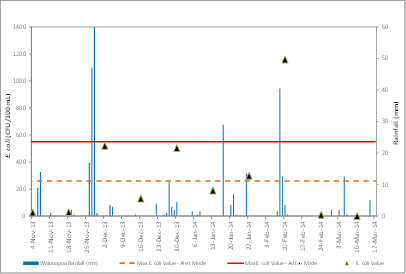
Season Summary
Electrical conductivity
measurements are used to determine the indicator bacteria used on the day of
sampling. The Clive river is sampled fortnightly.
On days when E. coli were
used (<10,000 µS/cm), 70% (7/10) were in green mode and 30% (3/10)
in amber mode. The graph shows only the E. coli results to
display the most sampled indicator however there was also an enterococci
exceedance on the 27th Jan 2014.
|
|
Trend in recreational water quality over
time
Elevated concentrations of bacteria
generally occur after rain events, during which increased surface runoff
enters the river from the surrounding catchment.
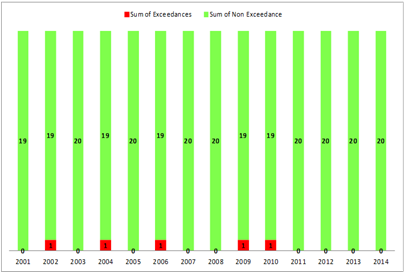
There was no significant trend in the
data for this site.
The SFRG for this site has remained
unchanged this season with a grading of ‘Very Poor’.
Further work has been identified for this
site (see 7.2) to determine sources of high bacterial counts.
|
|
|
|
|
|
Very Poor
|
Historical
exceedances
|
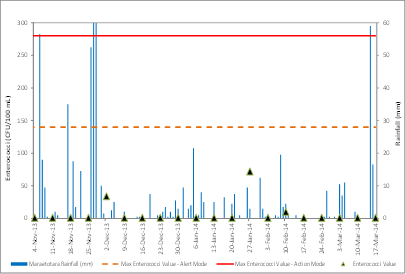
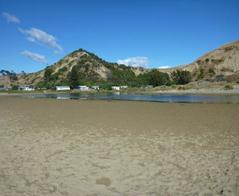
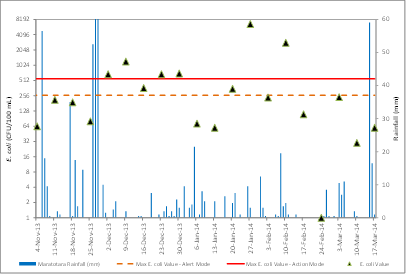
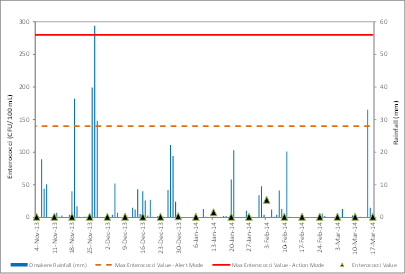
Maraetotara
Lagoon
|
|
|
|
The
Maraetotara River passes through predominantly pastoral land to enter the
coast via the Maraetotara Lagoon at Te Awanga. The Te Awanga camping
ground is situated beside the northern embankment of the lower Maraetotara
River, and the sample site is beside the main car park. Te Awanga is
popular due to its diverse coastal features and close proximity to the Cape
Kidnappers gannet colony.
Season Summary
Maraetotara Lagoon was sampled 20
times this season of which 90% (18/20) were in green mode, 10% (2/20) in
Amber mode.
|
|
Description
of recreation value
Maraetotara Lagoon is a calm estuarine
barrier lake with a small outflow. The area is commonly used by
families, and is popular throughout the summer for swimming and kayaking.
Trend in recreational water quality over
time
Elevated concentrations of bacteria
generally follow rain events, which increase surface runoff from the
surrounding catchment.
There has been no significant change in
water quality at this site over time.
The SFRG for this site has remained
unchanged this season with a grading of Poor.
|
|
|

|
|
|
Poor
|
Historical
exceedances
|
Te Awanga Beach
|
|
|
|
The Te
Awanga site is located adjacent to the Maraetotara Lagoon and has been
included in the sampling programme to reflect the high number of users at
this locality. It has a recognised surf break that at times attracts large
numbers of surfers. The site has a reef environment as well as being the
discharge point for the Maraetotara River.
Season Summary
Te Awanga Beach was sampled 20
times this season 90% (18/20) of which were in green mode, and 10% (2/20) in
amber mode (based on single level
exceedances).
No exceedances of the
two-consecutive sample protocol occurred.
|
|
Description
of recreation value
Te Awanga is a coarse gravel/pebble beach
with sparse patches of sand. There is a sub-tidal reef beyond the point
that generates surf. Other sporting activities enjoyed here are
boating, kayaking, swimming and fishing.
Trend in recreational water quality over
time
Elevated concentrations of bacteria
generally follow rain events, during which increased flow from Maraetotara
lagoon discharges into the coastal area.
There was no significant trend in the
data for this site.
The SFRG for this site has remained
unchanged this season with a grading of ‘Fair’.
|
|
|
|
|
|
Fair
|
Historical
exceedances
|
Ocean Beach
|
|
|
|
Ocean
Beach is south of Cape Kidnappers. The beach is popular due to its
largely unmodified coastal environment and proximity to Napier and
Hastings. The Waipuka Stream discharges into the southern end of the
beach. The beach has a small community of baches which are serviced by
individual septic tanks. Samples at this site are taken in the main
swimming area, immediately in front of the surf lifesaving tower.
Season Summary
Ocean Beach was sampled 20 times
this season 100% (20/20) of which were in green mode.
|
|
Description
of recreation value
Ocean Beach is a sand beach with a
nationally important dune structure that stretches north east to Cape
Kidnappers. The beach is popular throughout the summer and there are
weekend lifeguard patrols from November until March.
Trend in recreational water quality over
time
There has been no significant change in
water quality at this site over time.
The SFRG for this site has remained
unchanged this season with a grading of Very Good.
|
|
|

|
|
|
Very Good
|
Historical
exceedances
|
4.3 Southern Region
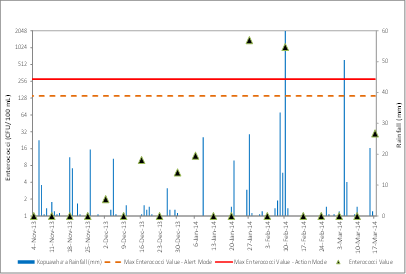
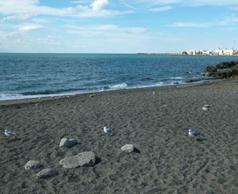
Waipuka Stream
|
|
|
|
Waipuka
Stream flows out onto Ocean Beach and into the sea. The catchment comprises
steep pastoral land with limited vegetation cover. The stream
also passes by a small community of baches near its mouth, and often forms a
lagoon, which is popular with small children. The mouth of the lagoon
periodically closes with sand during summer low flows.
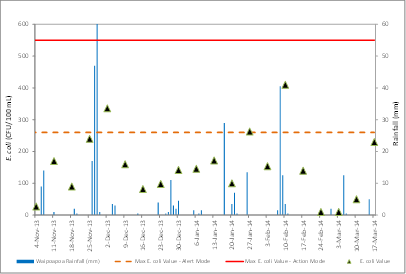
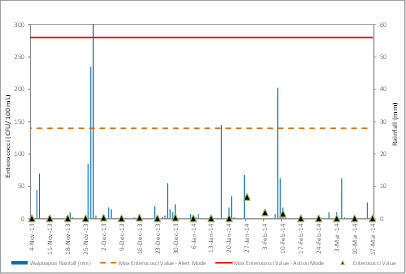
Season Summary
Waipuka Stream was sampled 20
times this season of which 60% (12/20) were in green mode, 10% (2/20) in
amber mode and remaining 30% (6/20) in red mode. Faecal source tracking
samples were taken to determine the source (see next page).
|
|
Description
of recreation value
Waipuka Stream forms a small lagoon on
Ocean Beach. The area is used by families because it has shallow,
constant depth and the water temperature is consistently approximately
3°C warmer than the sea.
Trend in recreational water quality over
time
Elevated concentrations of bacteria occur
after rain events, when surface runoff to the stream from the surrounding
catchment increases and potential septic system failures occur.
There was a significant trend in the data
of 2.2 per annum. This is degradation of water quality over time.
The SFRG for this site has remained
unchanged this season with a grading of ‘Very Poor’ (see
case study next page).
|
|
|

|
|
|
Very Poor
|
Historical
exceedances
|
Case Study: Waipuka Stream – Faecal
Source Tracking
Waipuka
Stream
Waipuka
Stream lies at the eastern end of Ocean Beach Road. While the northern
end of Ocean Beach is relatively unpopulated, adjacent to the Waipuka Stream
are several holiday baches. The catchment for Waipuka Stream and Ocean
Beach is predominantly high producing grassland (pastoral farming), with small
sections of exotic forest and some of the most extensive sand dune complexes
within Hawke’s Bay.
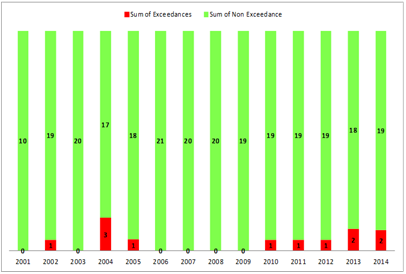
Waipuka
Stream has graded consistently ‘Poor’ in terms of its Suitability
for Recreation Grade since the grades were first introduced, primarily caused
by high faecal indicator bacteria counts. During the 2013/2014 season six
exceedances (30% of samples taken during the year) of national guidelines
occurred at Waipuka Stream (see previous page), indicating that during these
times the risk of recreation within the stream was high. Following these
exceedances, and the history of poor water quality for the site, faecal source
tracking was undertaken during the 2013/2014 season.
Faecal
source tracking was undertaken using faecal sterol and PCR marker analyses. Samples were collected on the 9th December, 2013 following an E.
coli result of 1210 cfu/100mL (action level = 550cfu/100mL), and on the 20th
January, 2014 with an E.
coli result of 350 cfu/100mL. Both these
exceedances are likely to be caused by periods of high rainfall.
Results of the analyses undertaken on the 9th December
2013 had a high level of general markers for PCR analysis, meaning a high
likelihood that PCR analysis would be successful. This analysis suggested
up to 50% of the contamination resulted from ruminant faeces (cattle, deer,
goat and sheep), and bird faeces. The faecal sterol analysis indicated a
higher proportion of the contamination from wildfowl, with evidence of ruminant
contamination also. In general ruminant and wildfowl faeces were
considered to be the major source of contamination at this time. A site
inspection following the results found large numbers of geese resident upstream
of the site.
Results of the analyses undertaken on the 20th January
had a much lower levels of general markers for PCR analysis meaning a low
likelihood that PCR analysis would be successful. This can also suggest
aged sources of faecal material rather than fresh. No sources were
distinguished based on the low levels in this sample. The faecal sterol
analysis also failed to detect any animal faecal source, and decaying plant
material or kitchen sources were suggested. Due to the low level of
indicator bacteria in the concomitant sample (below action level exceedance) no
faecal source tracking is recommended for periods when the indicator bacteria
levels do not exceed action levels (550 E. coli cfu/100mL or 280
enterococci cfu/100mL).
Further testing is scheduled for the 2014/2015 summer to confirm
these sample results.
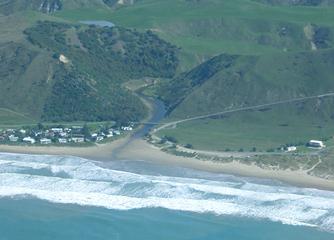
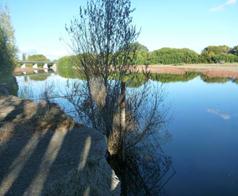
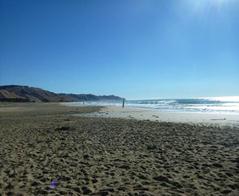
Figure 4-2: Waipuka Stream 2005
Waimarama Beach
|
|
|
|
Waimarama
Beach lies to the south of Napier City. Its proximity (approximately 45min
drive) makes the area popular for both locals and visitors to the Bay.
Waimarama Beach area has a large resident population as well as numerous
visitor baches and a campground. Over the summer holiday period the
population increases significantly, placing extra pressure on septic systems.
The Puhokio Stream discharges into the centre of the beach.
Season Summary
Waimarama Beach was sampled 20
times this season of which 100% (20/20) were in green mode.
|
|
Description
of recreation value
Waimarama Beach is a sand beach
with intact dune systems. There are weekend lifeguard patrols at the
southern end of the beach from November through until March. There is
an offshore island, Bare Island, which is a common attraction for fisherman
and divers. Surfing and other beach sports are common throughout the
year.
Trend in recreational water quality over
time
Bacteria levels generally remain within
recommended guidelines. Heavy and prolonged periods of rain causes
increased surface runoff from the Puhokio catchment.
There has been no significant change in
water quality at this site over time.
The SFRG for this site has remained
unchanged this season with a grading of ‘Good’.
|
|
|
|
|
|
Good
|
Historical
exceedances
|
Puhokio Stream
|
|
|
|
The Puhokio stream passes through
Waimarama settlement and discharges into Waimarama Beach approximately
halfway along the beach. The catchment is predominantly
agricultural. The stream discharges into an estuarine environment,
newly shaped by the April 2011 flood.
In the past, the stream has shown high levels of faecal contamination,
sourced from both agriculture and on-site wastewater treatment system
malfunction.
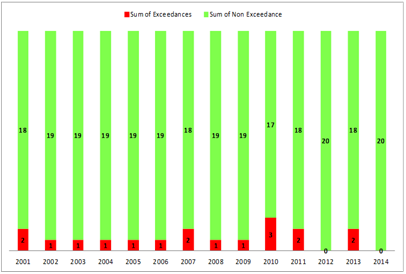
Season Summary
Puhokio Stream was sampled 10 times (fortnightly) this season of
which 60% (6/10) were in green mode, 30% (3/10) in amber mode and the
remaining 5% (1/10) in Red mode.
|
|
Description of recreation
value
The warm temperatures and slow flowing lagoon makes it particularly
popular with children. The area is also extensively used by walkers.
Trend in recreational water quality over time
Elevated levels of bacteria are generally found during all
conditions.
There was a significant trend in the data indicating an improvement
of water quality over time.
The SFRG for this site has remained unchanged this season with a
grading of ‘Very Poor’. Further work is recommended to
determine the source of faecal contamination (see 7.3)
|
|
|

|
|
|
Very Poor
|
Historical exceedances
|
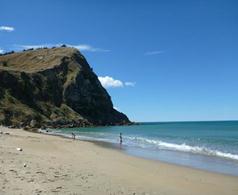
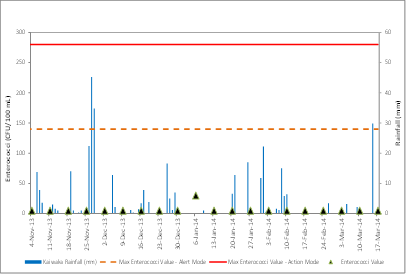
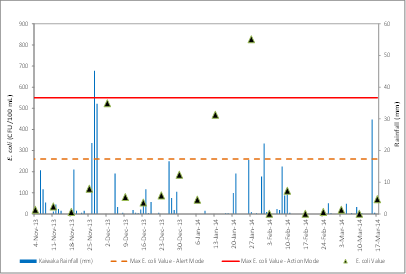
Kairakau Lagoon
|
|
|
|
Kairakau Lagoon is a 40 minute drive from Hastings through
Elsthorpe. The lagoon is formed at the mouth of the Mangakuri River,
which passes through a predominantly pastoral catchment before discharging
into the ocean at Kairakau Beach. There is a small local community
there of baches and some permanent residents. The Kairakau Beach
campground is popular during the summer and is serviced by two public toilets
and individual septic systems. There were new toilets built by the camp
ground during 2012.
Season Summary
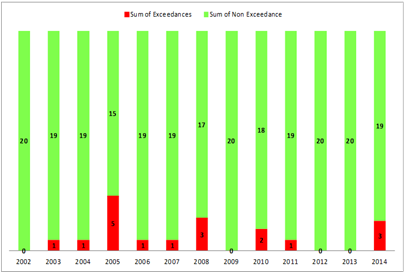
Kairakau Lagoon was sampled 20 times this season 85% (17/20) of
which were in green mode, 15% (3/20) in red mode – two out of three
were rainfall related.
|
|
Description
of recreation value
The campground borders
the lagoon and is frequently used for fishing, boating and swimming. It is
particularly used by children.
Trend in recreational water quality over
time
Elevated levels of bacteria were observed
this season during dry and periods of heavy rainfall.
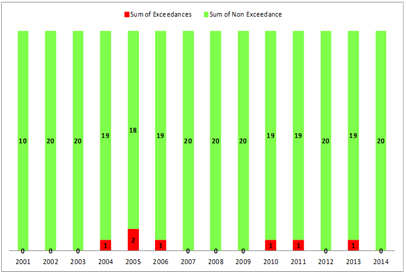
There was a significant but small trend
in the data indicating an improvement of water quality over time.
Despite this, the SFRG for this site has
downgraded this season to ‘Very Poor’. This was based on a manual
increase in the Sanitary Inspection Category (SIC) from moderate to high
risk, based on sample results from previous years.
|
|
|

|
|
|
Very Poor
|
Historical
exceedances
|
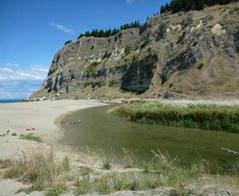
Kairakau Beach
|
|
|
|
Kairakau
Beach is a 40 minute drive from Hastings through Elsthorpe. The
settlement is located in front of a cliff ridge up to 153 metres high.
There are three small rocky islands offshore. The islands: Hinemahanga,
Waimatai and Tokaroa are of cultural significance. There is a small
settlement of holiday baches with some permanent residents and a camping
ground serviced by individual septic tanks. The Kairakau Lagoon
discharges at the southern end of the beach.
Season Summary
Kairakau Beach was sampled 20 times
this season 100% (20/20) of which were in green mode based on both single and
two-consecutive samples.
|
|
Description
of recreation value
Kairakau beach is a sand beach and
has an established fenced vegetated dune. There are multiple designated
access points to protect the dune structure and there is a public
toilet. The beach is a popular spot for fishing, boating, surfing and
diving.
Trend in recreational water quality over
time
Elevated levels of bacteria were not
observed this season.
There has been no significant change in
water quality at this site over time.
The SFRG has improved this season with a
change in the Sanitary Inspection Category (SIC) from low to very low risk,
based on sample results from previous years.
|
|
|
|
|
|
Very Good
|
Historical
exceedances
|
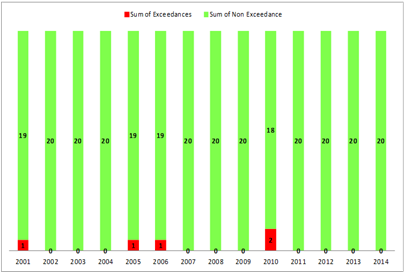
Pourerere Beach
|
|
|
|
Pourerere
Beach in southern Hawke’s Bay is a popular holiday destination.
The community has several holiday homes as well as some permanent
residents. The settlement is serviced solely by individual septic tank
systems. The catchment is largely pastoral with some cropping.
There is a commercial crayfish (Jasus edwardsii) fishing fleet based
here.
Season Summary
Pourerere Beach was sampled 20
times this season 100% (20/20) of samples were in green mode based on both
single and two-consecutive samples.
|
|
Description
of recreation value
Pourerere Beach is sand with an extensive
dune system and small wetland area. The beach is very popular and
supports multiple user groups. The beach is busy during summer months with
allocated beach camping. There is a public toilet and changing rooms
beside the camping area. Common activities include swimming, surfing,
diving and fishing.
Trend in recreational water quality over
time
Bacteria levels at Pourerere Beach have
generally remained within guideline values with only a single exceedance
during the 2005 programme.
There has been no significant change in
water quality at this site over time.
The SFRG for this site has remained
unchanged this season with a grading of ‘Very Good’.
|
|
|

|
|
|
Very Good
|
Historical
exceedances
|
Aramoana Beach
|
|
|
|
Aramoana
Beach is located at the northern boundary of the Te Angiangi marine
reserve. The catchment is largely pastoral with some cropping.
The coastal community is serviced by individual septic systems, and the
subdivision is serviced by a secondary treatment system. The Te
Angiangi reserve is increasing in popularity and receives higher numbers of
visitors each year. There is an established wetland formed by the Oupoto
Stream, running parallel with the beach. There is vehicle beach access
and a car park area there. Aramoana Beach is a relatively recent
addition to the monitoring programme due to the development of a coastal
subdivision.
Season Summary
Aramoana Beach was sampled 20
times this season 100% (20/20) of which were in green mode based
on both single and two-consecutive samples.
|
|
Description
of recreation value
Aramoana Beach is a fine grain sand beach
with an intact dune system. There is a sub-tidal reef system that
offers diving inside and outside of the reserve. The beach is popular
for swimming and fishing along with other beach sports.
Trend in recreational water quality over
time
There has been no significant change in
water quality at this site over time.
The SFRG for this site has remained
unchanged this season with a grading of ‘Very Good’.
|
|
|

|
|
|
Very Good
|
Historical
exceedances
|
Blackhead Beach
|
|
|
|
Blackhead
Beach is the main access point to the Te Angiangi Marine Reserve, and is
popular throughout the summer months. The steep catchment is largely pastoral
with a pine plantation. There is vehicle beach access and a car
park area there. There is a small settlement with holiday baches and
two camping grounds with some permanent residents. Wastewater is
managed using individual septic tanks.
Season Summary
Blackhead Beach was sampled 20
times this season 95% (19/20) of which were green mode and 5% (1/20) in amber
mode. The amber mode exceedance followed high rainfall in the
catchment. No samples exceeded action level guidelines based
on both single and two-consecutive samples.
|
|
Description
of recreation value
Blackhead Beach is a fine grain
sand beach with a small dune system. The beach supports a range of
activities, including swimming, surfing, diving and fishing. There are
also two boat launching areas through a channel.
Trend in recreational water quality over
time
There has been no significant change in
water quality at this site over time.
The SFRG for this site has remained
unchanged this season with a grading of ‘Very Good’.
|
|
|

|
|
|
Very Good
|
Historical
exceedances
|
Porangahau Beach
|
|
|
|
Porangahau
Beach (Te Paerahi) is located approximately 40 kilometres south east of
Waipukurau along SH52. There is a coastal settlement with baches, a
campground, golf course and country club. The catchment is largely
pastoral with some cropping. There are many permanent residents within
the community. The Porangahau Township is serviced by a community
sewage treatment system. There are no direct discharges in the vicinity
of the beach, the Porangahau River discharges approximately 10 kilometres
north along the beach.
Season Summary
Porangahau Beach was sampled 20
times this season 100% (20/20) of which were in green mode.
|
|
Description
of recreation value
Porangahau Beach is a fine grain
sand beach with an extensive dune system. There are also intact wetland
areas within the dune system between the coast and the estuary. The
beach is popular for swimming, fishing, diving and other recreational
activities.
Trend in recreational water quality over
time
There has been no significant change in
water quality at this site over time.
The SFRG for this site has remained
unchanged this season with a grading of ‘Very Good’.
|
|
|
|
|
|
Very Good
|
Historical
exceedances
|
Porangahau
Estuary
|
|
|
|
The
Porangahau Estuary is a high use recreational area during the summer
months. The estuary downstream is of national significance and the
largest unmodified estuary on the south-east coast of the North Island.
The estuary has a mix of sand and mud flats with a shallow intertidal
channel. The sample location is on the downstream side of the Beach Rd
bridge. The town community wastewater plant’s discharge is
upstream at Porangahau township.
Season Summary
Porangahau Estuary was sampled 20
times this season 90% (18/20) of which were in green mode, 10% (2/20) in red
mode. Both red mode exceedances followed high rainfall.
|
|
Description
of recreation value
The immediate area around the sampling
site is reserved for swimming. Boats are launched 30 m downstream of
the bridge and the jet skiing area starts from there to the sea.
Trend in recreational water quality over
time
Elevated levels of bacteria are generally
found after heavy or prolonged periods of rain, during which large quantities
of surface water can drain into the river from the surrounding catchment.
A small but significant increase was
observed in the bacterial levels in the Porangahau Estuary over time.
This indicates a decrease in water quality.
The SFRG for this site has remained
unchanged this season with a grading of ‘Very Poor’.
Further work is recommended to determine the source of faecal contamination (see
7.3).
|
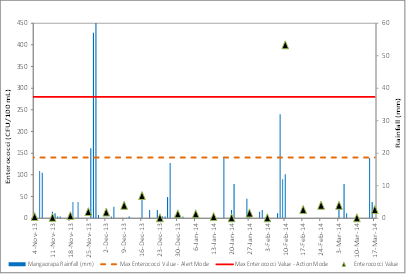
|
|
|
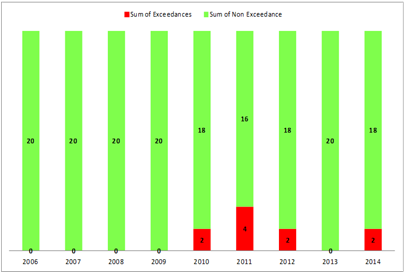
|
|
Very Poor
|
Historical
exceedances
|
Tukituki River at
SH2 Bridge
|
|
|
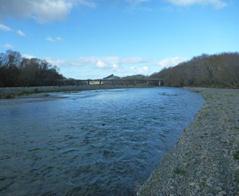
|
The
Tukituki River at SH2 site is located in Waipukurau and is a highly valued
area for the community. The river in the vicinity of the SH2 bridge is
a popular swimming location in the summer. The large catchment drains
the Ruataniwha Plains area which is predominantly pastoral agriculture and
horticulture.
Season Summary
The Tukituki River at SH2 was
sampled 20 times this season 100% (20/20) were in green mode.
|
|
Description
of recreation value
The Tukituki river is largely made up of
greywacke substrate, with cobbles in the riffles and pebbles in the
run. There is a rail bridge located at the site with a swimming hole
around the pylons. The area is used by swimmers in the summer due to
its close proximity to Waipukurau township.
Trend in recreational water quality over
time
Elevated levels of bacteria are generally
found after heavy or prolonged periods of rain causing increased surface
runoff.
A small but significant increase in
bacteria levels over time was observed. This indicates a decrease in
water quality at this site. The SFRG for this site has downgraded to
‘Very Poor’ this season with a change in the Sanitary Inspection
Category (SIC) from moderate to high risk. Further work is programmed.
|
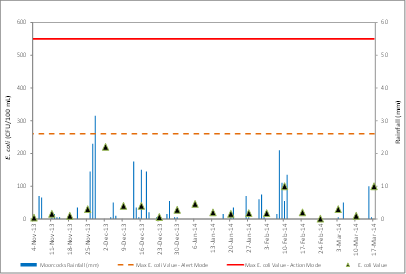
|
|

|
|
|
Very Poor
|
Historical
exceedances
|
Tukituki River at
Walker Rd
|
|
|
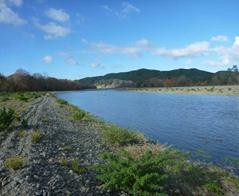
|
The
Tukituki River at Walker Road site is east of Waipawa, downstream of the
confluence of the Tukituki and Waipawa Rivers. This site is downstream
of the central Hawke’s Bay sewage discharge. The sampling site
was identified for high recreational value in the recreational usage survey
(Madarasz-Smith, 2010). This was a new site in 2010/11.
Season Summary
The Tukituki River at Walker Road
was sampled 20 times this season of which 95% (19/20) of samples were in
green mode, 5% (1/20) in amber mode.
|
|
Description
of recreation value
The Tukituki at Walker Road is a cobble
dominated site. This area is popular with fishermen and also attracts
swimmers and walkers during the summer months.
Trend in recreational water quality over
time
Elevated levels of bacteria are generally
found after heavy and prolonged periods of rain causing increased surface
runoff water to enter the river from the surrounding livestock dominated
catchment.
There has been no significant change in
water quality at this site over time.
The SFRG for this season is an interim
grading (<5yrs data) of ‘Follow up’. This conflict arise
from the low bacteria levels observed at this site, combined with the high risk
profile.
|
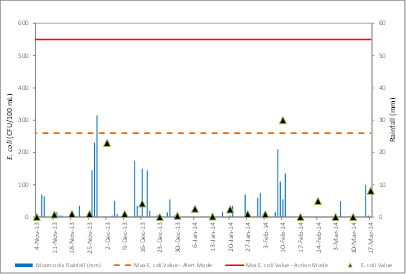
|
|

|
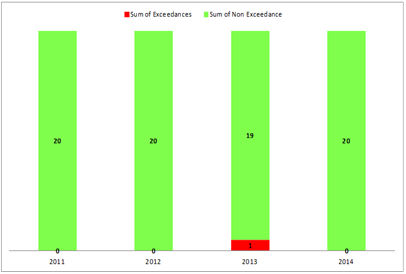
|
|
Follow up/Interim
|
Historical
exceedances
|
5 Shellfish
gathering sites
Hawke’s Bay
Regional Council also undertakes water quality monitoring at locations favoured
for shellfish gathering as part of the Recreational Water Quality
Programme. Water at popular shellfish gathering sites (see Figure‑5-1) is monitored for faecal
contamination to determine the relative risk to the public from consuming
shellfish gathered.
The MfE and MoH
guidelines (2003) stipulate that for consumption of shellfish collected from a
site to be considered safe two criteria must be met:
§ The proportion of faecal coliform
results above 43 cfu/100 mL for the season
must not exceed 10%.
§ The median faecal coliform value for
the season must not exceed 14 cfu/100 mL.
It is important to
note that monitoring for shellfish gathering is based on the water quality of
the surrounding waters, not on the shellfish themselves. Additionally, the Ministry for
Primary Industries does not recommend collecting shellfish from areas where
sewage or storm water is discharged and after heavy rain (www.foodsmart.govt.nz).
There is
some concern regarding the relevance of the current guidelines (which are based
on export standard water quality) for recreational shellfish gatherers.
Additionally, the process for issuing warnings around whether a site complies
or fails to comply with guidelines requires assessment of a full season, which
is not considered appropriate for safeguarding the health of recreational
gatherers. These concerns were addressed in a recent paper to MfE
(Bolton-Ritchie et al, 2013). Until such time that these are addressed
through a national review, Hawke’s Bay Regional Council will continue to
monitor sites in line with the current MfE & MoH, 2003 guidelines.
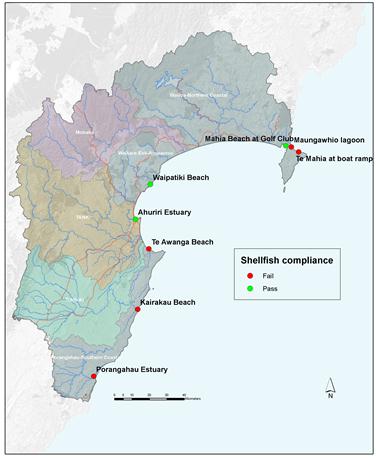
Figure‑5-1: Shellfish
monitoring sites in Hawke's Bay and levels of compliance.
Maungawhio Lagoon
|
|
|
|
The
Maungawhio Lagoon is located on the northern side of Mahia Peninsula.
The estuary is formed by the Kopuawhara Stream. The area is an
important habitat for both fish spawning and breeding and for water
birds. There is a freedom camping site here, with a public toilet and
changing room. The lagoon has been identified as a significant area in
Hawke’s Bay’s Regional Coastal Environment Plan (1999).
This site is located on a
well-known Pipi (Paphies australis) and Cockle (Austrovenus
stutchburyi) bed that receives considerable harvesting pressure
throughout the year.
Season summary
The site was sampled 20 times this season
and has
failed to comply with both criteria for safe shellfish gathering.
|
|
Maungawhio
Lagoon bacterial source
Elevated bacteria levels generally occur
during the holiday period when there is heavy loading on individual septic
systems, or during heavy rainfall in the Kopuawhara River catchment or both.
|
Long term trends
The period analysed included 5 years and
5 months during calendar years 2008 to 2014 and included 113
observations/samples.
There has been no significant change in
water quality at this site over time using the 95% confidence level.
|
|
2013-2014 season summary table
|
|
No of samples
where concentration exceeded
43 cfu/100 mL
|
8
|
|
Proportion of
samples where concentration exceeded
43 cfu/100 mL
|
40%
|
|
Median
concentration
(cfu/100 mL)
|
22
|
|
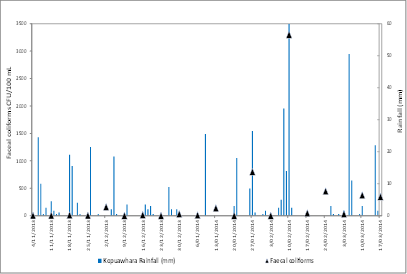
|
|
|
Season Results
|
Mahia Beach at
the golf club
|
|
|
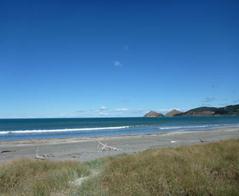
|
This
site is a dedicated shell fish monitoring area, the area falls between Mahia
Beach and Opoutama Beach recreational water quality sites.
The site is located on a
well-known Tuatua (Paphies subtriangulata) bed that receives
considerable fishing pressure during the summer months.
Season summary
The site was sampled 20 times and has passed
both guideline criteria this season for safe gathering.
|
|
Mahia
Beach bacterial source
Elevated bacterial levels generally
coincide with the holiday period when sceptic systems are overloaded or
during heavy and prolonged rainfall within the Opoutama Stream catchment.
|
Long term trends
The
period analysed included 8 years and 5 months during the for calendar years
2005 to 2014
and included 179 observations/samples.
There has been no significant change in
water quality at this site over time using the 95% confidence level.
|
|
2013-2014 season summary table
|
|
No of samples
where concentration exceeded
43 cfu/100 mL
|
1
|
|
Proportion of
samples where concentration exceeded
43 cfu/100 mL
|
5%
|
|
Median
concentration
(cfu/100 mL)
|
0.5
|
|
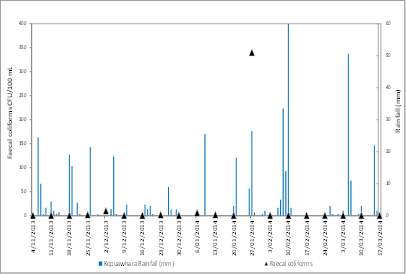
|
|
|
Season Results
|
|
Te Mahia at boat
ramp
|
|
|
|
Te
Mahia is both a recreational monitoring site (Section 4.1) and a shellfish
gathering site. The shellfish sample is taken at the boat ramp along
with the recreational water sample. Reefs at the mouth of the estuary
provide habitat for a range of shell fish.
Season Summary
The site was sampled 20 times this season
and has failed to comply with one of the criteria for safe shellfish
gathering. The bacterial values this season have also failed on the
proportion of samples above 43 Faecal coliform cfu/100 mL.
|
|
Te
Mahia bacterial source
Elevated levels of bacteria are generally
found after prolonged periods of rain causing surface water runoff into the
catchment. The catchment is largely pastoral with an area of pine and
native forest.
|
Long term trends
The period analysed included 3 years and
5 months during the calendar years 2010 to 2014 and included 76
observations/samples.
There has been no significant change in
water quality at this site over time using the 95% confidence level.
|
|
2013-2014 season summary table
|
|
No of samples
where concentration exceeded
43 cfu/100 mL
|
5
|
|
Proportion of
samples where concentration exceeded
43 cfu/100 mL
|
25%
|
|
Median
concentration
(cfu/100 mL)
|
9
|
|
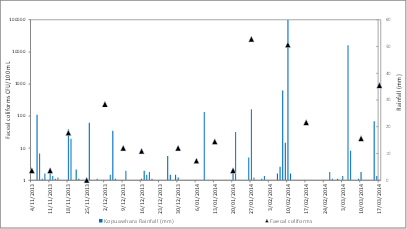
Note log10
concentration scale
|
|
|
Season Results
|
Ahuriri Estuary
|
|
|
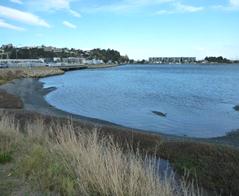
|
The Ahuriri estuary has two sample sites: one is for
recreational water quality (Section 4.2) beside the waka ama facility on
Pandora Pond. The shellfish monitoring site is on the northern side of
the estuary approximately 50 metres upstream of the Pandora road bridge The shellfish bed
receives considerable harvesting pressure throughout the year for cockles (Austrovenus
stutchburyi).
Season Summary
This site was sampled 20 times this
season and has passed both guideline criteria, however MoH does not
recommend collecting shellfish from areas subject to urban influence.
|
|
Ahuriri
Estuary bacterial source
Elevated levels of bacteria are generally
found after prolonged periods of rain cause increased surface water runoff to
enter the Ahuriri catchment.
|
Long term trends
The period analysed included 8 years and
5 months during the calendar years 2005 to 2014 and included 177
observations/samples.
There has been no
significant change in water quality at this site over time using the 95%
confidence level.
|
|
2013-2014 season summary table
|
|
No of samples
where concentration exceeded
43 cfu/100 mL
|
2
|
|
Proportion of
samples where concentration exceeded
43 cfu/100 mL
|
10%
|
|
Median
concentration
(cfu/100 mL)
|
3
|
|
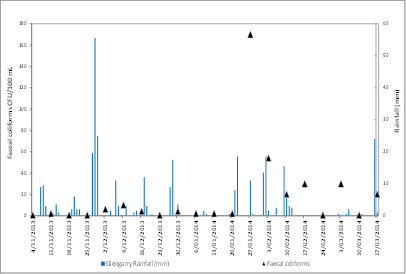
|
|
|
Season Results
|
|
Te Awanga Beach
|
|
|
|
Te
Awanga is both a recreational monitoring site (Section 4.2) and a shellfish
gathering site. The shellfish sample site is adjacent to the mouth of
the Maraetotara Lagoon and consists of a sub tidal reef structure that
harbours a community of mussels (Perna canaliculus).
Season Summary
The site was sampled 20 times this season
and has failed to comply with both guideline criteria for safe
shellfish gathering.
|
|
Te
Awanga bacterial source
Elevated levels of bacteria are generally
found after prolonged periods of rain causing increased surface water runoff
in the Maraetotara river catchment.
|
Long term trends
The period analysed included 8 years and
5 months during the calendar years 2005 to 2014 and included 179
observations/samples.
There was a small
but significant change in water quality at this site over time using 95%
confidence level. This indicated a decline in water quality.
|
|
2013-2014 season summary table
|
|
No of samples
where concentration exceeded
43 cfu/100 mL
|
9
|
|
Proportion of
samples where concentration exceeded
43 cfu/100 mL
|
45%
|
|
Median
concentration
(cfu/100 mL)
|
17
|
|
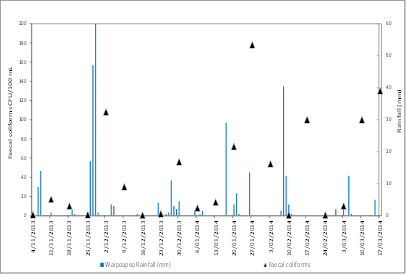
|
|
|
Season Results
|
Waipatiki Beach
|
|
|
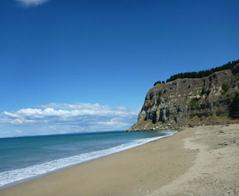
|
Waipatiki
Beach is both a recreational monitoring site (Section 4.2) and a shellfish
gathering site. The shellfish sampling site is located at the southern
end of the beach adjacent to the mouth of the Waipatiki Lagoon (section 4.2)
where reefs provide habitat for a range of shellfish.
Season Summary
The site was sampled 20 times this season
and has passed both guideline criteria for safe shellfish gathering.
|
|
Waipatiki
Beach bacterial source
Elevated levels of bacteria are generally
found after prolonged periods of rain causing increased surface water runoff
into the Waipatiki Stream catchment. The catchment is largely pastoral
and serviced by a community land irrigation sewage system.
|
Long term trends
The period analysed included 8 years and
5 months during the calendar years 2005 to 2014 and included 176
observations/samples.
There was no
significant change in water quality at this site over time using 95%
confidence level. Note: Axis scale.
|
|
2013-2014 season summary table
|
|
No of samples
where concentration exceeded
43 cfu/100 mL
|
0
|
|
Proportion of
samples where concentration exceeded
43 cfu/100 mL
|
0%
|
|
Median
concentration
(cfu/100 mL)
|
1.25
|
|
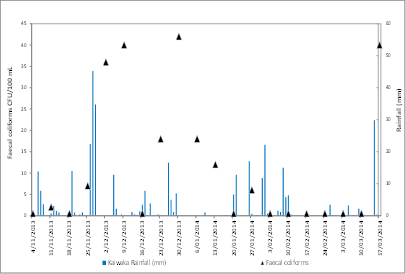
|
|
|
Season Results
|
|
Kairakau Beach
|
|
|
|
Kairakau
Beach is both a recreational monitoring site (Section 4.3) and a shellfish
gathering site. There are sub-tidal reef structures that border each
end of the beach. Shellfish gathering is popular in this area
throughout the summer months.
Season Summary
The site was sampled 20 times this season
and has failed to comply with one of the criteria for safe shellfish
gathering. The bacterial values this season have failed on the
proportion of samples above 43 Faecal coliform cfu/100 mL.
|
|
Kairakau
Beach bacterial source
Elevated levels of bacteria are generally
found after prolonged periods of rain causing increased surface water runoff
into the Mangakuri River catchment. The catchment is largely pastoral
and serviced by individual septic systems.
|
Long term trends
The period analysed included 8 years and
5 months during the calendar years 2005 to 2014 and included 177
observations/samples.
There was no
significant change in water quality at this site over time using the 95%
confidence level.
|
|
2013-2014 season summary table
|
|
No of samples
where concentration exceeded
43 cfu/100 mL
|
3
|
|
Proportion of
samples where concentration exceeded
43 cfu/100 mL
|
15%
|
|
Median
concentration
(cfu/100 mL)
|
0.5
|
|
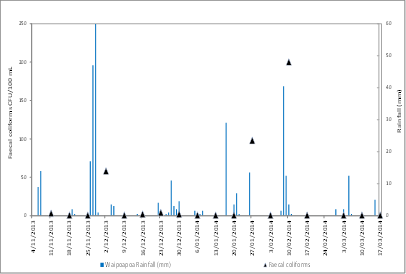
|
|
|
Season Results
|
|
Porangahau
Estuary
|
|
|
|
Porangahau
River is both a recreational monitoring site (Section 4.3) and a shellfish
gathering site. The sample location is on the downstream
side of the Beach Rd bridge. The estuary downstream is of national
significance.
There are several beds of cockles
(Austrovenus stutchburyi) in the estuary which are harvested
throughout the year.
Season Summary
The site was sampled 20 times this season
and has failed to comply with both criteria for safe shellfish
gathering.
|
|
Porangahau
Estuary bacterial source
Elevated levels of bacteria are generally
found after prolonged periods of rain causing increased surface water runoff
into the Porangahau River catchment.
|
Long term trends
The period analysed included 5 years and
5 months during the calendar years 2008 to 2014 and included 56
observations/samples.
There was a
significant change in water quality at this site over time using the 95%
confidence level indicating a decline in water quality.
|
|
2013-2014 season summary table
|
|
No of samples
where concentration exceeded
43 cfu/100 mL
|
11
|
|
Proportion of
samples where concentration exceeded
43 cfu/100 mL
|
55%
|
|
Median
concentration
(cfu/100 mL)
|
45
|
|
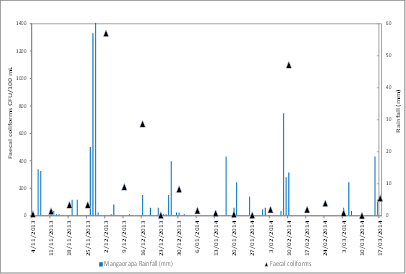
|
|
|
Season Results
|
6 Conclusions
6.1 Contact Recreational Use
6.1.1 Marine sites
Water quality in the
coastal environment throughout Hawke’s Bay is generally of a high
standard, supporting recreational usage and values. A total of 98% of samples
collected at marine sites were in the ‘Green’ mode. All beaches had performed above the two
consecutive guideline value exceedance criteria except for Opoutama beach in
Mahia, which failed this test.
6.1.2 Fresh water and estuarine sites
The freshwater and estuarine sites
also generally had good water quality, but were affected by rainfall. A
total of 94% of samples were in ‘Green’ mode. This is an
increase in compliance of 7% on last season’s results. With four exceptions (Esk River, Maungawhio Lagoon, Te
Mahia and Waipuka stream),
the water quality at all re-sampled sites had returned to ‘Green’
mode within 24 hours.
In general, water quality at
freshwater sites may be more heavily influenced by direct land-use and discharges
than marine waters. Estuarine/Lagoon areas form the receiving environment
for the entire freshwater drainage network, and slow-flowing, warmer waters can
generally harbour consistently higher numbers of bacteria than both their
freshwater and marine counterparts.
|
Recreational
Water Quality Report: Review of the 2013-14 Season
|
Attachment 1
|
6.2 Beach Grades for Hawke’s Bay Recreational Sites
|
SFRG
|
Sites
|
Comments
|
|
Very
Good
|
Aramoana
Beach
Blackhead
Beach
Kairakau
Beach
Ocean
Beach
Porangahau
Beach
Pourerere
Beach
|
Generally
large open coastal beaches of southern Hawke’s Bay with high flushing
and dilution.
|
|
Good
|
Hardinge
Rd Beach
Mahanga
Beach
Marine
Parade
Waimarama
Beach
Waipatiki
Beach
Westshore
Beach
|
Generally
urban beaches or beaches with settlements or freshwater inputs.
|
|
Fair
|
Mahia
Beach
Te
Mahia Beach/Estuary
Te
Awanga Beach
Pandora
Pond
Esk
River
Ngaruroro
River
Tutaekuri
River
|
More
work required to understand why these beaches do not have higher gradings.
More
work programmed through the TANK Plan Change process to determine sources of
faecal contamination.
Fair
grade reflects susceptibility to rainfall related contamination.
|
|
Poor
|
Maraetotara
Lagoon
Opoutama
Beach
Tukituki
River at Blackbridge
Tukituki
River at SH2
|
Generally
depositional, coastal lagoons with limited flushing and warmer temperatures.
Initial
testing results indicate land-use sources, more work required to confirm
these results.
Work
programmed to confirm source of faecal contamination. Plan Change in
process to address suspected sources.
|
|
Very
Poor
|
Clive
River
Wairoa
River
Kairakau
Lagoon
Maungawhio
Lagoon
Porangahau
Estuary
Waipatiki
Lagoon
Waipuka
Stream
Puhokio
Lagoon
Lake
Tutira
|
More
work required to determine main source of faecal contamination.
Faecal
source work has highlighted waterfowl sources, working with land management.
Manually
altered SFRG due to unpredictable cyanobacterial blooms and duck itch.
|
|
Follow-up
|
Tukituki
River at Walker Rd
|
Low
E. coli levels conflict with high risk identified potential upstream
sources.
|
6.3 Shellfish sites
6.3.1 Microbiological Quality
Three out
of the eight sites samples for shellfish gathering waters complied with
national guidelines. Ahuriri Estuary and Waipatiki Beach have complied
with guidelines for the last two years and Mahia Beach for three years.
However, the tendency for sites to fluctuate between compliance and
non-compliance year-on-year, may indicate that the current guidelines are not
accurately reflecting risk for recreational fishers.
As an urban
site subject to storm water exposure, Ahuriri Estuary would not be recommended
for shellfish gathering, irrespective of its level of compliance with the
criteria used here.
Five sites
failed to comply with national guidelines for shellfish gathering waters.
Maungawhio Lagoon, Te Awanga Beach and Porangahau Estuary failed to comply with
both the median and maximum proportion of samples exceeding 43cfu. Te
Mahia Estuary and Kairakau Beach complied with the median faecal coliform
counts, but had 10% of the samples exceeding 43cfu.
With the
exception of Kairakau Beach, all shellfish gathering sites that failed to
comply in the 2013/2014 season also failed to comply in the 2012/2013 season.
Regional
Council working groups have been working with the Ministry for the Environment
and Ministry of Health to refine the shellfish gathering guidelines to better
reflect human health concerns. However at present there is no additional
guidance, so this document reports on levels of compliance as outlined in
Microbiological Water Quality Guidelines (MfE and MoH, 2003).
6.3.2 Marine Biotoxins
It is
important to recognise that the MfE and MoH (2003) guideline concentrations
should only be applied to
microbiological contaminants of water. The guidelines do not include
guideline concentrations for marine bio-toxins, heavy metals, or other harmful organic contaminants, which may pose a significant health
risk to people consuming shellfish. MoH takes green-lipped mussel (Perna
caniliculus) flesh samples routinely on a fortnightly basis from wild
mussels gathered at Opoutama Beach, Pania Reef, and the Taikorai Rocks at
Porangahau Beach. The flesh is tested for Paralytic Shellfish Poison (total saxitoxin dihydrochloride
equivalent). Results of samples taken from these sampling sites between
November 1st 2013 and March 31st 2014 did not detect any Paralytic Shellfish
Poison in the mussel flesh. As a result no public warnings were issued in this
period advising against the consumption of wild shellfish in the Hawkes
Bay region.
6.3.3 Trends in water quality and suitability for recreation grading
The state and trends
of water quality at recreational sites are assessed by this programme in two
ways. By:
§ Statistically testing the data to determine whether any
trends over time are observed, and whether these are significant; and
§ Combining the previous five years of data with a
catchment risk assessment (SIC) to generate a ‘Suitability for Recreation
Grade (SFRG)’.
It is important to
note that the SFRG takes a risk based approach to grading, so when catchment
risks might be high, as during a sewage discharge upstream, irrespective of
actual water quality, the final grade is likely to be conservative. Additionally,
small changes in the 95th percentile of indicator data can cause
sites to change between microbiological assessment categories (MAC), causing a
change in the grading.
For the purposes of
this programme, a change to a site is considered significant if:
§ A significant statistical trend in the water quality is
observed; or
§ A change is observed in the MAC
grade, which is supported by a statistically significant trend in the long-term
water quality.
The
following table outlines trends observed in the 2013/2014 season, any changes
observed to the SFRG, and a description of the relative significance.
|
Recreational
Water Quality Report: Review of the 2013-14 Season
|
Attachment 1
|
|
Site
|
Significant statistical trend observed?
|
Change in SFRG observed?
|
Significance
|
|
Kairakau Beach
|
No
|
Improvement
|
A manual change to the catchment risk assessment better reflects
the exposed and remote nature of this site compared to more urban beaches.
|
|
Kairakau Lagoon
|
Improvement
|
Decline
|
A manual increase was made to the catchment risk assessment to
better reflect risk. This site has actually seen an improvement
in water quality but is still considered to be a high risk catchment.
|
|
Mahanga Beach
|
No
|
Improvement
|
A change in the MAC grade indicates an improvement in the water
quality category based on the 95th%ile, but no accompanying
statistically significant trend was observed.
|
|
Maungawhio Lagoon
|
No
|
Decline
|
A change in the MAC grade indicates a decline in the water
quality category based on the 95th%ile decline in the water
quality category, but no accompanying statistically significant trend was observed.
|
|
Opoutama Beach
|
No
|
Decline
|
A change in the MAC grade indicates a decline in the water
quality category based on the 95th%ile, but no accompanying
statistically significant trend was observed. Also manually altered
catchment risk assessment to better reflect risk.
|
|
Porangahau Estuary
|
Decline
|
No
|
General decline in water quality over time.
|
|
Puhokio Stream
|
Improvement
|
No
|
General improvement in water quality over time.
|
|
Te Mahia Estuary
|
Improvement
|
Improvement
|
A change in the MAC grade indicates an improvement in the water
quality category based on the 95th%ile decline in the water
quality category with an accompanying statistically significant trend
observed
|
|
Tukituki at Blackbridge
|
No
|
Decline
|
A change in the MAC grade indicates a decline in the water quality
category based on the 95th%ile, but no accompanying statistically
significant trend was observed. A manual increase was made to the catchment
risk assessment to better reflect risk
|
|
Tukituki at SH2 Bridge
|
Decline
|
No
|
General decline in water quality over time.
|
|
Waipatiki Lagoon
|
Improvement
|
No
|
General improvement in water quality over time.
|
|
Waipuka Stream
|
Decline
|
No
|
General decline in water quality over time.
|
|
Wairoa River
|
No
|
Decline
|
A manual increase was made to the catchment risk assessment to
better reflect risk
|
|
Westshore Beach
|
No
|
Decline
|
A manual increase to the catchment risk assessment better
reflect the urban nature of this beach.
|
Table 6‑2: Summary of sites with
significant trends following the 2013/14 season.
MAC
= Microbiological Assessment Category. SIC = Sanitary Assessment Category
(Catchment Risk Assessment) .
Highlighted rows
indicate where changes in the SFRG are considered significant (Green =
improvement, orange = decline).
|
Recreational
Water Quality Report: Review of the 2013-14 Season
|
Attachment 1
|
7 Further
work
The Recreational Water
Quality Monitoring programme identifies areas where water quality issues may
exist. The data and information derived from this monitoring programme
assists with the development of policy and management regimes aimed at reducing
the risks associated with recreational activities at these sites. During
the current study, several opportunities have arisen to gather further,
targeted information to support recreational objectives.
7.1 Northern Region
A reduction in the
Suitability for Recreation Grades has been observed at Opoutama Beach and
Maungawhio Lagoon. During the 2014/2015 season faecal source
tracking (faecal sterol and PCR) will be used at these sites, as well as Mahia
and Mahanga which have shown variable water quality over the last two years,
during any dry-weather exceedance events. Additionally, the influence
that vegetative strains of enterococci[1]
may be having on the indicator counts will be assessed.
7.2 Central Region
Two sites within the
central area have consistent water quality issues that may at times increase
the health risk of recreational activities. These were Clive River at SH2
Bridge and Maraetotara Lagoon/Te Awanga Beach. Faecal source tracking
will be undertaken during dry-weather exceedance events to try and ascertain
the source of the contamination. Additionally two sites along the
Tukituki River (Tukituki at SH2 and Tukituki at Blackbridge) have seen a
decrease in the SFRG over the past two-years. Faecal source tracking will
be undertaken where suitable conditions are obtained to confirm sources of
faecal contamination.
7.3 Southern Region
The Porangahau Estuary
and Puhokio Lagoon within the southern region have been identified as sites
requiring follow-up work to assess state and faecal sources to target potential
mitigation techniques.
|
Recreational
Water Quality Report: Review of the 2013-14 Season
|
Attachment 1
|
8 Acknowledgements
HBRC would like to
thank:
§ Hawke’s
Bay Public Health Board and
§ Hasting’s
District Council, Napier City Council, Wairoa District Council and Central
Hawke’s Bay District Council for their ongoing support of the
recreational water quality monitoring programme.
Victor Minter of
Wairoa District Council for taking exceedance re-samples during the holiday
period in Mahia.
Hawke’s Bay
Water Testing for ongoing support, Nessie for all of your late Monday nights.
HBRC staff that were
monitoring each week and helping with data management: McKay Dawson, Edward
Tregidga, Vicki Lyon, Sven Exeter. Post season efforts of McKay Dawson
for data management and report assistance.
|
Recreational
Water Quality Report: Review of the 2013-14 Season
|
Attachment 1
|
9 References
Gilmer, S.
(2012) Recreational Water Quality Report: Recreational Water Quality Monitoring
Programme 2011-2012. EMT 12/12
Gilmer, S.
(2013) Recreational Water Quality in Hawke’s Bay: A review of the
2012-2013 Season. EMT 13/09
Hawke’s
Bay Regional Council, (2008). Regional Coastal Environmental Plan, ISBN
1-877174-16-5.
Health Act
(1956), Shellfish Circular No 65 25 October 1956
McBride G.B,
(2005). Using statistical methods for water quality management. Issues,
Problems and Solutions. pp 313, Wiley Interscience Publication
ISBN0-471-47016-3
Madarasz-Smith,
A. L. (2010). Recreational Use of Hawke’s Bay Rivers: Results of
the Recreational Usage Survey 2010. EMT 10/22 HBRC plan no. 4209.
Ministry for
the Environment & Ministry of Health (2003). Microbiological Water
Quality Guidelines for Marine and Freshwater Recreational Areas. MfE
& MoH, Wellington.
Ministry for
Primary Industries, (2014). In Food smart elibrary. Retrieved from
http://www.foodsmart.govt.nz/elibrary/collecting_shellfish_keeping.htm
Navigation
Safety Bylaws (2012), Hawke’s Bay Regional Council. Pamphlet.
Regional
Coastal Environment Plan (2008) Hawke’s Bay Regional Council. HBRC plan
no. 4071.
Resource
Management Act 1991.