Meeting of the Hawke's Bay Regional Council
Date: Wednesday 24 September 2014
Time: 9.00am
|
Venue:
|
Council Chamber
Hawke's Bay Regional Council
159 Dalton Street
NAPIER
|
Attachments
Excluded From Agenda
item subject page
8. Adoption
of the Audited 2013-14 Annual Report
Attachment 1: HBRC
Audited 2013-14 Annual Report 2
10. Recommendations
from the Corporate and Strategic Committee
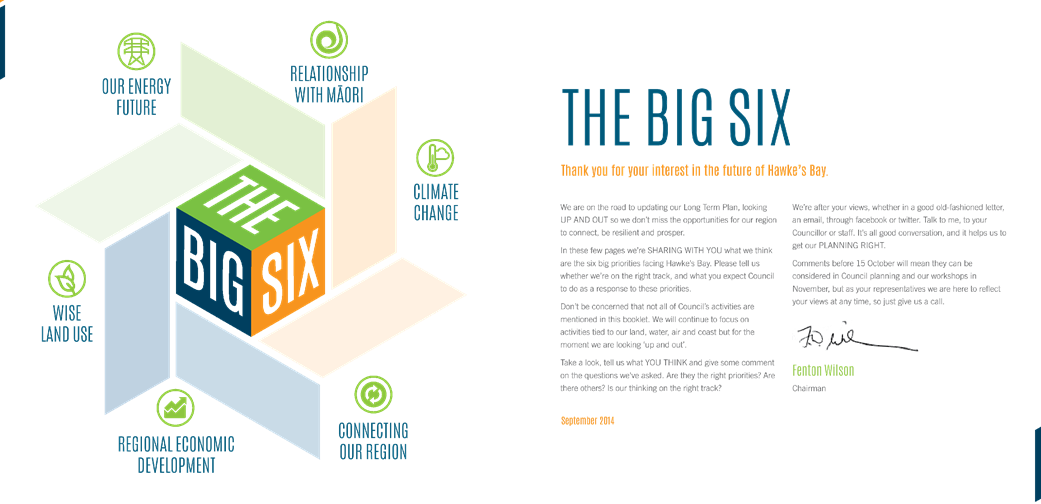
Attachment 2: The
Big Six 168
|
HBRC
Audited 2013-14 Annual Report
|
Attachment 1
|
Contents
page
Guide
to the Annual Report
Chairman
and Chief Executive Commentary
Our Direction
Reporting against The Right Debate
Report on progressive implementation of the
2011 National Policy
Statement for Freshwater Management
Report
on Maori Contribution to Council Decision-making Processes
Regional
Planning Committee
Maori
Committee
Direct
Hapu and Other Involvement
Report
on Council Controlled Organisations
Statement
of Compliance and Responsibility
Independent
Auditor’s Report
Financial
reporting benchmarks
1.
Rates affordability benchmark
2.
Debt Affordability Benchmark
3.
Balanced Budget Benchmark
4.
Essential Services Benchmark
5.
Debt Servicing Benchmark
6.
Debt Control Benchmark
7.
Operations Control Benchmark
Statement
of Service Performance for Groups of Activities
page
Strategic
Planning
Activity 1 – Economic Development
Activity 2 – Strategy and Planning
Activity 3 – Policy Implementation
Activity 4 – State of the Environment
Monitoring
Land
Drainage and River Control
Activity 1 – Flood Protection and
Drainage Schemes
Activity 2 – Investigations &
Enquiries
Activity 3 – Sundry Works
Regional
Resources
Activity 1 – Land Management
Activity 2 – Air Management
Activity 3 – Water Management
Activity 4 – Coastal Management
Activity 5 – Gravel Management
Activity 6 – Open Spaces
Regulation
Activity 1 – Resource Consent
Processing
Activity 2 – Compliance Monitoring
Activity 3 – Maritime Safety &
Navigation
Activity 4 – Building Act
Implementation
Biosecurity
Activity 1 – Regional Biosecurity
Programmes
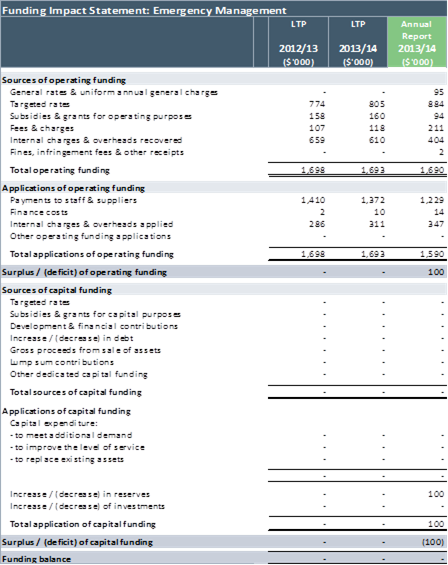
Emergency
Management
Activity 1 – HB Civil Defence
Emergency Management Group
Activity 2 – Hazard Assessment &
Hawke’s Bay Regional Council
Response
page
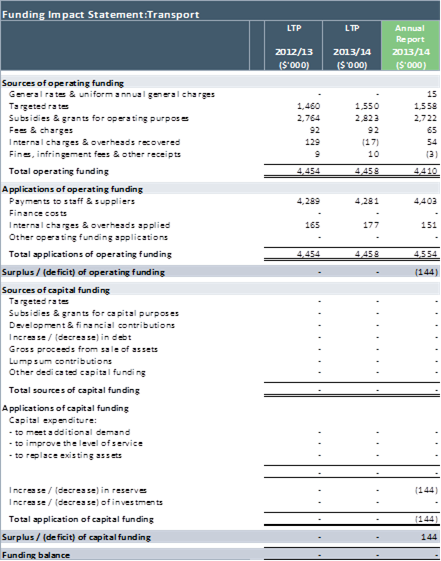
Transport
Activity 1 – Regional Road Safety
Activity 2 – Regional Land Transport
Strategy
Activity 3 – Subsidised Passenger
Transport
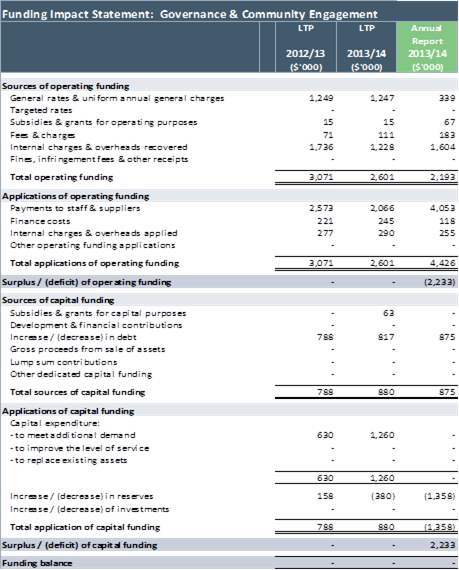
Governance
and Community Engagement
Activity 1 – Community Partnerships
Activity 2 – Community Engagement
& Communications
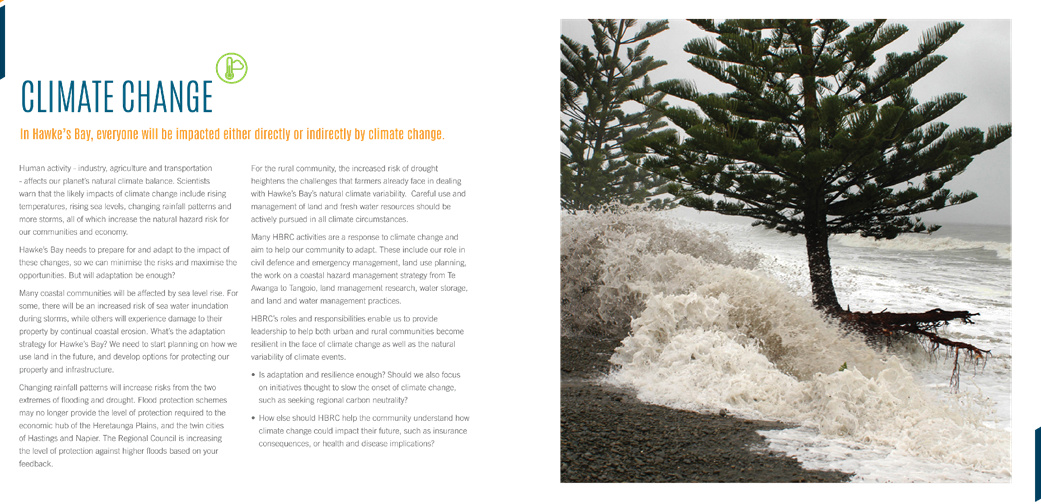
Activity 3 – Response to Climate
Change
Activity 4 – Community Representation
& Regional Leadership
Activity 5 – Investment Company
Support
Financial
Statements
Comprehensive Income Statement
Statement of Changes in Equity
Balance Sheet
Statement of Cash Flows
Notes
to the Financial Statements
Note 1: General Information
Note 2: Summary of Significant
Accounting Policies
Note 3: Groups of Activities Revenue
& Expenditure
Note 4: Rates Revenue
Note 5: Other Revenue
Note 6: Fair Value Gains & Losses
Through the Income Statement
Note 7: Expense Disclosures
Note 8: Income Tax Expense
Note 9: Property, Plant &
Equipment
page
Note 10: Infrastructure Assets
(Parent & Group)
Note 11: Investment Property
Note 12: Intangible Assets
Note 13: Financial Assets
Note 14: Forestry Assets
Note 15: Trade & Other Receivable
Note 16: Derivative Financial
Instruments
Note 17: Cash & Cash Equivalents
Note 18: Fair Value Reserves
Note 19: Other Reserves (Parent &
Group)
Note 20: Borrowings
Note 21: Deferred Income Tax (Group)
Note 22: Employee Benefit Liabilities
Note 23: Trade & Other Payables
Note 24: Provisions for Other
Liabilities and Charges
Note 25: Related-Party Disclosures
(Group)
Note 26: Commitments &
Contingencies
Note 27 Local Government Act 2002
Disclosures
Note 28: Major Budget Variances (Parent)
Note 29: Financial Risk Management
Note 30 Non-current assets held for sale
Note 31 Events After Balance Sheet Date
(Parent & Group)
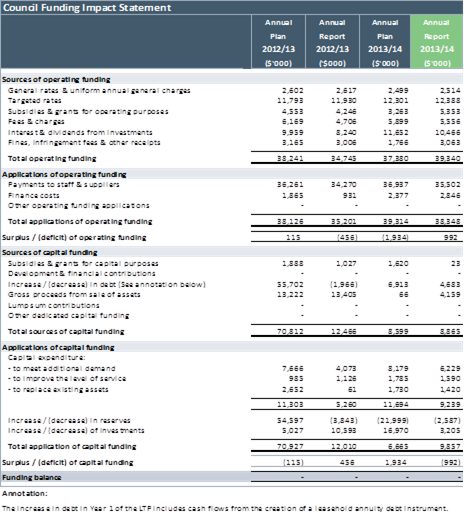
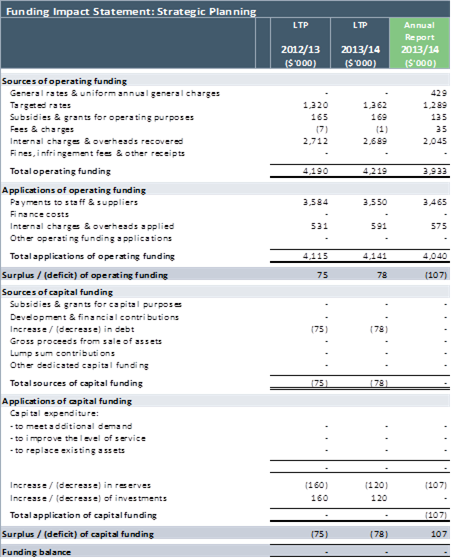
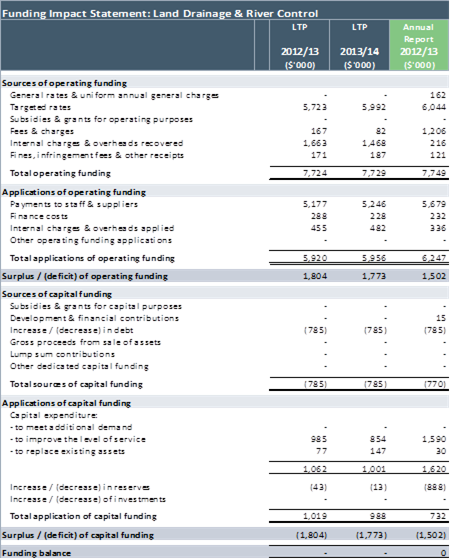
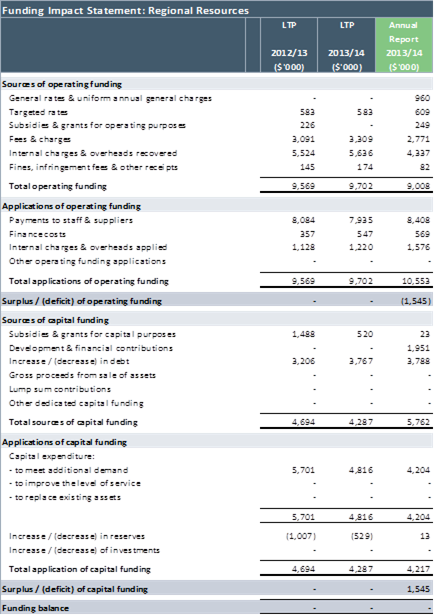
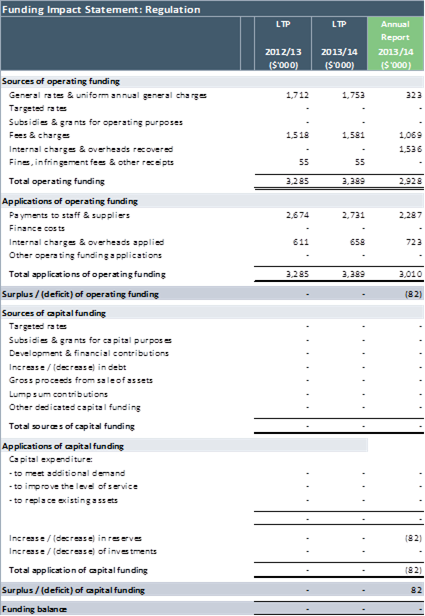
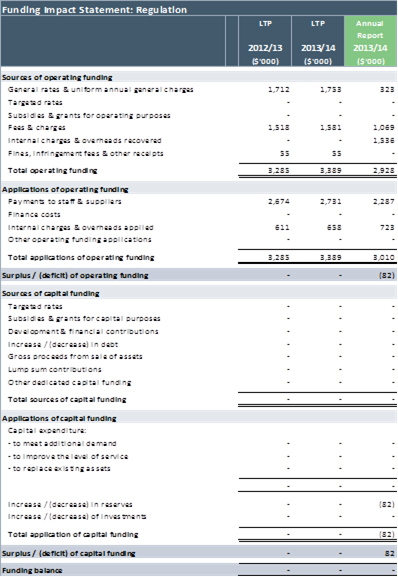
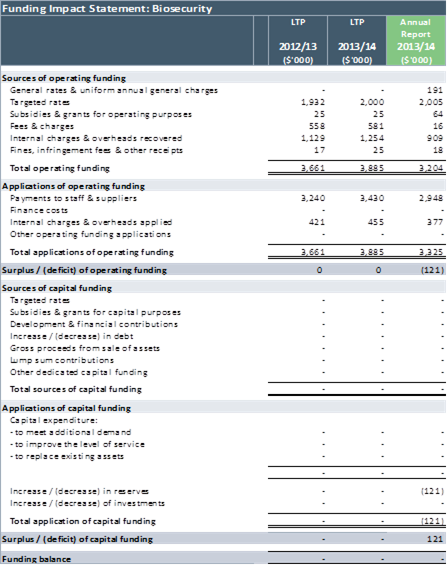
Funding Impact Statements for Groups of Activity
General
Information
About
Hawke’s Bay Regional Council
Appendix
A: Key Implementation milestones and
activities for the
National Policy Statement for Freshwater Management
|
HBRC
Audited 2013-14 Annual Report
|
Attachment 1
|
Our
Purpose
Hawke’s Bay Regional
Council has a long term focus and exists due to our role in:
· Natural resource management and governance;
· Natural hazard assessment and mitigation;
· Regional strategic planning (including provision of statutory
plans such as the regional policy statement); and
· The provision and assessment of regional scale infrastructure,
notably flood risk assets, regional logistics facilities such as Napier Port
and water storage.
Our Vision
A region with a vibrant
community, a prosperous economy, a clean and healthy environment, now and for
future generations.
Our Values
Excellence – we aim high and take pride in providing an exceptional
service
Forward
thinking – We anticipate and
prepare for the future
Innovation – We are open to change and seek new ways of doing things
Integrity – We demonstrate openness, honesty and respect in our
relationships
Partnerships
– We build strong partnerships to achieve common goals
Our Goals
We have adopted three
goals for the region – a vibrant community, a prosperous
economy, and a clean and healthy environment.
These goals are a bridge
between our vision, our community outcomes and our group of activity work
programmes. All of our work should meet the definition of at least one of our
goals; if not, we should not be doing the work. However much of our work
meets all three goals.
“A clean and
healthy environment” is the most strategic of the goals and underpins
the success of the others. Without a good environment our community will not
enjoy living in the region and prosperity may be hard to achieve.
Guide to the Annual Report
The Annual Report is
divided into three sections to make it easy to find the information you want.
· Performance Overview
This includes an
Introduction from the Chairman and the Chief Executive along with an update on
key issues.
· Accountability Information
This section includes:
- The
Statement of Service Performance for the year and an overview of each Group of
Activity
- How
each Group of Activity links to the community outcomes
- A
report which measures the performance of each sub-activity
- Financial
details for the Regional Council for the year to 30 June 2014 and for the Port
of Napier Limited for the 12 months to 31 March 2014, which together make up
the Group accounts.
· General Information
This section includes
general information about Council's resources, assets and activities, the
Councillors, the organisational structure, and an outline of information
available for public use.
|
HBRC
Audited 2013-14 Annual Report
|
Attachment 1
|
Chairman and Chief Executive Commentary
Kia ora. This Report
summarises the work of Hawke’s Bay Regional Council (HBRC) during year two of HBRC’s Long Term Plan 2012 – 2022.
In The Right
Debate section of the Long Term Plan 2012-22 (the LTP), we highlighted the big
issues facing Hawke’s Bay and explained how HBRC would address these
– this decade – along with their associated financial calculations.
In the twelve
months to year end 30 June 2014, HBRC has made good progress on our major
projects, with continuing focus on the delivery of our day-to-day operational
activities.
Our Direction
Our Long Term Plan is based on the overall
direction set down in HBRC’s 2011 Strategic Plan. The Hawke’s
Bay Strategic Plan identified HBRC’s business as:
· Natural resource management and governance
· Natural hazard assessment and mitigation
· Regional strategic planning
· Provision and assessment of regional scale infrastructure and
services.

Tukituki River.
Reporting against ‘The Right Debate’ key issues
The following pages are a
summary of HBRC’s achievements over the last reporting year, in the key
areas identified in The Right Debate section of HBRC’s 2012-22 Long Term
Plan.
Natural resource management and governance
Tukituki Catchment Proposal (TCP) – this is both Plan
Change 6 and resource consents for a $260 million water storage scheme on the
Ruataniwha Plains. TCP was called-in by the Minister for the Environment and
the Minister of Conservation and was heard by an independent Board of
Inquiry. The Board issued its final decisions on 26 June 2014. Plan
Change 6 introduces new requirements for water and land use and requires
significant council input and focus, irrespective of whether or not the water
storage scheme goes ahead.
|
Hill
Country Afforestation –
in the LTP, HBRC approved a provision of $47 million for investment in hill
country afforestation. We based this on partnerships to promote afforesting
the steepest and least productive parts of land, in return for carbon credit
revenue. However, 2012’s collapse of carbon pricing
|
|
|
saw
this proposal parked. HBRC has instead investigated alternative funding
sources and incentives to help establish trees on farms, to complement
livestock and agricultural systems and protect the environment.
A
key part of this is our work in the High Performance Manuka Primary Growth
Partnership. The goal of this PGP is to deliver significant increases
in investment returns for Unique Manuka Factor (UMF) honey. HBRC seeks to
show how these returns can be delivered through its manuka trial at Lake
Tūtira, as a viable alternative to pasture on steep erodible hill
country. Results on this trial are expected by 2018.
|
Regional Landcare Scheme (RLS)
– HBRC funds the RLS at $880,000 per annum,
with criteria to make sure the funding is distributed to priority focus areas.
The RLS is targeted to support catchments where objectives must be met under
regional plans, linked to the National Policy Statement for Freshwater.
|
HeatSmart –
air quality in the Napier and Hastings air sheds each winter still
doesn’t meet government standards required by 2016.
However, HBRC’s programme is helping the region
move to compliance with healthier homes and improved health
|

|
outcomes.
Our programmes have delivered a total of 5,158 Clean Heat packages, including
2,490 in the 13-14 financial year. 2,023 assistance packages for
Insulation have been delivered, including 372 in the 13-14 financial year.
Ngaruroro Water Storage
Investigations –
HBRC made provision of $27 million for a possible equity stake in a water
storage scheme in the Ngaruroro catchment. However, full feasibility
investigations were deferred by HBRC, awaiting the completion of more economic
assessment work and the availability of staff after completing the Ruataniwha
Water Storage process.
Strategic
Alliances
– HBRC has made good progress in this area, in
particular:
1. The
Regional Planning Committee has equal representation from elected councillors
and treaty claimant groups, making important policy development decisions. They
met four times during the year and typically consider a range of natural
resource related issues, recorded in more detail following this commentary.
2. The
Nature Central alliance with the Department of Conservation and two other
regional councils is continuing, with focus on seven core projects including
wide-scale pest and predator control.
Natural hazard assessment and mitigation
|
Civil Defence and Emergency
Management (CDEM) – in
early 2014 the Hawke’s Bay CDEM Group completed a new strategic plan which
incorporates the results of a capability report completed by
the Ministry of Civil Defence and Emergency Management and lessons from
the Canterbury earthquakes. This Plan identifies the work needed to
make our community more resilient and is endorsed by all of Hawke’s
Bay’s councils. This year the Group has commenced a review to
ensure it has the resources and structure to implement this Plan over the
next 5 years.
|
|
Regional
Natural Hazards, Research & Planning –
a joint project has been commissioned to review the
potential for liquefaction in Hawke’s Bay. This includes the
development of a geo-technical database, following the success of the
Canterbury Geotechnical Database (CGD). Canterbury Earthquake Recovery
Authority (CERA) and Tonkin & Taylor with GNS Science have supported the
expansion of the CGD for use in Hawke’s Bay, with a view to expanding it
to the rest of New Zealand in future. Work continues on a change to the
Regional Policy Statement to implement a risk based approach, and strengthen
the requirement for local authorities to consider the impacts of natural
hazards when considering land use changes.
Makara Dam –
was deconstructed due to storm damage and rebuilt. Following a Special
Consultative Process and Hearing, HBRC decided to reinstate
the No 1 dam and also provide for a de-silting programme. The cost of repair
work was $1,262,000. 60% was funded from the Regional Disaster Reserve and the
remainder from Scheme funds, including a loan.
Regional strategic planning
Urban Growth Planning
– HBRC, in conjunction with Napier City and Hastings District councils,
completed the Heretaunga Plains Urban Development Strategy (adopted in August
2010), with urban containment being a principal philosophy. This led to the
development and processing of Plan Change 4 – Managing the Built Environment
to the Regional Policy Statement. Change 4 became operative on 1 January
2014. An Implementation Committee for the Strategy has since been established.
Regional Economic Development
– benefitted from a targeted rate as part of the LTP process. Support
continued for business growth and attraction in the region through Business
Hawke’s Bay. Hawke’s Bay’s business allocation of research
and development funding through Callaghan Innovation’s Regional Partner
programme again exceeded annual targets. A focus on primary sector
resilience was assisted through a number of Ruataniwha water storage related
initiatives as well as engagement with other primary and processing sector
organisations. HBRC continued to represent the region’s interests
at both at a regional economic development agency and central government level.
In addition to funding economic research and reports, we have also played a
role in select issues such as the Napier-Gisborne rail link, and oil and gas
exploration.
Report on
progressive implementation of the 2011 National Policy Statement for Freshwater
Management
Freshwater is one of our
region’s most precious natural resources and much of the Regional
Council’s work revolves around it. In May 2011, the Government
introduced the National Policy Statement for Freshwater Management
(NPSFM). The NPSFM sets a new direction for maintaining and improving
water quality and protecting life in our rivers, lakes, streams and
aquifers. It is mostly HBRC’s responsibility to implement NPSFM as
it relates to our region. NPSFM does not specify exactly how it shall be
implemented, or how policy statements and plans should be amended, which is for
each regional community to determine for themselves.
In September 2012, HBRC adopted an
Implementation Programme in line with Policy E1 of NPSFM. The Programme
outlines key actions that council will undertake to fully implement NPSFM.[1] Policy E1[2] of NPSFM
requires that council give an annual report on the degree to which the
Programme has been implemented. The Programme does not start from a blank
canvas. Even prior to NPSFM coming into effect, the Regional Council had
significant elements in place that align with and give effect to NPSFM. Some
of those key elements were identified in NPSFM’s Implementation
Programme.
Following is a
brief outline of council’s key implementation achievements during
2013-14. Appendix A gives a fuller description of these achievements and
several other activities to implement NPSFM.
During the 2013-14
period, the Regional Council:
1. Completed
the RMA process for Regional Policy Statement Change 4 (Managing the Built
Environment) when Change 4 was made operative on 1 January 2014.
2. Continued
Environment Court-assisted negotiations on four appeals against Change 5 (land
and freshwater management) to the Regional Resource Management Plan.
3. Presented
its evidence to the Board of Inquiry hearing the Tukituki Catchment Proposal
(Plan change 6 and HBRIC’s applications for the Ruataniwha Water Storage
Scheme). The Board issued its final decisions on the proposal in June
2014.
4. Assessed
a variety of resource management policy options through council’s
Regional Planning Committee, for catchments including the Mohaka River and the
Greater Heretaunga / Ahuriri catchment area.
5. Achieved
100% compliance with the first phase of the transitional Resource Management
(Measurement and Reporting of Water Takes) Regulations 2010 and is on track to
achieve phase two by the November 2014 timeframe.
6. Facilitated
the establishment of key water user groups to work towards efficient water use
through alternative water management options, including groups in the
Ngaruroro, Ruataniwha and wider Tukituki catchments.
7. Continued
co-ordination and facilitation of interest groups for preparing regional plan
changes in the Mohaka Catchment and Greater Heretaunga / Ahuriri catchment
area.
8. Supported
a sector-wide submission by Local Government NZ on proposed amendments to
NPSFM.
Biodiversity – has
seen significant progress being made on the final strategy document with strong
support from our partners. The Biodiversity Strategy Steering Group is
supported by a Core Working Group and expects to deliver the regional Strategy
for consultation towards the end of 2014.
Provision and assessment of regional scale infrastructure and
services
Ruataniwha Water Storage Scheme
(RWSS) – is complementary to
the Tukituki Catchment Proposal. After receiving independent advice on
investment risk, and hearing community views through a public consultation
process, council’s investment company recommended that HBRC proceed to
invest in RWSS.
Council
subsequently agreed on the important decision of funding up to $80M as an
equity stake in the proposed subsidiary company to run RWSS. The key
consideration ahead will be to decide if the scheme should proceed to
implementation at the point of ‘financial close’, anticipated to be
during 2015.
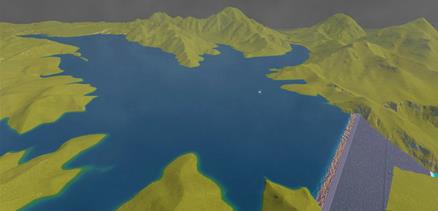

A concept image of the proposed Ruataniwha Water Storage
reservoir, © OHL-Hawkins.
|
Regional Parks Network
Plan – was adopted by
Council in November 2013. Individual park plans have subsequently been
initiated to help protect, maintain and enhance the community’s popular
regional park assets.
Public Transport
– numbers increased for the second year running , with
total passenger trips reaching a record high of 799,845; a 5%
increase on the 2012-13 year.
|
|
Operational Efficiency – is an ongoing area of focus for HBRC. Numerous other operational activities that fall under HBRC’s
management responsibilities continued, with an eye on delivering public
services, infrastructure and regulation efficiently and effectively.
Financial Reporting Benchmarks
This
is the first year of Council reporting on a series of financial performance
benchmarks which include rates affordability, debt affordability, balanced
budget and others. Our reporting of actual performance against the
targets set out in council’s Long Term Plan will be reported and
commented on. These new reporting measures are in line with Local
Government (Financial Reporting and Prudence) Regulations 2014.
To
help understand the extent to which council has been able to deliver on the
financial benchmarks against targets in the Long Term Plan, please refer to the
charts presented in the first part of this Annual Report.
Lastly
Overall, it has been a busy and
fulfilling year for HBRC, working across a range of stakeholder and community
groups, addressing activities that will in time have either national, regional
or local-scale effects for the wellbeing of our Hawke’s Bay community.
Liz Lambert, Interim Chief
Executive
Fenton Wilson, Chairman
|
HBRC
Audited 2013-14 Annual Report
|
Attachment 1
|
Report
on Maori Contribution to Council Decision-making Processes
Clause 35 to Schedule 10
of the Local Government Act 2002 requires Council to include in its annual
report a report on the activities that Council has undertaken in the year to
establish and maintain processes to provide for opportunities for Maori to
contribute to Council’s decision-making processes.
Regional Planning Committee
The Regional Planning Committee was
established in April 2012 to consider and provide recommendations to Council on
resource management and strategic environmental planning. The Committee
is made up of an equal number of Regional Councillors and representatives from
each of the Hawke’s Bay Treaty Settlement Claimant groups. The
Committee is chaired under a dual chairmanship arrangement. The current
Co-chairs are the Regional Council Chairman and Mr Toro Waaka, the Ngati
Pahauwera representative on the Committee. Having been permanently
established by the Council, the Committee is not dissolved every three years
while local body elections take place. This enables the Committee and in
particular the Treaty Settlement Claimant groups, to undertake long term
planning spanning multiple years. Since forming, the Committee has worked
together without a formal Government mandate, pending the passage of
legislation. They operate under the principles of co-governance to ensure
that tāngata whenua are active decision makers in managing their taonga
under the Resource Management Act 1991.
The Committee met formally four times
between July 2013 and June 2014 to consider issues and make recommendations to
the Regional Council. There have been a number of multi-year projects and
items that the Committee has considered this year, these are:
· Taharua/Mohaka
Catchment Policy Development and Stakeholder Engagement
· Change 5 (Land and
Freshwater Management) appeals
· Draft annual report
for national policy statement (NPS) freshwater management implementation
programmes
· Resource Management
Reform
· Greater
Heretaunga/Ahuriri Catchment Plan Change
· Local Government
Reorganisation
· Change 6 (Tukituki
River Catchment) Draft Board of Inquiry Decision
· Intergovernmental
Panel on Climate Change Working Group presentation
Three members are accredited Resource
Management Act hearing commissioners.
Maori
Committee
There have been 5 two-monthly meetings
of the Maori Committee during the year. There were twelve tangata whenua
appointees on the committee as well as four elected representatives of Council.
Two members of the Maori Committee
were appointed to the Environment and Services Committee of Council, which met
on 5 occasions during the year.
Two Maori Committee representatives
have been appointed to the Corporate and Strategic Committee, which met on 4
occasions during the year.
The Chairman of the Council’s
Maori Committee has attended 17 meetings of the Regional Council where he has
speaking rights on all issues.
The Maori Committee is also
represented on the Hearings Committee, with three members being accredited
Resource Management Act hearing commissioners.
Members of the Council’s Maori
Committee are informed of all consent applications and can request further
information and provide comment as well as assist with directing Council
officers to the correct tangata whenua for consultation or other issues.
Direct Hapū and Other Involvement
Council has continued to have direct
interaction with specific hapu on issues of concern to them within their rohe.
The Chairman of the Maori Committee
has attended numerous hui involving Marae and hapu of specific interest groups
on behalf of the Regional Council.
|
HBRC
Audited 2013-14 Annual Report
|
Attachment 1
|
Report
on Council Controlled Organisations
Introduction
The Local Government Act 2002 (Act)
requires the Council to include in its annual report certain information on
each council-controlled organisation in which the Council is a shareholder or
has the power to appoint directors, or members of the governing body of the
organisation.
The Hawke’s Bay Regional Council
has such a relationship with one council-controlled organisation namely
Hawke’s Bay Regional Investment Company Limited (HBRIC Ltd). This report
sets out below the information required by clause 28 of Schedule 10 to the Act.
Ownership and Control Policies
Council is required to report on the
implementation or attainment of any significant policies and objectives in
regard to ownership and control of council-controlled organisations during the
year.
During this year there have been no
changes to the ownership of HBRIC Ltd, however changes have been made to the
company’s governance arrangements.
In December 2013, Council resolved to
appoint two new Independent Directors to replace the three Councillor Directors
and Managing Director on the HBRIC Ltd Transition Board. It is intended that
the Transition Board be replaced with an ongoing Board after the date of financial
close for the Ruataniwha Water Storage Scheme which is anticipated to be in the
second half of the 2014/15 financial year.
Nature and Scope of Activities
Council is required to compare the
nature and scope of the activities intended to be provided by council-controlled
organisations (as set out in the Long Term Plan 2012-22) with the actual nature
and scope of activities provided for the year.
The summary of the nature and scope of
activities below is illustrative of the key performance targets for HBRIC Ltd
set by Council which are:
That HBRIC Ltd is to actively manage
its allocated investment portfolio and any new investment it makes to ensure:
1. Growth
in long term shareholder value
2. Increased
financial and strategic returns
3. Investments
are secure and sustainable over the long term
4. Investments
will assist achievement of Council’s regional strategic development
objectives.
A summary of the nature and scope of
activities intended to be provided by HBRIC Ltd (as set out in the Long Term
Plan 2012-22) compared to the actual nature and scope of activities provided
for the year are as follows.
· Own
and manage the investment assets and liabilities transferred to it by Council
from time to time.
- HBRIC
Ltd continued to manage the investment in the Napier Port following the
transfer of shares from Council on 25 June 2012.
- On
31 October 2012 the feasibility assets of the Ruataniwha Water Storage Scheme
were transferred from Council to HBRIC Ltd along with responsibility for
progressing the project to the conclusion of the resource consent application
phase. HBRIC Ltd continued to manage this investment through this phase which
is anticipated to conclude in the second half of the 2014/15 financial year.
· Make
new investments and dispose of current investments in pursuit of its
objectives.
- The
continued investment in the development phase of the Ruataniwha Water Storage
Scheme has been made in pursuit of HBRIC Ltd’s objectives.
·
Investment in and manage a range of financial and physical assets in accordance
with Council’s investment policy detailed in the Long Term Plan 2012-22.
- HBRIC
Ltd has managed its investments in accordance with Council’s investment
policy detailed in the Long Term Plan 2012‑22.
· Raise
funds for investment but at no time by selling any of Council’s 100%
shareholding in HBRIC Ltd or Napier Port without Council undertaking a special
consultative process.
- No
funds were raised for investment in the current year.
· Assist
its subsidiary and associated companies to increase shareholder value in
regional prosperity through growth and investment.
- The
HBRIC Ltd Board meets with the Napier Port Chairman and CEO on a quarterly
basis to discuss its operating activities and any investment opportunities that
have the potential to increase shareholder value.
Other Key Performance Targets
Comparison of actual specific
financial performance targets compared to those set out in the Long Term Plan
2012-22 are outlined in the table following.
|
Initial Performance Targets
|
|
Performance
Indicator
|
Target
|
Actual
|
|
Net debt to net debt plus Equity
|
<40%
|
26%
|
|
Interest cover (EBIT/Interest Paid)
|
>3x
|
6x
|
|
EBITDA/Total Assets
|
13%
|
11%
|
|
Return on Shareholders’ Funds
|
5%
|
8%
|
|
Notes: EBIT = Earnings
Before Interest and Tax
EBITDA = Earnings Before Interest, Tax, Depreciation and Amortisation
Net debt means gross borrowings from outside the “HBRIC Ltd
“group”,
less loans made to parties outside the HBRIC Ltd “group”
|
Statement of Compliance and Responsibility
Compliance
1. The
Council and management of Hawke's Bay Regional Council confirm that all the
statutory requirements of the Local Government Act 2002, in relation to the
annual report, have been complied with.
Responsibility
2. The
Council and management of Hawke's Bay Regional Council accept responsibility
for the preparation of the annual Financial Statements and the judgements used
in them.
3. The
Council and management of Hawke's Bay Regional Council accept responsibility
for establishing and maintaining a system of internal control designed to
provide reasonable assurance as to the integrity and reliability of financial
reporting.
4. In
the opinion of the Council and management of Hawke's Bay Regional Council, the
annual Financial Statements for the year ended 30 June 2014 fairly reflect the
financial position and operations of Hawke's Bay Regional Council.
Fenton
Wilson Liz
Lambert Paul
Drury
Chairman Interim
Chief Executive Group
Manager
Corporate
Services
24
September 2014 24
September 2014 24
September 2014
|
HBRC
Audited 2013-14 Annual Report
|
Attachment 1
|
|
HBRC
Audited 2013-14 Annual Report
|
Attachment 1
|
Financial
Reporting Benchmarks
The purpose of the
statement set out below is to disclose the Council’s financial
performance in relation to various benchmarks to enable the assessment of whether
the Council is prudently managing its revenues, expenses, assets, liabilities,
and general financial dealings.
These new reporting
measures are set out in the Local Government (Financial Reporting and Prudence)
Regulations 2014. This legislation is prescriptive as to the format and
content of the benchmarks to be reported on.
1. Rates
affordability benchmarks
“The Council meets
the rates affordability benchmark if:
- its
actual rates income equals or is less than each quantified limit on rates; and
- its
actual rates increases equal or are less than each quantified limit on rates
increases.”
(A) Rates Income Affordability Benchmark
The
following graph compares the Council’s actual rates income with a
quantified limit on rates contained in the financial strategy as included in
Council’s long term plans. The quantified limit used in the graph
below uses dollars as unit for measurement for budgeted and actual rates.
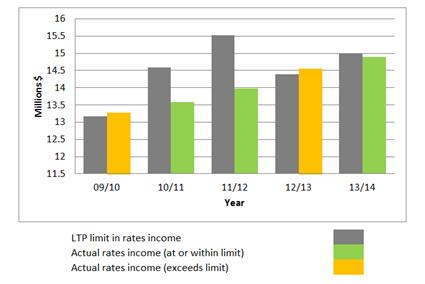
2009-10
(Exceeds Limit by $106,000)
The marginal
increase in actual rates over that level planned relates to additional rating
units (properties relating to new housing developments etc) being added to the
rating database when the Council sends out the rates assessment during October
of each year. The rating income as included in the Long Term Plan uses as
a basis, the rating units on the database at the time of the development of the
Plan which is February/March of each year.
2010-11
(Below Limit by $1,009,000)
The reasons for
actual rates being below the level set out in the Long Term Plan were due to:
- It
was assumed that $218,000 of the science expenditure would be collected from a
targeted rate. The Council actually collected these funds by a section 36
charge on water consent holders.
- It
was assumed the Council would collect $250,000 through a targeted rate for
nutrient stripping developments in the Tukituki valley. This targeted
rate was not implemented.
- The
subsidised passenger transport rate proposed in the 10 Year Plan 2009-2019 was
decreased by $478,000 because the New Zealand Transport Authority was not in a
position to support the proposed additional services.
2011/12
(Below Limit by $1,549,000)
The reasons why
actual rates were below the limit set in the Long Term Plan are as below:
- Most
of the reasons for the variation actual to budget are provided above under the
reasons for 2010/11. Further, the 10 Year Plan 2009-2019 provided in the
2011/12 year for an additional $231,000 of water science expenditure to be
collected as a targeted rate. This further amount was also collected by a
section 36 charge on water consent holders.
- There
was a decrease in general rates of $124,000 due to efficiencies made in
Council’s operations resulting in decreased costs.
2012/13
(Exceeds Limit by $152,000)
Please refer to the
explanation given in 2009/10 above as the same principle applies.
2013/14
(Below Limit by $76,000)
For this year rates
did not exceed the limit - the decrease being due to Council resolving to
achieve expenditure reductions and limit the rates increase to the level of
increase in inflation.
(B) Rates Increases Affordability Benchmark
The following graph
compares the Council’s actual rate increase with the quantified limit on
rate increases included in the financial strategies in Council’s long
terms plans. The quantified limit included in this graph as a unit of
measurement is percentage increase in rates from the previous financial year.
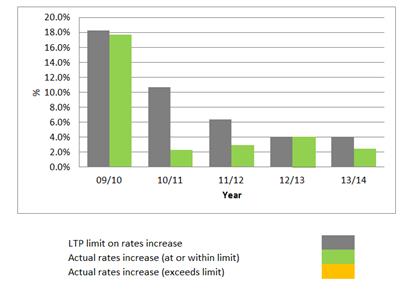
The explanations
for explaining the variances for each of the years when comparing the budgeted
percentage increase in rates as compared to the actual increase in rates are
consistent with the explanations as provided in the preceding graphs on Rates
Income Affordability.
2. Debt
Affordability Benchmark
“The Council
meets the debt affordability benchmark if its actual borrowing is within each
quantified limit on borrowing.”
The financial
strategy included in Council’s Long Term Plan set out two quantified
limits on borrowing as below:
a) Total
interest expense on external public debt (including lease annuity) will not
exceed 25% of total annual operating expenditure.
b) Council
loan funding will not exceed a debt to debt equity ratio of 28%.
Graphs are provided
below for each of these borrowing limits.
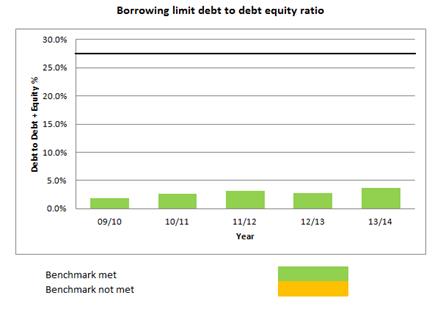
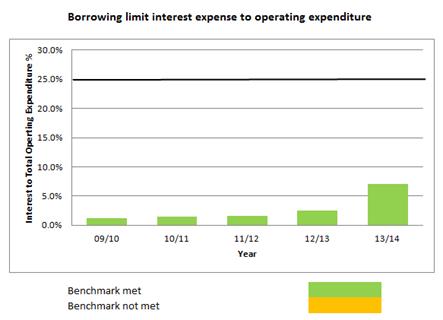
The above graphs
establish that each of the five years presented are well within the borrowing
limits.
3. Balanced
Budget Benchmark
“The Council
meets this benchmark if its revenue equals or is greater than its operating
expenses.”
The following graph
displays the Council’s revenue (excluding development contributions), financial
contributions, vested assets, gains on derivative financial instruments, and
revaluations of property, plant, or equipment, as a proportion of operating
expenses (excluding losses on derivative financial instruments and revaluations
of property, plant or equipment).
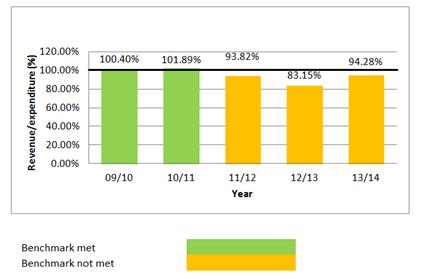
In the three years
2001/12, 2012/13 and 2013/14 where Council has not achieved a balanced budget,
this has been due to Council resolving at the time of approving each Annual
Plan to use Council reserves (Dividend Equalisation and Operating reserves) to
fund a portion of Council’s operating expenses.
It is worth noting
that Council established the Dividend Equalisation reserve to provide funding
to offset any unfavourable fluctuations in regional income in any one
year. This action is important in order to ensure there are minimum
fluctuations in rates due to movements in regional income.
4. Essential
Services Benchmark
“The Council
meets this benchmark if its capital expenditure on network services equals or
is greater than depreciation on network services.”
The following graph
displays Council’s capital expenditure on network services as a
proportion of deprecation on network services - (NB: Council has only one
network service and that covers the flood and drainage schemes):
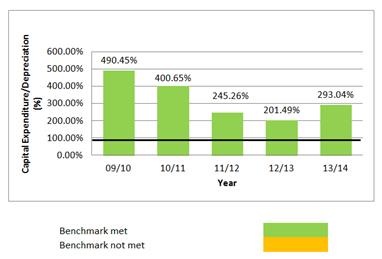
Council has met
this benchmark for all the years included in the above graph as its expenditure
on flood and drainage schemes has exceeded the depreciation set aside for such
schemes. The additional funding in excess of depreciation has been met
from scheme reserves and borrowings.
5. Debt
Servicing Benchmark
“The Council
meets the debt servicing benchmark if its borrowing costs are equal or less than 10% of its
revenue.”
The following graph
displays the Council’s borrowing costs as a proportion of revenue (excluding
development contributions, financial contributions, vested assets, gains on
derivative financial instruments, and revaluations on property, plant and
equipment).
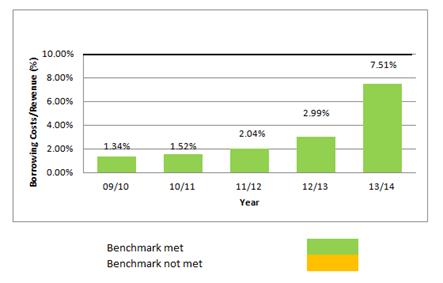
Council has met the
benchmark for all years included in the above graph. The 2013/14 includes
$1.7million of annuity costs paid to ACC for the sell down of Napier leasehold
property casflows.
6. Debt
Control Benchmark
“The Council
meets the debt control benchmark if its actual net debt equals or is less than
its planned net debt.”
The following graph
displays the Council’s actual net debt as a proportion of planned net
debt. In this statement, net debt means financial liabilities less
financial assets (excluding trade and other receivables).
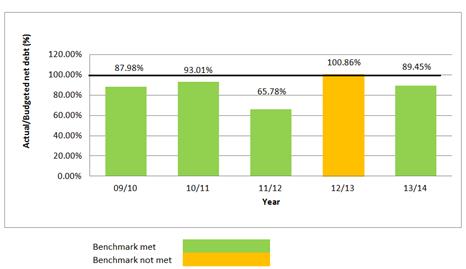
Council has met the
benchmark in all of the years except 2012/13 when the percentage is shown as
0.8% over the benchmark.
7.
Operations Control Benchmark
“The Council
meets the operations control benchmark if its actual net cash flow from
operations equals or is greater than its planned net cash flow from
operations.”
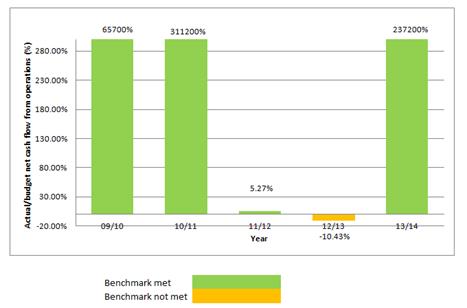
The following graph
displays the Council’s variance between actual and budgeted net cash flow
from operations.
Council has met
this benchmark (i.e. actual net cash flow from operations has exceeded planned
levels) for all the years (other than 2012-13). These variations in
operating cash balances use Annual Plan budgets as compared with actual cash
balances.
|
HBRC
Audited 2013-14 Annual Report
|
Attachment 1
|
Statement
of Service Performance for Groups of Activities
Introduction
Council separates its
operations into eight groups of activities and establishes levels of service
and performance targets for each of these, details of which were included in
the Long Term Plan 2012-22(Part 3, pages 5-91) and the Annual Plan 2013-14
(Part 2, pages 5-62).
Under the Local Government
Act 2002, schedule 10 (part 3) Council is required to:
· Identify
the activities within the group of activities.
· Identify
the community outcomes to which the group primarily contributes.
· Report
the results of any measurement undertaken during the year of progress toward
achievement of those outcomes.
· Describe
any identified effects that any activity within the group of activities has had
on the community.
Reporting
Council’s reporting
in this ‘Statement of Service Performance’ covers:
· A
financial summary for each group of activities.
· Performance
targets as contained in the Annual Plan 2013-14 for each activity, including a
managerial commentary on the achievements for the year and, where relevant,
comments on future activities.
· An
explanation of any financial variances.
The performance targets
have been structured so as to include timeliness, cost, quantity, location and
quality as following.
Timeliness
Results are reported on an
exception basis; consequently references are only made to dates where the
target dates were missed.
Cost
Targets within each group
of activity have been grouped for the purposes of setting cost targets.
Where actual expenditure varies by more than $50,000 of the budget a short
explanation is included.
Quantity
Results are reported on an
exception basis. Consequently, if the task was completed at the quantity
specified no specific reference to quantity is made.
Location
Results are specified on
an exception basis. Consequently, if the task was completed at the location
specified no specific reference to location is made.
Quality
During 2013-14 Council
reviewed, throughout the financial year, the progress made against the
individual performance targets at the end of five months and nine months, with
consideration being given to the overall targets for the year. In
determining whether quality requirements were being met, the elected
representatives drew on their knowledge of the activities, the resources
utilised to undertake them, and the outcome evident from the activities.
They also drew assurance from the knowledge that Council had:
· Employed,
either directly or through external agencies, suitably qualified staff (for
example registered engineers and surveyors, members of the NZ Planning
Institute, a member of the International Harbourmasters’ Association,
etc) with demonstrable experience relevant to their responsibilities;
· Ensured
that staff were aware of current practices and developments relevant to their
responsibilities through attendance and involvement in conferences, seminars
and training courses;
· Reviewed
the performance of flood control schemes after each flood deemed to be in
excess of a 5-year event to ensure that schemes functioned as expected;
· Ensured
that, where relevant, reference is made to established scientific conventions,
international standards set by overseas agencies, professional legal advice and
opinions, published case law precedents, and public submissions;
· Ensured
that, where relevant, external peer reviews of plans and programmes were
carried out;
· Carried out internal technical peer reviews and external legal
reviews, throughout Regional Resource Management Plan plan change preparation
processes, and actively sought the input of the public through submission and
appeal processes.
|
HBRC
Audited 2013-14 Annual Report
|
Attachment 1
|
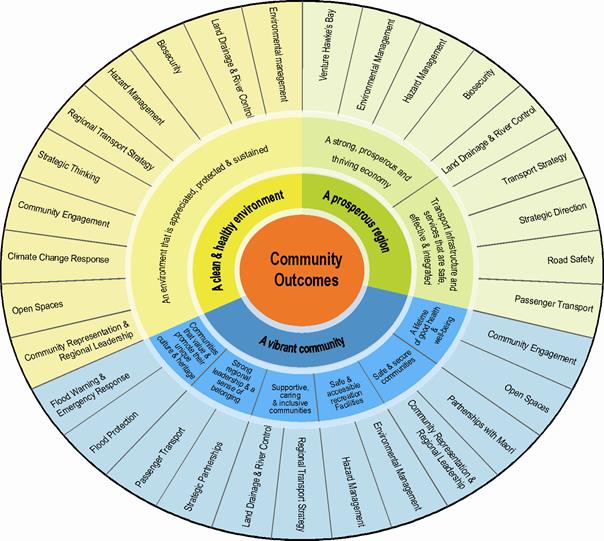
The
diagram below illustrates the relationship between Community Outcomes,
Council’s goals and the groups of activities.
|
HBRC
Audited 2013-14 Annual Report
|
Attachment 1
|
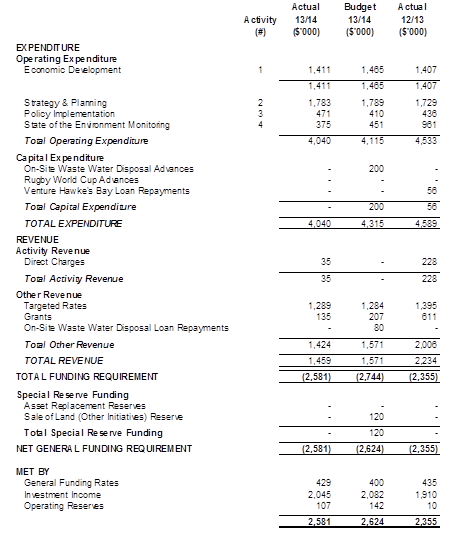
Strategic Planning
The
Strategic Planning activities pull together Hawke’s Bay Regional
Council’s (HBRC) strategic thinking initiatives, economic development,
investments and resource management policy development. Together with State of
the Environment reports, these provide information for further planning
decisions.
There
was no capital expenditure for on-site waste water disposal advances for the
2013-14 year. These are instigated by Territorial Local Authorities
(TLAs) working directly with community groups and there were no applications
for advances received from TLAs.
|
HBRC
Audited 2013-14 Annual Report
|
Attachment 1
|
Activity 1 – Economic Development
|
Service Levels and Performance Targets
Activity 1 – Economic Development
|
|
Level of Service Statement
|
Level of Service Measure
|
2013-14 Performance Targets
|
2013-14 Year End Results
|
|
Regional Economic Development Strategy mission statement: “To make Hawke’s Bay the best
location in which to visit, work, invest, live and grow”
|
Comprehensive visitor strategy in place within an overall
regional marketing plan
|
2013-2014
Continue quarterly reporting to Council on key performance
indicators
|
Achieved.
HB
Tourism Ltd (HBT) provides a quarterly report to Council. Overall results for
Hawke’s Bay for the year ending April 2014 showed a positive result
with 4% growth in guest nights. (Commercial +1.5%, Private Household Monitor
+3.9%)
Brand
“Hawke’s Bay’ and tagline “Get me to Hawke’s
Bay” continue to be used in all communication. HBT continues to take a
far stronger domestic focus with digital activity including the placement of
digital video to promote the region to its key target audiences (families,
independent travellers and active boomers) and to promote for events such as
the Big Easy and F.A.W.C! Within the last twelve months HBT has
managed a second Summer FAWC! Food and Wine Classic (twice the size of the
first event in 2012) and Four Weekends of Winter F.A.W.C! in June (also
double the size of the first winter event). HBT also managed the second
Big Easy cycle ride on the Hawke's Bay Trails alongside key regional
partners. This event also doubled in size from 2013. The second Tourism
Awards for the region was held in September and trade and media activity
continues with travel agents and media being hosted in the region throughout
the year.
|
|
Long term Regional Economic Development Strategy
|
2013-2014
Annually review and progress the regional economic development
strategy
|
Partially achieved.
Following two facilitated workshops, Business
Hawke’s Bay has recommended the review process should include input and
oversight from the Inter Sector Forum, and is pursuing this as an initiative.
|
|
Investment for research and development and business development
|
2013-14
At least $800,000 per annum achieved for Research and
Development investment
|
Achieved.
A
total funding of $1,146,917.30
across 25 company projects was approved in this financial year. Approx 60% of
these companies were undertaking research and development projects relating
to primary industries (Agriculture, Horticulture, Food and Beverage,
textiles). The balance of the projects were undertaken predominantly by
companies involved in engineering and general manufacturing.
|
|
Sustainable regional growth
|
2013-14
Continue to develop and initiate sustainable primary production
programmes
|
Achieved.
The primary focus was on the Ruataniwha Water Storage
Scheme, including hosting a Regional Leaders Tour of Mid and South Canterbury
to better understand the Socio-Economic impacts of large scale Irrigation and
Water Storage Infrastructure projects. There has been some preliminary
investigation of alternative farming systems and developing new initiatives
for Maori Agribusiness and Wairoa primary sector opportunities.
|
Financial Variances Explained
The budget for this
activity was under spent in internal costs as more time than anticipated was
spent on the Ruataniwha Water Storage Scheme.
Activity 2 – Strategy and Planning
|
Service Levels and Performance Targets
Activity 2 –Strategy and Planning
|
|
Level of Service Statement
|
Level of Service Measure
|
2013-14 Performance Targets
|
2013-14 Year End Results
|
|
HBRC
will help the community prepare for the future
|
Number
of Embracing Futures Thinking events held
|
Each
year
Host 3 Embracing
Futures Thinking events.
|
Not
achieved.
No
events hosted during the reporting period.
|
|
Trends
review completed
|
2013-14
Refresh the
Trends and Environmental Scan analysis
|
Partially achieved.
The 2013 Census information and a report on
Hawke’s Bay Region – Socio-Demographic Profile 1986-2011 was used
to refresh demographic trends and use was made of Royal Dutch Shell’s
new scenario report to review other trends at a global level. This refresh
will be used to inform Council’s strategic planning for the Long Term
Plan.
|
|
Agreement
reached on Spatial Planning Framework
|
2014-15
Reach
agreement on regional and lower North Island spatial planning framework
|
Not
achieved.
No
progress was initiated on spatial planning framework during the reporting
period. For the development of the 2014-15 annual plan, it was
determined that this project be put on hold pending the outcome of
amalgamation proposals. Meanwhile, Change 4 (Managing the Built
Environment) to the Hawke's Bay Regional Resource Management Plan became
operative on 1 January 2014. This is another key milestone for the
Regional Council’s implementation of the 2010 Heretaunga Plains Urban
Development Strategy which is spatially based.
|
|
HBRC
will integrate land and water and biodiversity management to deliver
environmental, economic, social and cultural outcomes
|
Action
plans and monitoring reports prepared for:
- Land and Water
Management Strategy
- National Policy
Statement for Freshwater Management
|
Each
year
Prepare action plans and monitoring
reports for:
1. Land
and Water Management Strategy
2. National
Policy Statement for Freshwater Management
Hold a Land and Water Symposium to engage
the wider community
|
Partially achieved.
No
specific plans or reports were prepared during the reporting period, but a
report on progressive implementation of the National Policy Statement for
Freshwater Management was adopted and published as part of the 2012-13 Annual
Report.
Draft
‘stock take’ on implementation of the Land and Water Management
Strategy was presented to the Corporate and Strategic Committee meeting on 12
March 2014.
No
Land and Water symposium was held during the reporting period, but numerous
stakeholder engagement processes were underway during the reporting period
(e.g. Mohaka and Greater Heretaunga/Ahuriri catchment areas). The stakeholder
commitment of time and knowledge to these processes are acknowledged and
appreciated.
|
|
Regional
Biodiversity Strategy completed
|
Develop a Regional Biodiversity Strategy:
2013-14: Consult on
the draft and prepare final Strategy
2014-15: Prepare
programme for work relevant to HBRC for inclusion in the next Long Term Plan
|
Partially achieved.
The
regional biodiversity strategy project has had a number of outputs delivered:
- A regional
biodiversity inventory has been completed to assist in prioritisation of
activities. Inventory development involved external expert workshops
facilitated by HBRC.
- Delivery of the
Strategy via a Forum, Accord and Trust has been agreed by the Strategy
Steering Group. The Forum would coordinate on-the-ground activities and
monitor progress; the Accord would signal commitment (of Council and external
Agencies) to the Strategy; the Trust would prioritise activities and
coordinate resources. Further detail on structure and process to be
developed.
- Core Working
Group (staff and external experts) has developed a Regional Biodiversity
Strategy ‘strawman’ due to be reviewed by the wider Steering
Group.
- Tangata whenua
contributions to strategy development are being led by Te Roopu Kaitiaki o te
Wai Maori with some significant outputs to date including draft actions for
achieving biodiversity objectives for tangata whenua.
|
|
HBRC
will establish and maintain clear and appropriate policy in a responsive and
timely manner that will enable sustainable management of the region’s
natural and physical resources
|
Status of
Resource Management Plans and Policy Statements
No more than 2
years elapse from notification of a plan change to decisions on submissions
being issued
|
2013-14
Plan change for Tukituki River Catchment
publicly notified May 2013
2014-15
Plan change for Taharua /Upper Mohaka
catchment publicly notified Dec 2014
2016-17
Plan
change for Greater Heretaunga/Ahuriri Catchment Area publicly notified
Dec 2016
|
Achieved.
Plan
Change 6 (Tukituki Catchment) was publicly notified on 4th May 2013.
Change 6 was called-in by the Environment and Conservation Ministers (via the
Environmental Protection Authority) to be part of the Tukituki Catchment
Proposal (in conjunction with applications for the Ruataniwha Water Storage project).
Board of Inquiry’s hearings were held over 18 November 2013 to 21
January 2014. Significant time and resources have been invested in
preparation and pre-circulation of expert evidence (and rebuttal evidence)
for the plan change, analysis of evidence presented by submitters, plus
Board-directed expert conferencing during the hearing. The Board issued
its final decisions on 26 June 2014. Two High Court appeals have subsequently
been lodged and will proceed through the 2014/15 period.
Taharua/Mohaka:
science investigations and assessments are progressing in parallel with land
owner discussions. Stakeholder discussions canvassing wider Mohaka
River Catchment occurred in targeted interviews, focus groups during the
reporting period. Mohaka Consultation Group is yet to be formed as a
sounding board for issues, options, choices and plan drafting prior to
notification of a plan change.
A collaborative stakeholder group (the
‘TANK Group’) has been discussing management options for land,
groundwater and surface water resources in the Greater Heretaunga and Ahuriri
area (which includes the Tutaekuri, Ahuriri, Ngaruroro and Karamu catchments,
the Heretaunga aquifers and the receiving marine environments). The
TANK Group has prepared a report outlining the Group’s 45 interim
agreements. That report was presented to the Regional Planning
Committee in February 2014 where the RPC endorsed the TANK Group’s work
and agreed to have particular regard to any consensus outcome from the group
should one emerge. Previously (August 2012), the Council gave a good
faith commitment to support any consensus recommendations (that are
consistent with other planning documents) from the TANK Group.
|
|
2014-15
Plan
change for Natural Hazards publicly notified July 2014
|
Not
achieved.
Initial
scoping of the plan change commenced during the reporting period in liaison
with review of the HB CDEM Group Plan. Scoping and work on the
‘first draft’ is strongly guided by ‘Regional Natural
Hazards and Land Use Planning Strategy’. Further work is on
hold pending shape of resource management reforms.
|
|
Regional Coastal Environment Plan
At all times
there is a regional plan in force for the HB coastal marine area
New Zealand
Coastal Policy Statement (NZCPS) put into action in accordance with statutory
requirements
|
2013-14
Scoping
and prioritising of plan changes required to give effect to 2010 NZCPS
2014-15
Start
review of coastal hazard zones if re-assessment (Project 322) necessary.
Notify
plan change to give effect to 2010 NZCPS
|
Not
achieved.
Regional
Coastal Environment Plan (RCEP) and associated Variations 1, 2 and 3 were
initially referred to the Minister in December 2012. Minister of
Conservation eventually issued his approval on 19 June 2014. This delay
meant the RCEP could not be made operative within performance targets.
Due
to delays in Ministerial approval of RCEP, a consultant was engaged in May
2014 to undertake a ‘gap analysis’ of the RCEP against the 2010
New Zealand Coastal Policy Statement. A preliminary gap analysis has been
drafted by the consultant and will be completed in early 2014/15 period.
A
Coastal Processes study (Project 322) was completed for Napier/Hastings
coastline in Hawke Bay and presented to Environment and Services Committee
meeting on 9 April 2014.
|
Financial Variances Explained
The budget was under spent
due to the delay in the Minister’s approval of the Regional Coastal
Environment Plan.
Activity 3
– Policy Implementation
|
Service Levels and Performance Targets
Activity 3 –Policy Implementation
|
|
Level of Service Statement
|
Level of Service Measure
|
2013-14 Performance Targets
|
2013-14 Year End Results
|
|
HBRC
will promote integrated management by proactively communicating its policies
and responsibilities through dialogue and submissions on district plans, consent
applications and central government initiatives
|
Lodging
of submissions on district plans, district planning applications and central
government initiatives where there are relevant regional council policies
|
2012-22
Submissions made
on district plans, district planning applications and central government
initiatives reported to HBRC’s Environment and Services Committee
Staff of HBRC and
territorial local authorities to meet at least twice a year to discuss
integration issues and steps to improve the regional and district plan are
identified and acted upon
|
Partially achieved.
Regular reports on local statutory
advocacy activities were presented to both the Maori and Environment and
Services committees.
Submissions lodged in February 2014 on proposed
Hastings District Plan and Napier City Council’s District Plan Change
#10.
HB Council Planners’ Forum met once
during the period. Discussion focussed on RMA reforms, s35A RMA records
of iwi authorities, e-planning, CDEM Group planning and reviews of the
Hastings and Napier district plans which were publicly notified in November
2013.
No formal opportunities to make
submissions on resource management legislative reviews or NESs arose during
the 2013-14 period. No new NPSs were proposed. However, in
November 2013, the Government proposed a suite of amendments to the NPS for
Freshwater Management (NPSFM). Council supported a sector-wide
submission lodged by Local Government NZ in lieu of its own submission.
Subsequently, the Government released the 2014 NPSFM which came into effect
on 1 August 2014.
During the 2013-14 period, a number of
senior staff have had increasing involvement in various groups liaising with
Local Government NZ, Ministry for the Environment and other resource sector
government ministries. Much of that liaison is in relation to proposed
RMA reforms, freshwater management and collaborative planning processes.
|
|
HBRC
will help communities without sewers improve the management of domestic
wastewater
|
Number
of interest free loans approved
|
Provide a fund to
help the territorial authority-led upgrading of community wastewater systems
in communities without sewers ($200,000pa contributions capped
at $1,000,000)
Non-regulatory
initiatives developed and implemented to complement regional plan policy
development that implements National Policy Statements and/or National
Environmental Standards
|
Partially achieved.
There
was no uptake on fund during reporting period.
While
there were no specific non-regulatory initiatives developed (in Project 193)
during the reporting period, a number of initiatives are being considered and
developed in parallel to catchment-based regional plan changes (Project 192)
such as Plan Change 6 for the Tukituki River Catchment.
|
|
HBRC will investigate and manage contaminated sites to ensure
public health and safety and environmental protection
|
Number of top priority (Category 1) contaminated sites
investigated
Maintain a database of potentially and confirmed contaminated
sites
|
2012-22
To
administer and maintain the database, including checking of record details,
site visits to GPS areas of contamination, transfers to Territorial Local
Authorities (TLA) as per agreed protocol and advising landowners of the
contaminated sites status of their property
|
Achieved. Investigations
of all Category 1 contaminated sites (13) were completed by December 2011.
Achieved.
Environmental
Activities database completed and access given to Territorial Local
Authorities to enable test runs of database. Meetings were held with Hastings
District and Napier City Councils to progress transfer of information
protocols. Checking of information on database continues, with the emphasis
currently being on transferring information from the Pattle Delamore Partners
(PDP) investigation report on the residential sites over the former Onekawa
landfill onto the database. The majority of the residential sites
sampled by PDP have been classified as “partially investigated”
but those sites not sampled will remain as “not investigated”.
HBRC continues to receive requests from residents as to the status of their
land. The Environmental Activities database is to be updated to better
co-ordinate with the recent changes to the internal HBRC records systems.
A
major task will be the addition of residential subdivisions (individual lots)
on former orchard land onto the database.
|
Financial Variances Explained
The Community Wastewater Fund has
not been called on during the 2013-14 year. Staff time for the Statutory
Advocacy project (Project 196) has been significant ($203,000 compared to a
budget of $133,000). This internal time was largely due to growing
involvement with Ministry for the Environment in initiatives for proposed
resource management reforms and freshwater management processes. Also,
significant effort was involved in the review of Napier City Council’s
Plan Change 10 and the proposed Hastings District Plan Review.
Significant external costs were
incurred under Project 192 for Plan Change 6 evidence preparation and the
budget was reforecast. Final costs were 107% of reforecast budget.
Activity 4
– State of the Environment Monitoring
|
Service Levels and Performance Targets
Activity 4 –State of the Environment Reporting
|
|
Level of Service Statement
|
Level of Service Measure
|
2013-14 Performance Targets
|
2013-14 Year End Results
|
|
HBRC will monitor and provide accurate information to the
community so that it understands the State of the Environment (SOE) for
Hawke’s Bay
|
Data quality as assessed against HBRC’s quality assurance
system
Amount of State of the Environment monitoring data available
through HBRC’s website.
|
2012-22
Maintain the current level of SOE data on HBRC’s website
Continue to make information from the following monitoring sites
available through HBRC’s website:
· All telemetered river flow sites
· All telemetered rainfall sites
· All telemetered climate stations
· All data collected, processed, analysed and stored in accordance
with ISO requirements
· Maintain ISO accreditation
|
Partially achieved.
The current level of data availability
has been maintained, and consideration is being given to expanding access to
various data in response to stakeholder comments.
Data are being collected, processed and
stored in accordance with the requirements of the ISO9001:2008-accredited
Quality Management System.
Achieved.
The Quality Management System externally audited in
December 2013.
|
|
State of the Environment Monitoring Report
|
2012-22
Annual Update State of the Environment Reports available by June
each year
2013-14
State of the Environment Monitoring Report available
|
Partially achieved.
Preparation of the five-yearly State of Environment
monitoring report is underway and will be complete in December 2014.
Priority will be given to the state of resources in the Tukituki, Mohaka and
Greater Heretaunga and Ahuriri management zones.
|
Financial Variances Explained
The $76k variance from
budget in this activity was due to the reporting for State of the Environment
being deferred into FY 2014-2015
|
HBRC
Audited 2013-14 Annual Report
|
Attachment 1
|
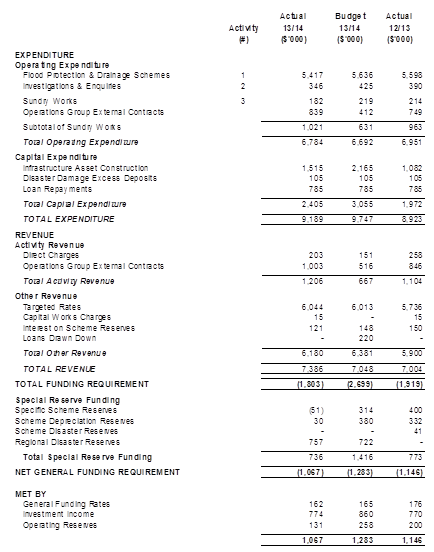
Land drainage and river control activities focus on
the management of the region’s rivers, streams and drainage network to
reduce the effects of flooding in areas where there is significant risk to
people and property. Much of this work relates to the maintenance of the flood
control and drainage schemes which have been developed over many years. They
now have a replacement value of more than $140 million.
Land drainage
and river control covers the following inter-related programmes:
· Flood protection and drainage schemes
· Investigations and enquiries
· Sundry works.
The empowering legislation for this function of the
Hawke’s Bay Regional Council (HBRC), is the Soil Conservation and Rivers
Control Act 1941, the Land Drainage Act 1908, the Local Government Act 2002 and
the Civil Defence Emergency Act 2002.
|
HBRC
Audited 2013-14 Annual Report
|
Attachment 1
|
Activity 1 – Flood Protection and Drainage Schemes
|
Service Levels and Performance Targets
Activity 1a – Flood Protection & Drainage
Schemes: Heretaunga Plains Scheme
|
|
Level of Service Statement
|
Level of Service Measure
|
2013-14 Performance Targets
|
2013-14 Year End Results
|
|
HBRC
will maintain an effective flood control network that provides protection
from frequent river flooding to communities and productive land within the Heretaunga
Plains Scheme
The level of protection in technical
terms is to convey a flood discharge with a 1% probability of being exceeded
in any one year (1%AEP) safely to the sea
|
A
full assessment of the capacity and integrity of flood control works is completed
every twelve years by a chartered professional engineer with interim audits
undertaken annually
|
2013-15
Review of the current level of service
(LOS) provided by the Heretaunga Plains Scheme to determine whether they are
still appropriate or should be increased
|
Achieved.
The report to Council in August 2011 outlined the
economic analysis and options. Consultation with the public over the
preferred option with cost implications was included in the LTP 2012-22.
There is 111.2 km of stopbank in the HP Scheme.
Currently the design Level of Service (LOS) (1%AEP capacity) is provided.
There is 192.7 km of river berm edge protection.
Current assessment is that the scheme provides 100% effectiveness and is at
no more than a low risk of failure.
|
|
The
level of service will be reported as:
Kilometres and
percentage of floodway that provide the design level of service
|
2012-22
Tutaekuri, Ngaruroro & Lower Tukituki
Audits: No change
|
|
HBRC
will maintain an effective drainage network that provides protection from
frequent flooding from smaller watercourses to communities and productive
land within the Heretaunga Plains Scheme
|
A
full assessment of the capacity and integrity of the drainage network within
each drainage catchment is completed every twelve years by a chartered
professional engineer with interim audits undertaken annually.
|
2013-14
and 2014-15
Review
the current level of service provided by the scheme and determine new level
of service measures and targets
|
Partially
Achieved.
The
Level of Service (LOS) review for the drainage network is programmed to begin
once the bulk of the review for the rivers is complete. This work commenced
late in the financial year and will be progressed in the 14-15 financial
year.
|
|
HBRC
will protect and enhance the scheme’s riparian land and associated
waterways administered by the Regional Council for public enjoyment and
increased biodiversity
|
The
level of service will be reported as the length of scheme riparian land
enhanced. (Each side of a waterway measured separately and includes new
planting and inter-planting)
|
Ongoing
0.5km
of riparian land enhanced a year (on average)
|
Achieved
13,800 native and exotic plants were planted on the
Tutaekuri, Ngaruroro and Lower Tukituki Rivers during the year. This planting
is part of an ongoing programme to enhance the riparian zone of these rivers.
The
Tutaekuri Ecological Management is essentially complete. The Tukituki plan is
about 50% complete. Implementation of EMP’s is ongoing. Gravel
extractors are required to manage sites to allow for nesting birds.
Hapu input to these plans is progressing.
|
|
Service Levels and Performance Targets
Activity 1b – Flood Protection & Drainage
Schemes: Upper Tukituki Scheme
|
|
Level of Service Statement
|
Level of Service Measure
|
2013-14 Performance Targets
|
2013-14 Year End Results
|
|
HBRC
will maintain an effective flood control network that provides protection
from frequent river flooding to communities and productive land within the
Upper Tukituki Scheme
The
level of protection in technical terms is to convey a flood discharge with a
1% probability of being exceeded in any one year (1%AEP) safely to the sea
|
A
full assessment of the capacity and integrity of flood control works is
completed every twelve years by a chartered professional engineer with
interim audits undertaken annually
|
Full Scheme Reviews
Upper
Tukituki: Start Date 2013/14; completion date 2014/15
|
Not
achieved.
Annual
maintenance of flood control scheme ongoing and managed through the annual
contracts process.
Reviews
are behind programme. This review will not commence until late 2014/15
and is unlikely to be completed until at least the end of the 2015/16
financial year.
The
November 2013 flood event which affected Onga Onga and the Makaretu River has
highlighted an issue with gravel aggradation in some of the Rivers.
This issue will be included as part of the review.
An
assessment of the fairness of the scheme classification upon which targeted
rates liabilities are based will commence in the 2014/15 year.
Partially
achieved.
There are 76.8 km of stopbanks in the Upper Tukituki
Scheme. The current design LOS (1%AEP capacity) is provided over 95% of the
stopbanked reaches.
The remaining 5% of reaches remain with reduced free
board (distance between design flood level and the top of the stopbank) and
these will be addressed in the LOS review.
There
are 212.2 km of river berm edge protection. Current assessment is that 95%
are at no more than a low risk of failure. The rivers in the Upper Tukituki
Scheme suffer some flood damage from time to time or are under repair with
young vegetation; hence the downgrading.
|
|
The
level of service will be reported as:
Kilometres and
percentage of floodway that provide the design level of service
|
2015-16
River Edge Risk:
Review of the current level of service provided by the Scheme to determine
whether they are still appropriate or should be increased
|
|
HBRC
will protect and enhance its scheme riparian land and associated waterways
for public enjoyment and increased biodiversity
|
The
length of Scheme riparian land enhanced by inter-planting with alternative
native and exotic species (each side of a waterway measured separately)
|
Ongoing
0.5km of riparian
land enhanced a year (on average)
|
Not
achieved.
No
additional planting was undertaken this financial year as the budget
provision was utilised for flood repair works following the November flood
event.
|
|
Service Levels and Performance Targets
Activity 1c – Flood Protection & Drainage
Schemes: Other Schemes
|
|
Level of Service Statement
|
Level of Service Measure
|
2013-14 Performance Targets
|
2013-14 Year End Results
|
|
HBRC
will maintain an effective flood control and drainage network that provides
protection from frequent flooding to communities and productive land within
designated Scheme areas. These Schemes include:
Makara Flood
Control
Paeroa Drainage
Porangahau Flood
Control
Ohuia –
Whakaki Drainage
Esk River
Whirinaki
Drainage
Maraetotara
Te Ngarue
Kopuawhara Flood
Control
Poukawa Drainage
Kairakau (proposed)
Waimarama
(proposed)
|
A
full assessment of the capacity and integrity of flood control works is
completed every twelve years by a chartered professional engineer with
interim audits undertaken annually
The
level of service will be reported as:
Percentage of
assets that provide the design level of service
|
2013-15
Kairakau and
Waimarama Flood Protection Schemes accepted by community and operation phase
begun
No change to
other schemes
|
Partially
Achieved.
Kairakau
Community Scheme established and operating. Waimarama Scheme not yet
established.
Current
Levels of Service are being achieved across most the smaller schemes. Levels
of Service vary across the schemes, depending on their purpose. Estimated to
be operating at 95% or higher after allowing for periodic flood damage.
The
Makara No1 dam repair was completed at a cost of $1.26 million. (Revised
budget at completion of detailed design $1.28 million).
|
Financial Variances Explained
Additional expenditure against the upper Tukituki scheme for flood
damage repairs made necessary following the November 2013 flood event and
completion of construction of the Makara No 1 flood detention dam have been
offset by savings in other schemes. Of particular note:
1. Expenditure was
greater than budgeted as a result of timing for the design and reconstruction
of the Makara No 1 dam. This dam repair was completed at a total cost of
$1.262m compared to an estimated cost set out in the Statement of Proposal for
consultation on the project of $1,208,000. Note this estimate was subsequently
updated to $1.28m. Timing of the project did however vary from the initial
programme resulting in cost variations in the 13-14 financial year.
2. There is a
reduction in expenditure on the Napier-Meeanee drainage area where some enhancement
work has been deferred to allow the scheme operation account to recover from a
significant deficit, and similarly with the Karamau drainage area. It should be
noted that a provision is made within each scheme annual operating budget to
allow for Council to respond to the rate payer enquires and unforeseen events.
Every effort is made by asset management staff to minimise expenditure on these
provisional items and this has resulted in a reduction in expenditure during
the year.
Activity 2
– Investigations & Enquiries
|
Service Levels and Performance Targets
Activity 2 –Investigations and Enquiries
|
|
Level of Service Statement
|
Level of Service Measure
|
2013-14 Performance Targets
|
2013-14 Year End Results
|
|
HBRC will be available to provide expert
advice on drainage, flooding, and coastal erosion issues
|
All queries are dealt with by appropriate
qualified and experienced staff
|
Ongoing
No Change
|
Achieved.
Many flood, drainage and coastal queries are handled
by staff
|
|
HBRC will provide up to a 30% subsidy for
river control and flood protection where the criteria set out in the Regional
Council’s guidelines for technical and financial assistance are met
|
Value of subsidies provided annually
|
Ongoing
$42,000 plus inflation of subsidy money is provided each year at
a subsidy rate of 30%
|
Achieved.
2001
|
|
HBRC will provide a consultancy service
for drainage, flooding, and coastal erosion issues according to individual
project agreements on a full cost recovery basis
|
Cost recovery.
Satisfaction with Service
|
Ongoing
Full costs of any consultation work are recovered
Major clients are satisfied with service provided
|
Achieved.
Consultancy work
has been undertaken throughout the year for Gisborne District Council,
Hastings District Council and Napier City Council. Work has been well
received by these councils.
A flood hazard study was completed for
Panpac Whirinaki mill site
|
Financial Variances Explained
Cost varied from budget as follows.
1. A reduction in
demand for minor projects resulted in expenditure in this project of $40,000
compared to a budget of $140,000.
2. An increase in
demand for consultancy services resulted in expenditure increasing from a
budgeted $152,000 to $203,000. Income in these two projects changed
accordingly.
Activity 3
– Sundry Works
|
Service Levels and Performance Targets
Activity 3–Sundry Works
|
|
Level of Service Statement
|
Level of Service Measure
|
2013-14 Performance Targets
|
2013-14 Year End Results
|
|
HBRC will ensure that the beach at
Westshore has erosion checked to 1986 erosion line
(The 1986 line was the extent
of erosion before beach renourishment began. This line is identified on a
series of posts along the foreshore)
|
The comparison of annual beach cross
section surveys to the 1986 erosion line
|
Ongoing
Erosion does not extend landward of the 1986 line
|
Achieved.
The annual
nourishment project was successful in holding the Westshore coastline seaward
of the 1986 measurements. The 2013/14 renourishment work was completed
as programmed.
|
|
HBRC will maintain river mouths so that
they do not flood private land above a specified contour subject to suitable
river, sea and weather conditions that will allow a safe and successful
opening to be made
|
Incidences of flooding of private land
above levels as specified in the River Opening Protocol
|
Ongoing
Private
land above a specified contour is not flooded as a result of a river mouth
being closed
|
Achieved.
There were no reported incidences of private land
flooded as a result of a river mouth being closed.
|
Financial Variances Explained
There were no significant
variances from budget are in this activity.
|
HBRC
Audited 2013-14 Annual Report
|
Attachment 1
|
Regional Resources covers the region’s public
shared resources (air, water, coast, gravel), its land resource (in private
ownership) and Hawke’s Bay Regional Council (HBRC) owned property managed
as a regional resource.
In relation to public shared resources, these
activities include the gathering of information about them to improve their
sustainable management, and efficient use.
In relation to the land resource, HBRC promotes
sustainable land management and enhanced economic and environmental
performance. HBRC also leverages government funding to support these
initiatives.
In relation to Council-owned land, all activities aim
to improve public access to these areas.
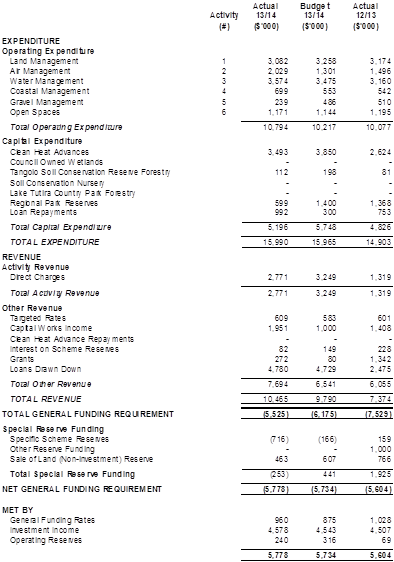
|
HBRC
Audited 2013-14 Annual Report
|
Attachment 1
|
Activity 1 – Land Management
|
Service Levels and Performance Targets
Activity 1–Land Management
|
|
Level of Service Statement
|
Level of Service Measure
|
2013-14 Performance Targets
|
2013-14 Year End Results
|
|
Viable
and resilient farming systems are being achieved through sustainable land
use.
|
Annual reporting on research project outputs and how they have
contributed to sustainable land management outcomes.
|
Ongoing
· Continue
a programme of research and extension to investigate and field trial issues
relevant to sustainable land management in Hawke’s Bay
|
Achieved
Focus of research
and extension has been to inform process and programme development to
implement the Tukituki Plan Change to achieve a cost effective reduction of
phosphorus (P) and sediment; including:
- Coastal Hill
Country ‘Group Recovering from April Adverse Storm’ Project
– 4 farm case studies completed.
-
Huatokitoki Project concluded with 2 successful field days (16 & 19 June
– 50 participant including project partners and wider community) and
the production of a research summary for the project.
-
The Dryland Pastures research project has been successful in receiving 3 more
years of funding with an aim to extrapolating the trial work to a greater
variety of on-farm environments.
-
High UMF Manuka research project - This PGP programme is a $1.8m 5 year
research programme designed to significantly increase the returns and
performance of high UMF manuka plantations
-
Papanui catchment nutrient loss research characterisation initiated in
collaboration with the Science team, this includes
o 7 series of water quality measurements (32 sites)
o Soil map produced via Landcare Research
o Biophysical risk P matrix developed
-
Landholder attitudinal and behavioural survey in the Papanui, Porangahau
Stream, Maharakeke, Tukipo, Kahahakuri & upper Tuki Corridor catchments
completed 2 November.
-
East Coast Hill Country Resilience strategy development in collaboration with
Ministry for the Environment, Ministry of Primary Industries, AgResearch,
Federated Farmers, Beef & Lamb, Horizons Regional Council, GW Regional
Council, key consultants.
|
|
|
|
Actively seek collaboration
with primary product organisations undertaking activities relevant to HB
|
Achieved
The
Land management team continue to build strong alliances and relationships
with our strategic partners at a national, regional and local level,
including:
· Dairy liaison meetings – 22
July 2013 & 8 July 2014
· Pan-sector meetings – 9 July
2013 & 6 May 2014
· Industry Good Practice –
Phosphorous Memorandum of Understanding – signed by 10 pan-sector
representatives as of 31/10/13
· Meetings with over 30 national
primary sector, research and central & regional government leaders in the
development of the East Coast Hill Country Resilience proposal
· LandWISE Board meetings x 2 +
conference sponsorship and attendance May 2014.
· LandWISE mircofarm field days 60+
people attended
· Trees for Bees conference (March)
– 100 attendees
· HB Deer Farmers stakeholder meeting
· NZ Institute of Forestry –
July (150+ attendees)
· NZ Farm forestry Association visit
to Tutira Country park (40 attendees)
· Critical source area and phosphorus
management workshop – 6 May (30 attendees)
· Feedlot issues meeting with
affected land holders – 12 April
· McCains field staff meeting
· Kate McKinnon trained to deliver
Beef & Lamb Land Environment Plans
· Ministry for Primary Industry North
Island Forestry Operations Group meetings
o 6 Meetings outlining PC6 to a range of
primary sector groups and agricultural intermediaries (over 200 attendees)
|
|
|
Outputs achieved through HBRC Regional
Landcare Scheme.
|
Ongoing
Report in the
operation plan how RLS activity directly contributes to sustainable land
management.
Annual output
targets delivered from the RLS investment to be established and implemented
as part of the annual operating plan.
|
RLS
Achieved:
o 10 wetland restoration and protection
projects funded
o 16 riparian projects funded
o 33 ha of indigenous bush protected
o 31,000 poles planted (135 properties)
o 2 coastal dune projects funded
o 4 research projects initiated
o 14 capacity building events to 800+
participants
o 16 catchment management meetings
organised
· Rangaiika dune complex protection
project
· Ahuriri lagoon protection in
collaboration with DOC Bittern project
· Lake Runanga program (20,000 trees
planted)
Trees
at cost project – 10,000 trees supplied
|
|
|
The operational plan will show the focus
of Regional Landcare Scheme activity and alignment with the Regional
Afforestation programme and the intensification of land use.
|
A portion of
Regional Landcare Scheme subsidy will be targeted, and the level of subsidy
varied, to encourage initiatives that more effectively respond to
environmental change.
|
Achieved
Approximately
40% of the RLS is now targeted to sub-catchments within the Tukituki
|
|
|
Area of erosion prone class Vle and Vlle
hill country planted through the regional afforestation programme
|
2013/14
500 ha planted
|
Not
Achieved
This
project is on hold due to the collapse in of the carbon credit market.
|
|
HBRC will
increase its knowledge of the region’s land, soil and terrestrial
habitats so it is aware of any current and likely future issues that may
arise. This knowledge will allow for a timely and effective response
that enables land sustainably for future generations.
|
Regional
baseline hill country erosion monitoring.
|
2013-14
Plains erosion
monitoring programme to begin by December 2013.
Erosion monitoring
repeated (about every 5 years but contingent on any major regional storm
event).
|
Partially achieved.
Currently holding discussions with Landcare Research
and AgResearch. Several modelling options are available and need to be
reviewed. Plains erosion monitoring more difficult than expected and original
methodology now considered not suitable for HB region. Next regional erosion
base line survey due 2015-16.
Tukituki catchment sediment modelling has been
completed with the results showing that a relatively small number of
properties contribute the bulk of sediment. The modelling has significantly
improved our knowledge of erosion in this particular area.
Partially achieved.
· The Regional afforestation
programme is on hold due to low carbon prices.
· High UMF manuka is being trialled
at Tutira as a possible opportunity for steep erodible hill country land
use. A total of 140ha has been planted over the past 3 years.
Production from the block will be monitored with sufficient data collected to
enable the initiative to be fully assessed in 2018.
HBRC
is participating in the High UMF Primary Growth Partnership
|
|
|
Integrated catchment management including staged computer
modelling and monitoring of the:
Mohaka
Heretaunga/Ahuriri
Tukituki
|
2013-15
Catchment models
developed for Taharua and the entire Mohaka catchment.
Catchment models
developed for Heretaunga area.
|
Achieved
The
LM team led development of integrated catchment management in the
Taharua/Mohaka and Tutaekuri, Ahuriri, Ngaruroro & Karamu catchment
through:
-
Providing nutrient modelling science support and farm systems interpretation
and analysis
-
Facilitating industry participation and input into plan change and program
processes
-
Facilitating and managing catchment stakeholder processes and participation
in the design of local solutions to water quality problems e.g. Taharua
catchment
-
Providing guidance on the practicalities, implications and economic impact of
permitted activity rules and policies on landholders within catchments
-
Producing implementation plans and processes to drive the implementation of
policy, rules and regulation on-ground
-
Facilitating development of sub-catchment community based strategies to deal
with significant water quality challenges in the Taharua and Papanui
catchments
Nutrient
model developed by NIWA for the Taharua/Mohaka catchment. This model
establishes relationships between nitrogen (N) losses from land and N
concentrations in stream. Model development and performance was
reported by NIWA in 2011/12 (available via the HBRC website http://www.hbrc.govt.nz/About-this-Site/Pages/contact-us.aspx). Additional data
collected in 2012-13 and 2013-14 will allow recalibration of the model (for
N), and extension of model capability. Initial modelling
completed. Second stage began May 2014 with completion expected by 2015.
This model framework will be adapted and used to
predict growth of attached algae (periphyton) in response to surface water
concentrations of N in rivers in the Greater Heretaunga and Ahuriri Plan
Change area during 2014-15.
Also, a novel two-stage process, based on desk-top
assessment of riparian areas using aerial photographs in a Geographic
Information System (GIS), previously developed to determine riparian
condition will allow Council staff to efficiently identify areas where
riparian improvement is possible.
The methodology was trialled in the Tukituki River
catchment to provide information to underpin policy developed for Plan Change
6 and will be applied to areas within the greater Heretaunga Plan Change area
in 2014-15.
|
|
Hawke’s
Bay’s land resource is maintained for future generations
|
Area
of erosion prone land with tree cover
Baseline
erosion monitoring
|
See
Regional Afforestation Scheme targets
|
Achieved
Baseline erosion monitoring programme is carried out
every 5 years with the next phase programmed for 2015-16. If a major storm
event occurs this date will be moved forward to record that event.
|
Financial Variances Explained
A variation in actual
expenditure to budget occurred as a result of changed in three research
projects Hill Country Erosion, Huatokitoki, and East Coast Drylands. The scope
of each of these projects was reduced following negotiations with MPI. Budget
was $410,000 and actual spend was approx. $200,000. Income was correspondingly
reduced.
Activity 2
– Air Management
|
Service Levels and Performance Targets
Activity 2–Air Management
|
|
Level of Service Statement
|
Level of Service Measure
|
2013-14 Performance Targets
|
2013-14 Year End Results
|
|
HBRC
will have adequate knowledge about the level of air pollutants that may
impact on public health and aesthetic values so that it can manage air
quality for human health needs and aesthetic values.
|
State of the Environment monitoring programme for:
Air
quality
Climate
|
2012-22
Monitoring
undertaken in accordance with the Regional Air Quality Monitoring Strategy.
2012-22
Report
on breaches of the National Environmental Standards (NES) in accordance with
the standard.
|
Achieved
PM10
concentrations[3]
were continuously monitored in the Napier, Hastings and Awatoto
airsheds. The following performance targets were met:
less than 5% of data missing, and
75% or more valid data (less than 25% of
measured and archived values affected by calibration and instrument fault
events).
PM10
screening equipment operated in Waipawa for a period of one year, from
December 2012 to December 2013, to determine the requirement for routine
continuous monitoring. The NES for PM10 was not exceeded during
that time and as a result there are no plans to implement continuous
monitoring.
A campaign monitoring concentrations of
traffic-related NES contaminants in Napier and Hastings was completed in
August. These contaminants include nitrogen dioxide, carbon monoxide,
sulphur dioxide and ozone. The concentrations recorded were within the
standards.
Achieved
Public
health notices were issued for 22 exceedances of the NES for PM10
since 1 July 2013. Hastings had 15 exceedances, Napier recorded 5 and
Awatoto had 2.
|
|
HBRC
will provide financial assistance for those who qualify for insulation and
clean heat support.
|
Number of clean heat systems installed under financial
assistance programme.
|
2012-22
Up to
1500 ‘clean heat’ systems installed each year under HBRC’s
financial assistance programme
Provide
loan assistance to homeowners region wide for home insulation and clean
heat under HBRC’s financial assistance programme.
|
Achieved
2014 was a phase out year for pre-1996
fires and higher than average demand was expected. The reforecast volumes
were increased, however, due to effective marketing, demand has exceeded
revised expectations.
|
|
Hawke’s Bay’s air
is suitable to breathe
|
Compliance with National Environmental Standard (NES) for Air
Quality
|
Napier
Airshed meets NES: No more than one exceedance by 2016
Hastings
Airshed meets NES: No more than three exceedances by 2016 and no more than
one exceedance by 2020.
|
2013
-2014
5 exceedances were measured in Napier.
15 exceedances were measured in Hastings.
2 exceedance was measured in Awatoto.
Partially
Achieved
It
is unlikely the targets will be achieved by 2016, but if current uptake to
replace non compliant fires is maintained the 2020 target is achievable.
|
Financial Variances Explained
The
Heatsmart project continues to perform ahead of target with the increased cost
for clean heating loans being partially offset by a reduced demand for
insulation loans.
Internal
borrowing was used to cover the increased cost of clean heat grants, which
resulted in an unfavourable financial variance against plan.
Activity 3
– Water Management
|
Service Levels and Performance Targets
Activity 3–Water Management
|
|
Level of Service Statement
|
Level of Service Measure
|
2013-14 Performance Targets
|
2013-14 Year End Results
|
|
HBRC
will increase its knowledge of the region’s water resources in terms of
quantity, quality and habitats so that a policy framework can be developed to
sustainably manage the water and land resources within Hawke’s Bay.
|
State
of the Environment monitoring programme for:
· Climate
· River flows
· Groundwater
levels
· Surface water
quality
· Groundwater water
quality
· Aquatic
ecosystems
|
2013-15
Establish 1
climate station a year in response to identified requirement.
Monitoring
undertaken in accordance with State of the Environment monitoring strategy
(reviewed in 2013/14 to reflect national reporting and regional
consistency).
Upgrade rainfall
sites as required to maintain level of service.
|
Achieved.
One climate station was installed at
“Pukeoropa”.
The “Glenwood” and “Ben
Nevis” stations were upgraded, and work is under way at the
“Pukeoropa” and “Kotemaori” stations to automate data
transfer.
A rainfall measurement site was installed
at the “Makaroro link” station.
Partially
achieved
Surface water quality and quantity,
groundwater quality and level, climate, rainfall and fresh and saline-water
ecological monitoring programmes continue according to schedule. These
data will contribute to the five-yearly SoE monitoring report that will be
completed in 2014.
|
|
Knowledge
available to inform environmental flow and allocatable volume review of the
following river catchments and groundwater basins:
Tukituki
River; Ngaruroro River; Karamu Stream; Tutaekuri River; Ruataniwha Plains ;
Heretaunga Plains.
|
2013-15
· Groundwater abstraction
and allocation report prepared for Heretaunga Plains.
· Environmental
flow, and allocation reports prepared for the:
· Karamu Stream,
Tutaekuri River, Ngaruroro River and inflows to the Ahuriri Estuary
· Capability
required of groundwater model confirmed by defining specifications.
|
Partially
achieved
A draft
Groundwater abstraction and allocation report was prepared for the area of
the Heretaunga Plains covered approximately by the Karamu Stream catchment.
Groundwater
use and allocation data is a key input to the coupled surface-groundwater
model currently being developed for the Greater Heretaunga management zone.
The
technical requirements of the coupled surface-groundwater model have been
identified. Documentation of the technical specifications and further
defining of technical requirements/objectives for subsequent modelling still
pending.
|
|
Knowledge
available to inform review of water quality objectives and setting limits.
|
2013-15
Review of water
quality guidelines and objectives completed and reported.
Water quality
requirements identified for recognised values, including aquatic habitat,
established for Heretaunga Plan Change catchments (Tutaekuri and Ngaruroro
Rivers, Ahuriri and Karamu Streams).
|
Partially achieved
A range of technical investigations are
currently underway to identify water quality requirements for the Tutaekuri
and Ngaruroro Rivers and Ahuriri and Karamu Streams. These include
ecological assessments, nutrient limitation studies and assessments of
dissolved oxygen concentrations in spring-fed streams on the Heretaunga
Plains. Analysis and reporting completed by the end of 2014.
|
|
Knowledge
available to manage nutrient inputs to rivers.
|
2013-15
Report on
Nutrient limits: Ngaruroro River, Tutaekuri.
|
Partially achieved
Nutrient limit assessment studies
continue in the Ngaruroro and Tutaekuri River catchments. These are key
to describing the relationships between nutrient concentrations and
freshwater ecological responses.
|
|
HBRC
will increase its knowledge in terms of potential regional water demand and
availability and how it is valued so that it can strategically plan for
regional economic, social, cultural and environmental benefits.
|
Regional
Water Values study.
|
Undertake a study to assess the value of
water from a social, environmental, economic and cultural perspective and
review funding policy for HBRC’s water related activities.
|
Achieved.
Regional freshwater values assessments
have been completed for a range of values including Salmonid angling, Natural
character, Native fish, and Native birdlife, Irrigation, Whitewater kayaking
and Swimming.
Cultural freshwater values assessments
have also been completed for the Tukituki catchment.
Partially achieved
Further regional environmental and
economic values assessments have also begun.
|
|
HBRC
will encourage efficient and effective water use to maximise the benefits of
the water allocated.
|
Number
of active water user groups.
Implementation
of water efficiency tools by Water User Groups.
|
2013-22
Continue to
establish and facilitate Water User Groups on a catchment priority basis.
In conjunction
with Water User Groups, investigate and apply for research grants relating to
water use and resource allocation efficiency.
Continue to
transfer latest water efficiency and allocation information to Water User
Groups.
|
Achieved.
Water User Groups are established in the
Ruataniwha, Twyford and Ngauroro.
In
progress.
Acting on interest/need to establish
additional water user groups in the Heretaunga Plains
Grant application for Twyford area is
being progressed although work is continuing to progress where possible
Promoted efficient and effective water
use via irrigation training
|
|
|
Number
of consent holders with water meters operating using telemetry or web/text
systems.
|
2013-2014
Cumulative total
of 1000 consents using telemetry or a web entry system.
|
Achieved
This project is ahead of schedule.
Currently water use for 1260 consents is being reported using either HBRCs
web-entry system (750) or telemetry (510).
|
|
Work
has continued with the Ngaruroro Irrigation Society by way of assisting with
meetings. Work with Twyford has mainly centred on political change but is now
back on track to getting water limitation solutions for irrigators. Both of
these groups are involved in the Greater Heretaunga plan change TANK
group. Work with the Ruataniwha group has mainly been via the
Ruataniwha Water Storage Scheme and Tukituki Plan Change.
|
Allocation
limits and water quality limits.
Implementation
of National Policy Statement for Freshwater Management.
|
Refer
to other performance targets listed within this table.
|
Partially
achieved
Much of the surface and groundwater
monitoring and investigation work will be used for limit setting purposes.
Access to real-time high quality water
use data (through the consent metering project) will be key to improving
water use and management.
|
Financial Variances Explained
An increase in staff time
in some projects (projects 310 and 315) and internal over/under recoveries has
created a slight increase in cost for this area of activities. Staff
hours increased in response to demand from large policy processes associated
with the Tukituki Catchment Project.
Activity 4
– Coastal Management
|
Service Levels and Performance Targets
Activity 4–Coastal Management
|
|
Level of Service Statement
|
Level of Service Measure
|
2013-14 Performance Targets
|
2013-14 Year End Results
|
|
HBRC
will measure water quality at key recreation sites and make the results
available to ensure public health and safety
|
Recreational
water quality monitoring programme and website management
|
Ongoing
Weekly monitoring
of key recreational sites as per recreational water quality monitoring plan
Recreational
water information available on website and social network site within two
days of results being available
Identification of
pollution sources for sites that regularly exceed guidelines.
|
Achieved
Recreational water quality monitoring commenced on
4/10/2013 and was completed on the 17/03/14.
Monitoring data reported within the required
timeframes on all occasions.
Faecal source tracking analysis allowed for pollution
sources to be identified at a number of sites with on-going exceedances.
|
|
HBRC will
continue to monitor, research and investigate coastal processes to inform
coastal planning including climate change and coastal hazards.
|
Annual coastal
monitoring and investigation programme including:
Beach profiling
Storm monitoring
Sediment
transport and processes investigation and modelling.
Hazard prediction
including tsunami, inundation, erosion, storm surge
|
Ongoing
Annual monitoring
and investigation programme completed and reported each year
|
Achieved
Annual
surveys of beach cross section series was completed Dec/Jan.
The
annual report has been completed.
A
report titled “Global Climate Change & Beach-barrier
responses” authored by Komar and Harris has been completed and
published. HBRC have received agreement from Napier City and Hastings
District Councils to develop a Coastal Strategy for the coast between Clifton
and Tangoio. The objective is to consider how best to manage the coast given
climate change and the potential for this to impact on the community.
|
|
HBRC will provide long term, relevant and
specific information on Hawke’s Bay’s coastal ecosystems, so that
it and the community can remain engaged with, and informed of, the current
state and potential threats to the health of coastal environments.
|
Identify
the state and health of selected regional beaches, reefs and estuaries;
Identify
the state and health of near-shore coastal waters and coastal sediments;
Maintain
an operative and relevant Coastal Monitoring Strategy.
|
Ongoing
Monitoring
undertaken in accordance with State of the Environment Monitoring Strategy
(2006) and reported on annually.
2013-14
Five-year State
of the Environment report compiled
|
Achieved
Quarterly reef monitoring surveys for
Kairakau, Te Mahia and Hardinge Road reef is currently in progress.
Monitoring of four beaches and four
estuaries completed in March 2014.
Preparation of the five-yearly State of
Environment monitoring report is currently under way. To be completed by end
of 2014.
|
|
HBRC will increase its knowledge of
coastal ecosystems through targeted research and investigations so that it is
better able to understand and respond to the effects of activities on the
coastal environment.
|
Undertaking
specific investigation and/or research, and reporting on these outcomes where
appropriate
|
Targeted
investigations into coastal receiving environments receiving stormwater
discharges.
Saline transition
zones in Wairoa, Esk, Maungawhio and Pakuratahi Estuaries will be
investigated (weather dependent).
|
Partially achieved.
A project plan has been developed to
deliver this information for the Greater Heretaunga and Ahuriri management
zone during 2013/14.
Salinity loggers have been deployed in
the Porangahau, Tukituki blind arm, Nuhaka, Wairoa, Waikari and Mohaka river
estuaries to determine sea water incursion under lower-flow conditions.
|
Financial Variances Explained
An increase in staff time
in project 331, external cost associated with contractors and internal
over/under recoveries has created an increase in cost for this area of
activities. Staff hours and external costs increased in response to
demand from large policy processes associated with the Tukituki Catchment
Project.
Activity 5
– Gravel Management
|
Service Levels and Performance Targets
Activity 5– Gravel Management
|
|
Level of Service Statement
|
Level of Service Measure
|
2013-14 Performance Targets
|
2013-14 Year End Results
|
|
HBRC
will monitor and manage river-bed sediment to ensure flood protection schemes
work as expected.
|
River
surveys (3-6 yearly) show all scheme rivers have sufficient capacity.
|
Ongoing
No
decline in river flood capacity.
|
Partially
achieved
Cross section survey programmed for the 2013-14 year
was completed except for a portion of the Waiau River which is approximately
90% complete.
River bed gravel extraction volumes have reduced
significantly over the past several years due to the economic down turn. The
impacts of this are most noticeable on the upper Tukituki rivers where gravel
build-up is reported to be resulting in reduced drainage on their properties.
Options for mitigating this are being worked through.
|
|
The
average riverbed level where gravel extracted is managed within +/- 200mm of
the design grade line.
|
Ongoing
Average
riverbed within design grade range.
|
Achieved
Done
in conjunction with survey – see below.
|
|
No
incidences of erosion or flooding as a result of undesirable gravel levels.
|
Ongoing
No
incidences.
|
Not achieved
Flooding occurred in November 2013 on land adjacent
to the Makaretu River as a result of bed levels being 0.8m above desirable grade
level. A number of other complaints from land owners adjacent to other
Upper Tukituki rivers are being investigated
|
|
River-bed
gravel is equitably allocated to gravel extractors.
|
The
gravel allocation process complies with the Regional Resource Management Plan
|
Ongoing
No
compliance issues with gravel extraction.
|
Achieved
The gravel allocation process has complied with the
RRMP and there are no compliance issues. The gravel allocation process
for the 2014/15 year has commenced and is programmed for completion May 2014.
|
|
River gravel
management activities have no significant adverse effects on river ecology
and water quality.
|
No
reported incidences of adverse impacts following gravel extraction or beach
raking activities.
|
Ongoing
No reported incidences
of adverse impacts following gravel extraction or beach raking activities.
|
Achieved
328,670m3 gravel was extracted over the year.
104 consents were issued. Gravel extraction has been managed to avoid
adverse impacts on the ecology. Ecology management plans (EMP’s) for
the Ngaruroro and Tutaekuri have been developed and for the other major
rivers are currently being developed to manage the ecology more effectively.
Gravel extractors are aware of the requirements of the EMP.
|
|
Knowledge
necessary for sustainable management of riverbed gravel is improved.
|
Completion
of investigation and research work recommended in riverbed gravel scoping
study.
|
Ongoing
Annual Programme of work completed.
|
Achieved
Modelling work is progressing to study gravel movement
in Tukituki and Ngaruroro Rivers. This year work has proceeded on the
Tukituki model. Much of the work to date has centred around the effects of
the Haumoana groyne proposal and the sediment availability as requested by
Council. The model is being extended to cover the next reach. Very useful
results are being obtained from this work which will inform decisions on
sustainable management of the gravel resource in the future.
|
Financial Variances Explained
A
significant portion of funding for this area of work is forward from fees
charged for gravel extraction from the region’s rivers. Demand for gravel
has been lower than anticipated during the year so work on the sustainable
gravel management project was reduced to fit a received income expectation.
Activity 6
– Open Spaces
|
Service Levels and Performance Targets
Activity 6–Open Spaces
|
|
Level of Service Statement
|
Level of Service Measure
|
2013-14 Performance Targets
|
2013-14 Year End Results
|
|
HBRC
will provide public access to, and manage existing Council owned parks and
wetlands for multi-purpose benefits.
|
Levels
of service associated with all open space areas are set out in current
management plans.
|
Ongoing
Maintain a
current Open Space Vision and Management Plan and, where appropriate, further
development programmes for all open space areas and facilities.
Ongoing
Implement
management plans to deliver levels of service established.
|
Achieved.
Regional Open Space network plan adopted by Council
November 2013. Plans for a number of individual open space areas are
being reviewed.
Current management plans for individual open space
areas are being implemented.
|
|
HBRC
will actively look for opportunities to provide the public with opportunities
to enjoy open space available within the region with opportunities assessed
against the HBRC Open Space policy and evaluation criteria.
|
Open
space policy and evaluation criteria.
Note $915,000 remaining in HBRC open
space and community facilities to provide for opportunities.
|
Ongoing
Continue to
assess affordable open space opportunities in accordance with the open space
vision.
Action any
opportunities approved by Council.
2013-14
Investigate
open space development opportunities with the region’s territorial
authorities that align with visitor facilities and attractions and
meet policy and evaluation criteria.
|
No opportunities are currently being pursued.
It is proposed that a borrowing facility be retained
to enable development opportunities within existing open space areas to be
considered and if approved, to be funded.
|
Financial Variances Explained
There were no significant
variances from budget are in this activity.
|
HBRC
Audited 2013-14 Annual Report
|
Attachment 1
|
Regulation activities cover the Hawke’s Bay
Regional Council’s (HBRC) regulatory functions for resource use, building
dams and safe navigation of the region’s navigable waters.
The empowering legislation for HBRC functions include
the Resource Management Act 1991, the Local Government Act 2002, the Soil
Conservation and Rivers Control Act 1941, the Building Act 2004, the Foreshore
and Seabed Act 2004, the Hazardous Substances and New Organisms Act 1996, and
the Maritime Transport Act 1994.
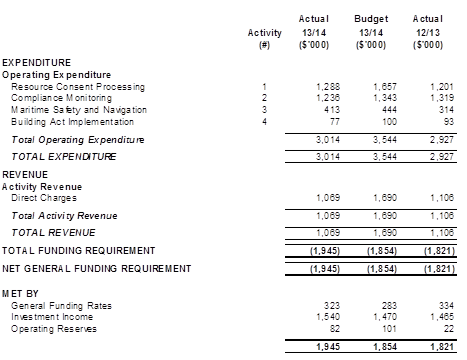
|
HBRC
Audited 2013-14 Annual Report
|
Attachment 1
|
Activity 1 – Resource Consent Processing
|
Service Levels and Performance Targets
Activity 1–Resource Consent Processing
|
|
Level of Service Statement
|
Level of Service Measure
|
2013-14 Performance Targets
|
2013-14 Year End Results
|
|
HBRC
will ensure that accurate information about resource consent requirements and
processes is readily available.
|
Application
and submission guides are available in electronic and hard copy form.
|
2012-22
No
verified reports of inaccurate information being given in relation to
resource consent requirements.
2012-22
Electronic
application and submission forms, application and submission guides are available
through HBRC’s website.
|
Achieved
Staff continue to maintain up-to-date application
forms and information.
Achieved
Guidance for change of ownership relating to water
permits prepared and distributed.
Electronic application forms are available through
the web
|
|
HBRC
will process resource consent applications in a timely manner.
|
100%
of resource consents processed within statutory timeframes set down in the
Resource Management Act 1991.
|
2012-22
100%
of resource consents processed within statutory timeframes.
|
Achieved
All consents have been processed within statutory
timeframes.
|
Financial Variances Explained
There
were variances from the budget in this activity. The principal excedence was
against the budgeted provision for appeals/objections. The budget provision for
this activity was $53,951 while the total costs for the year amounted to
$119,615. Other activities within the budget were not sufficient to offset
these costs.
The
provision for appeals was exceeded due to the Environment Court Appeal against
the Mexted et al development at Mahanga by Mahanga E Tu Inc ([2014] NZEnvC 83
Mahanga E Tu Inc v Hawke’s Bay Regional Council). This appeal has been
going on for over 4 years and it has been difficult to anticipate the cost of
Councils participation in this process. The actual hearing has been pending but
came up in March. Staff did not anticipate the full cost of the legal and
expert witnesses and their attendance at the appeal hearing which was held in
Gisborne. The external cost for this amounted to $112,495 for the year.
The
Mahanga E Tu appeal is concluded but for settling of conditions. There will
only be minor costs of an estimated $2,000 to conclude this.
While
there is budget for appeals, the number of appeals are normally very few. Now that
the Mahanga E Tu appeal has been concluded the only appeal against HBRC
resource consents is the appeal to the High Court against the RWSS consents.
The Consents section does not anticipate being involved in this appeal. At this
stage there is very little cost anticipated against this budget item for the
coming year. This can however change.
Activity 2
– Compliance Monitoring
|
Service Levels and Performance Targets
Activity 2–Compliance Monitoring
|
|
Level of Service Statement
|
Level of Service Measure
|
2013-14 Performance Targets
|
2013-14 Year End Results
|
|
HBRC
will check that consent holders comply with the resource consent conditions
imposed to protect the environment.
|
Number
of consents monitoring in accordance with the adopted compliance monitoring
strategy.
|
2012-22
90% of
programmed inspections/reports completed each year.
95% of
monitored consents achieve an overall grading of full compliance.
|
Achieved
662 consents monitored out of 812
programmed for the 2013-14 year plus 1589 water takes monitored in
conjunction with Water Information Services. 93% of programmed work was
undertaken.
99% of monitored consents achieved a
final overall grading of full compliance.
|
|
HBRC
will provide a 24 hr/7 day a week pollution response service for reporting
environmental problems.
|
Duty
management/Pollution Management response system.
|
2012-22
24
hour duty Management/pollution management response system maintained.
|
Achieved
Ongoing
service provided
|
Financial Variances Explained
There were no significant
variances from budget in the monitoring activity, however a significant
increase in the number of reported pollution incidents and investigation of
those resulted in a $109,000 unfavourable variance in the pollution response
activity.
Activity 3
– Maritime Safety & Navigation
|
Service Levels and Performance Targets
Activity 3–Maritime safety and Navigation
|
|
Level of Service Statement
|
Level of Service Measure
|
2013-14 Performance Targets
|
2013-14 Year End Results
|
|
HBRC will provide local navigation
safety control of shipping and small craft movements to ensure the
region’s navigable waters are safe for people to use.
|
The Navigation Safety Bylaws and Port and
Harbour Safety Management System.
|
2012-22
Bylaws
to be reviewed in 2016.
Maintain
a Maritime New Zealand accredited Safety Management System for the Napier
Pilotage Area.
Marine
accidents and incidents are investigated and acted upon using education and
enforcement as appropriate.
Region
wide risk assessment and review of current work programme with forward
looking recommendations by 1 July 2013.
Review
community education effectiveness by 1 July 2013.
|
Achieved
Safety Management System has been
audited by MNZ. Audit passed with no corrective actions required.
Achieved
Incidents have been investigated with
education and enforcement action used where appropriate.
Achieved
Region wide risk assessment
completed.
Achieved
Reviewed with Continued Coastguard delivery of
Community Education programme. Additional strategies employed including media
releases and children’s competitions. Prizes donated by local
businesses. Successful presence at Waimarama Beach Day and sponsorship of a
wearable arts competition with a navigational safety theme.
|
Financial Variances Explained
There were no significant
variances from budget are in this activity.
Activity 4
– Building Act Implementation
|
Service Levels and Performance Targets
Activity 4–Building Act Implementation
|
|
Level of Service Statement
|
Level of Service Measure
|
2013-14 Performance Targets
|
2013-14 Year End Results
|
|
Process
Building Act consent applications within timeframes.
|
Contract
with Waikato Regional Council to process dam consents on behalf of
Hawke’s Bay Regional Council (HBRC).
|
2012-22
Maintain
contract with Waikato Regional Council, for the processing of dam building
consents.
|
Achieved
Contract
maintained.
|
|
Maintain
an accurate Dam Register and help dam owners prepare dam safety assurance
programmes in accordance with Building Act timeframes.
|
All
known dams have been recorded on the Dam Register, and dam owners informed of
Building Act requirements.
|
2012-22
100%
of dams comply with regulation requirements that come into force in July
2012.
|
Not
Achieved
No action, regulations still not in force. Latest
date is 1 July 2015
|
|
HBRC
will investigate illegally built dams and will ensure that they are removed
or made compliant.
|
An
illegally built dam is made compliant or removed within six months of
identification.
|
2012-22
100%
of dams comply with regulations.
|
Achieved
No
illegal dams [as defined under the Act] identified.
|
Financial Variances Explained
There were no significant
variances from budget are in this activity.
|
HBRC
Audited 2013-14 Annual Report
|
Attachment 1
|
Animal and plant pest control is carried out in
accordance with Hawke’s Bay Regional Council’s (HBRC) Regional Pest
Management Strategy and the National Strategy for Bovine Tuberculosis (Tb).
Biosecurity
covers the following inter-related programmes:
· Regional animal pest control
· Regional plant pest control
· Pest management strategies.
The relevant legislation for this Activity
is the Biosecurity Act 1993.
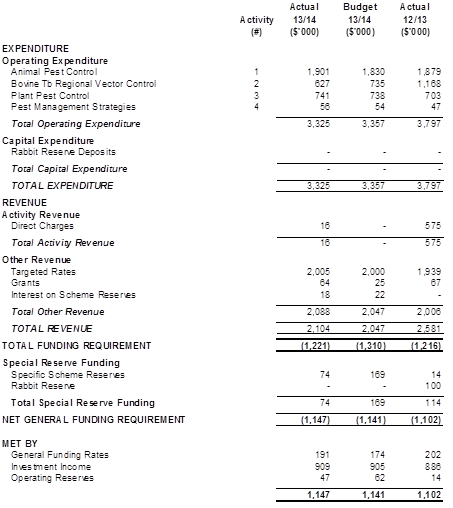
|
HBRC
Audited 2013-14 Annual Report
|
Attachment 1
|
Activity 1 – Regional Biosecurity Programmes
|
Service Levels and Performance Targets
Activity 1–Regional Biosecurity Programme
|
|
Level of Service Statement
|
Level of Service Measure
|
2013-14 Performance Targets
|
2013-14 Year End Results
|
|
HBRC
will develop and implement regional pest management strategies that improve
biodiversity and economic prosperity.
|
Pest Management
Strategies
Maintain
a current Regional Pest Management Strategy.
|
2013-2014
Review the current
Regional Pest Management Strategy (RPMS) and complete new Plan by 2015
|
Progressing
The Regional Pest Management Plan (RPMP) and Regional
Phytosanitary Pest Management Plan have been reviewed with both strategies
sealed by Council in March 2013. A further review required following
amendments to the Biosecurity Act of the RPMP is on track for completion in
2015.
A number of initiatives underway will inform the next
review of the RPMP. These initiatives include considering how more effective
biosecurity risk management may take place for the Horticulture, pipfruit and
viticulture sectors, how “Good Neighbour” rules may be used along
boundaries with Crown estate and what the options there may be to integrate
additional top predator pests into HBRC’s possum control area
programme. Development of the cost benefit analysis that is required for each
pest to underpin any decision for HBRC intervention in the management of that
pest are also well advanced.
|
|
Undertake
research and investigation to quantify and/or increase the economic,
biodiversity or animal/human health benefits of pest control.
|
Ongoing
Undertake at least
one research/investigation initiative annually.
|
Achieved
There were five research projects successfully
completed. These included a grass forage trial (rabbits –
Tutira/Opouahi), wide scale predator control biodiversity outcomes monitoring
(Opouahi), feral cat camera monitoring trial (NZ first of its kind research
to establish a monitoring technique for predators), toxoplasmosis research,
and farmer uptake focus groups research for wide scale predator control (Cape
to City).
|
|
HBRC
will provide effective pest management programmes that improve regional
biodiversity and economic prosperity.
|
Regional Animal
Pest Control and Bovine Tb Vector Control Programmes
Hectares
of rateable land kept at low possum numbers. Low possum numbers means no more
than five possums caught per 100 traps set out at night.
|
By 2016
all rateable land will be reduced to low possum numbers (total rateable land
in Hawke’s Bay = 1,000,000 ha).
Rateable
land in transition from the Animal Health Board programme:
2013-14:
16,000 ha
2014-15:
80,000 ha
2015-16:
30,000 ha
Rateable
land in Possum Control Area (PCA) Programme:
June 2013:
490,000 ha
June 2014:
507,000 ha
Of
the PCAs monitored, less than 10% of the monitoring lines exceed 5% trap
catch.
|
Achieved
At 30 June 2013 a total area of 907,740 ha of
rateable land is being kept at low possum numbers. This comprises
507,740ha’s under HBRC’s possum control area (PCA) programme and
approximately 400,000 ha of AHB vector control operations under the
TBfree NZ programme. Possum initial control has been completed across 98% of
productive land within the region.
An area of 16,304 ha was transitioned from the TBfree
programme to HBRCs PCA programme in the 2013/14 year.
Education
and Trend monitoring utilising chew cards has been completed across 52,474
hectares (10.3% of possum control area programme). Of the 310 monitoring
lines completed 24 or 7.7% of these lines exceeded 5% rtc.
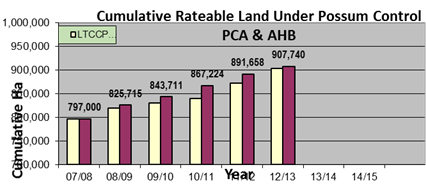
|
|
The
number of active rook nests treated annually across the region.
|
Ongoing
Monitoring
indicates a downward trend in active rook nest numbers in both areas (North
and South of SH5).
|
Achieved
Aerial
rook control has been carried out and completed in all known rookeries across
the region during the 2013 rook breeding season. An additional 26 new
rookeries where located across the region, 3 in the eradication zone and 23
in the control zone.
A
total of 95 active nests were aerial treated across the eradication zone
north of SH5.
A
total of 448 active nests were aerial treated across the control zone south
of SH5 compared with 686 in the 2012/2013 financial year.
Ten
rook enquires were responded during the year.
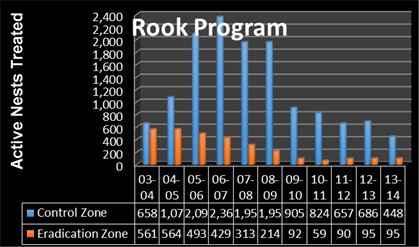
|
|
Response
time to rabbit complaints/enquiries.
|
Ongoing
An
initial response is given within 5 working days of receipt of each rabbit
related complaint/enquiry
|
Achieved
Fifty rabbit enquires were received and followed
up. All enquires have been responded to within 5 working days of
receiving their initial call. Assistance was provided in the form of
environmental topic’s, one on one advice, and where appropriate a
demonstration on best use of either Pindone rabbit pellets or magtoxin, which
is used for fumigating rabbit borrows.
McLean Scale four indicates that there are pockets of
rabbits with signs and fresh burrows very noticeable.
One property has ongoing rabbit management plans for
2014/15 with initial control scheduled for the winter of 2014.
|
|
Responsiveness
to properties identified with rabbit populations over McLean Scale 4.
|
Ongoing
A
management plan is prepared within four months for each property identified
with rabbit numbers above McLean Scale 4.
|
|
Plant Pest Control
Routine
plant pest inspections of areas infested with plants controlled under HBRC
Regional Pest Management Strategy.
|
Ongoing
All
known infestations of ‘occupier responsibility’ Total Control
plant pest sites are visited annually
All
known ‘service delivery’ Total Control plant pest sites are
visited annually and plants controlled
All
Privet sites identified through complaints controlled within 6 months of
complaint
The
land around all known infestations of Total Control plants is inspected at
least every 3 years
All
areas of high potential risk are visited annually and checked for possible
new plant pest incursions
|
Achieved
Total
Control Service delivery visits and control were undertaken on Spiny emex,
African feather grass, goats rue, phragmites, yellow water Lilley and White
edged nightshade by Council officers. Control work has been completed by
contractors for Nassella tussock.
The
urban Privet programme has had a total of 261 properties (65 in Wairoa) where
Privet has been removed by the contractor or council staff.
A
total of 2428 visits were made this year on total control plant pest
properties. Of these 1148 were urban visits. Occupiers have undertaken
control principally on Apple of Sodom, Old Man’s Beard, Chilean needle
grass, Cotton thistle, Pinus Contorta, Japanese honeysuckle, Australia sedge,
and Woolly nightshade.
Fluproponate
(Taskforce) has been used for two years now on Chilean needle grass with the
benefits of using it starting to show. However there are still some
issues to work on with this product. A ‘Best Practise’ on how to
use this chemical will be developed in conjunction with other Councils. The
aerial application of the chemical has been approved by the Environmental
Protection Agency (EPA). Residue and efficacy trials required by EPA are
underway to support the retention of Taskforce’s registration.
A
monitoring and control programme has continued for Darwin’s barberry in
the two known infested areas (Puketitiri and Wakarara), and for Boneseed on
the coast south of Cape Kidnappers.
Leaflets
were distributed for Blue passionflower in the Taradale and Clive area.
Control for Blue passionflower has started. Inspections have been carried out
on land around known infestations of other total control plants, as time has
allowed.
Two
Notices of Direction were issued. These were issued to land users with a high
likelihood of Chilean Needle grass on their properties who wanted to sell hay
off the property.
A
total of 22 Earthmoving machines/mowers were inspected after being washed
down before leaving infected sites.
|
Financial Variances Explained
During
the financial year an additional part time staff member was employed to
determine the level of pest control activity currently being undertaken by land
owners who have chosen not to service their properties using a contractor.
These property owners were seen as a potential risk to the on-going integrity
of HBRC’s possum control programme covering approximately 500,000ha of
productive land throughout the region. Feedback from this activity was
extremely positive with the vast majority of land owners actively undertaking
pest control on their own property and strongly supporting council’s
initiative to maintain low possum numbers throughout the region.
HBRC
funds 10% of the TBfree vector management and control programme in
Hawke’s Bay. At the end of each financial year TBfree NZ review the
actual percentage chargeable in relation to the work programme delivered in HB
compared to the rest of NZ and do and end of year correction. This year
TBfree NZ has determined that the HB contribution is less than 10%. This
is reflected in the reduced charge.
|
HBRC
Audited 2013-14 Annual Report
|
Attachment 1
|
Emergency Management covers a range of activities to
meet Civil Defence and natural hazard management responsibilities.
Hawke’s Bay Regional Council (HBRC) administers
both the Hawke’s Bay Civil Defence Emergency Management Group and the
Coordinating Executive Group, both of which have responsibilities for the
implementation of the Hawke’s Bay Group Civil Defence Emergency
Management Plan.
The Vision of the Group is A Resilient
Hawke’s Bay Community. The activities undertaken to achieve
this aim to: identify potential hazards to the community and the means of
reducing their impact; prepare the community for potential civil defence
emergencies; and assist with the response to and recovery from any emergencies
that occur.
The relevant legislation for this function of HBRC is
the Civil Defence Emergency Management Act 2002 and the Resource Management Act
1991.
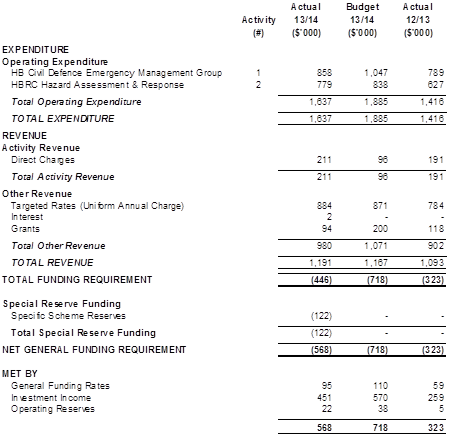
|
HBRC
Audited 2013-14 Annual Report
|
Attachment 1
|
Activity 1 – HB Civil Defence Emergency Management Group
|
Service Levels and Performance Targets
Activity 1– HB Civil Defence Emergency Management Group
|
|
Level of Service Statement
|
Level of Service Measure
|
2013-14 Performance Targets
|
2013-14 Year End Results
|
|
HBRC will reduce the impact of long term natural and man-made
hazards to life and property, eliminating these risks if practicable, and if
not seek the reduction of their impact.
|
Assessment of natural and manmade hazards will be completed for
at risk areas in Hawke’s Bay.
|
2012-22
Advocate
to Territorial Authorities for the consideration and inclusion of hazard
information as part of their land use planning functions
In
conjunction with TAs, provide public advice on the impacts of hazards
Complete changes to the
Resource Management Act 1991 statutory plans that reflect the integrated
approach of the Joint Hazard Strategy
|
Partially Achieved
Currently
working with HBRC Strategy and Policy Group to develop a change to the RPS to
implement a risk based approach and strengthen the requirement for TLAs to
consider the impacts of natural hazards when considering land use changes.
Facilitated
Napier Tsunami Evacuation Planning Workshop March 2014.
On-line
hazard database has been maintained on the HBRC website.
Submission
made to the HDC proposed District Plan on strengthening their risk reduction
through land use planning.
|
|
Number
of hazards research projects commissioned each year.
|
2012-22
At least one new
research project commissioned each year
|
Achieved
A
project commissioned to review the liquefaction potential in Hawke’s Bay,
with the CDEM Group leading a partnership of all Hawke’s Bay Councils,
local IPENZ members and GNS. The project has run over 2 years and is to
be completed by June 2015. Access has also been provided to the CGD for
HB geotechnical assessments.
Results
of an Active Fault Mapping project for CHB prepared 2013 was presented to
CHBDC by GNS on 13 March 2014.
A
project was completed providing Level 2 tsunami mapping for remote coastal
areas in HB based on the findings of the National Tsunami Risk Review Sept
2013.
A
review of the 10-year HB CDEM Hazard Research Plan was commissioned with a
workshop hosted May 2014. The final report is due in late 2014.
|
|
Percentage
of surveyed residents that are aware of hazard risks & can identify
earthquake, flooding, and tsunami as major hazards in Hawke’s Bay.
|
2012-22
Awareness of
earthquake, flooding/heavy rainfall and tsunami hazard risks show an increase
over time
Specific target
more than 50% of residents can identify tsunami as one of the region’s
major hazards by 2018
As measured in a
3 year survey
|
Achieved
The
most recent regional survey in 2013, undertaken on behalf of Council by SIL
Research, asked residents to identify hazard risks to their livelihood:
· 93% identified earthquake
· 62% identified flooding/heavy rain
· 51% identified tsunami, up from
33% in 2008
|
|
Satisfaction
of Territorial Authorities and professionals involved in land use planning
decision making with the quality, format & relevance of hazard
information supplied.
|
2012-22
All Territorial Authorities and planning
professionals are satisfied with the quality, format and relevance of hazard
information supplied/available as assessed by an evaluation and feedback form
every 3 years
|
Achieved
A
HB Hazard Research Survey was sent out to the TLA and some other key
professionals involve in land use planning decision making with results
compiled in Sept 2013. 75% of respondents were satisfied (rating either
good, very good or excellent) with the quality of hazard information they
received. 100% said the information was relevant.
|
|
HBRC will maintain and where appropriate increase the readiness
of Hawke’s Bay Civil Defence Emergency Management (HBCDEM) and the
community to respond to a civil defence emergency.
|
HBRC response to a Civil Defence emergency is coordinated,
appropriate, effective and efficient.
|
2012-22
Complete
the Review of the HBCDEM Plan
Complete
framework for Training Needs Analysis and Training Programme with partner
organisations
Complete
HBCDEM Group Training Directive
Maintain
three yearly exercise programmes
Corrective
Actions that the HBCDEM group has responsibility for are implemented in
accordance with the Corrective Action Plan
|
Achieved
The
review of the Group Plan was approved by the CDEM Joint Committee on 20 June
2014.
Not
Achieved
Framework
for Training Needs Analysis will be dealt with as part of the implementation
Group Plan
Partially Achieved
The
training directive will be completed post the Group Plan review late 2014
The
corrective actions plan from the recommendations of the Capability Assessment
Report is being reviewed quarterly by the Coordinating Executives Group and
was considered as part of the review of the Group Plan.
|
|
The level of support provided to the HBCDEM Group in directing
and co-ordinating personnel and resources for response and recovery
operations.
|
2013-14
Completed
welfare work plan
Conduct
induction training for incoming Joint Committee members post 2013 elections
2012-22
An active
Welfare Advisory Group which meets at least 4 times a year
|
Partially Achieved
The
review of the Group Welfare Plan will be conducted post the Group Plan
review.
Achieved
The
Welfare Advisory Group is meeting at least quarterly and is making good progress
in coordinating welfare planning and cooperation between different welfare
agencies.
|
|
The percentage of surveyed residents prepared to cope for at
least three days on their own.
|
2012-22
90%
residents have enough food stored for three days and had some way of cooking
without electricity
75%
have enough water stored
As
measured by three yearly survey
|
Achieved
Survey results in 2013 (HBRC survey
undertaken by SIL Research) showed 93% had enough food stored, with 89%
having some alternative way of cooking without electricity.
68% had enough water stored not including
water in the hot water cylinders. An increase from 55% in 2011.
A National MCDEM survey in July 2011
showed 66% of NZers had taken steps to prepare themselves or their household,
up from 44% the previous year.
|
|
HBRC will ensure that appropriate levels of response
capabilities are in place and maintained across the Hawke’s Bay Civil
Defence Emergency Management (HBCDEM) Group.
|
Established Emergency Management Plans including training and
procedures.
|
2013-14
Continue
to develop the capability of the Group Emergency Coordination Centre in
Hastings.
Complete
capacity review of existing Emergency Operations Centre facilities in HBCDEM
Group.
2012-22
Maintain
Plans and Standard Operating Procedures and ensure Group Emergency
Coordination Centres can be ready for operation within 6 hrs of event.
Effectively
and efficiently manage any emergency events from initial warning until a safe
situation returns.
|
Achieved
The
GECC is equipped fully and operational.
Minor
enhancements identified during training and testing are being implemented.
Partially Achieved
Reviews
will occur in parallel with the implementation of the national Emergency
Management Information System (EMIS).Volcanic Ash Exercise held in November
2013.
Warning
system established and operating. 165 warnings or watches of severe
weather, volcanic alert level changes, tsunami advice or other hazardous
events have been effectively and efficiently managed. Wide level of
satisfaction by supporting agencies in the system.
|
|
Maintain the CDEM
Group’s emergency management and civil defence capacity with the
capability of effectively responding to an emergency event.
|
2012-22
Maintain
established teams, training programmes, Emergency Operations Centre, Manuals,
in accordance with HBCDEM Group Plan.
|
Achieved
Contact
List of trained team members is maintained.
Development
of Training activities incorporating the new EMIS operating platform was
completed across the Group over 203/14. There have been technical issues with
EMIS nationally and the Group is slowly making this system operational as
these issues are sorted out by MCDEM.
|
|
HBRC will ensure the recovery from emergencies is
managed in accordance with the scale of the event.
|
Facilitate and maintain Lifelines Group who have effective input
into Civil Defence Emergency Management (CDEM) Group plans.
Dedicated CDEM Group Recovery Manager appointed.
A relevant CDEM Group Recovery Plan is adopted and maintained.
|
2013-14
An
active Lifelines Group which meets at least 4 times a year.
Complete
Group Recovery Plan.
Complete
an engineering Lifelines work programme.
2012 – 2022
Partner
Territorial Authorities have appointed local recovery managers.
|
Partially Achieved
The
HB Engineering Lifelines Group has appointed a new Chairman. The
Lifelines Group represents essential utilities and infrastructure.
There is a requirement under legislation that they need to be up and running
as quickly as possible after an event. The group has commenced a
critical sites assessment project which should be compete in August 2014.
Partially Achieved
Hawke’s
Bay Recovery Forum was run in December 2013. This forum facilitated the
development of a Hawke’s Bay Recovery Strategy. This strategy was
approved by the CDEM Joint Committee in June 2014. The Strategy now
needs to be rolled out to the TLAs and the appointment of local recovery
mangers will be part of this process.
|
Financial Variances Explained
The $189k variance from
budget in this activity was due to reduced activity levels during the review of
the Group Plan and the holding of a vacancy while this was being
completed. With this Plan now being complete and strategic objectives
set, this overspend will be used to implement change in the Hawke’s Bay
CDEM Group resourcing and structure in 2014-15.
Activity 2
– Hazard Assessment & Hawke’s Bay Regional Council Response
|
Service Levels and Performance Targets
Activity 2– Hazard Assessment & Hawke’s Bay
Regional Council Response
|
|
Level of Service Statement
|
Level of Service Measure
|
2013-14 Performance Targets
|
2013-14 Year End Results
|
|
HBRC
will ensure it has an emergency response capability that can provide regional
hazard assessments and warning systems to the Civil Defence Emergency
Management (CDEM) Group and to manage Council assets.
|
Effectiveness
of response capacity and capability.
|
Ongoing
Maintain
established Teams, training programmes, Emergency Operations Centre, Manuals
and Business Continuance Plan.
|
Achieved
- CDEM
teams maintained, with 21 new staff inducted in the Council’s emergency
requirements. Training sessions have been run for all HBRC CDEM Teams with
EOC’s and manuals maintained.
- Biennial
review of the BCP was completed and approved by the Executive Team in
September 2013.
|
|
24hour
duty management system is in place.
|
Ongoing
Operate
an effective 24-hour Duty Management Service and respond to urgent public
enquiries and complaints in a timely professional manner.
|
Achieved
An
effective 24-hour duty management system has been operated with 545 calls
logged for the year.
|
|
HBRC
provide reliable warning of flooding from the region’s major rivers to
at risk communities in the Wairoa, Tutaekuri, Ngaruroro and Tukituki areas.
|
Percentage
of time that priority telemetered rainfall and river level sites are
operational throughout the year.
Priority sites:
98%
Overall: 92%
|
Percentage
of time that priority telemetered rainfall and river level sites are
operational throughout the year:
2012-19: 98% average for all key
sites
|
Achieved
Key
sites = 99.74% performance
All
Sites = 98.32 % performance
(July
2013 to Feb. 2014)
|
|
A flood
forecasting system is available on the web to advise the community on likely
rainfall and flooding.
|
Percentage
of the region at risk of flooding from large rivers, covered by a flood
forecasting model.
|
Percentage
of the region covered by a flood forecasting model
2014-15: 70%
|
Achieved
The Ngaruroro, Tukituki and Tutaekuri
rivers make up the central and southern flood forecasting model. In the North
the Wairoa River catchment is covered by a flood forecast model. To date 70%
of the region is covered with a model.
|
|
Ongoing
No decrease in
model performance.
|
Achieved
Verification
work is carried out following a flood event to improve the models.
|
|
Information
available on HBRC’s website during storm events.
|
Ongoing
No change
|
Achieved
Currently
information on the Council web is available only for larger flood events.
|
|
Peak
flood forecast river flows agree within 25% of the actual flows.
|
Ongoing
No decrease in
performance.
|
Achieved
Provided flooding potential advice to the
region, no significant events occurred during the period.
|
|
HBRC
will continue to improve its knowledge and understanding of flood risks from
the areas exposed to severe weather events and the effects of runoff onto low
lying land and into the network of drains, streams and rivers of the region.
|
Percentage
of area mapped for flood hazard, including the impact of climate change.
|
2014-15:
100%
To update flood
hazard information for high risk communities.
|
Almost Achieved
97% of the high risk communities have
been mapped (excluding climate change effects).
29% of the low risk communities have been
mapped (excluding climate change effects).
|
|
HBRC
will to respond to oil spills within the Hawke’s Bay Coastal Marine
boundary and maintain a Tier 2 oil spill response plan which identifies
priority areas in HB for protection in the event of a major spill.
|
Current
Tier 2 Oil Spill Plan is in place and training is being implemented
|
Operative
Marine Oil Spill Plan is maintained, along with trained personnel.
|
Achieved
A 3-yearly plan
review has been completed as required by MNZ, with an environmental risk
assessment workshop held in October. Public consultation resulted in 5
submissions, and the plan was submitted to MNZ in June 2014 for approval.
10 staff attended
various MNZ training courses, and 2 practical exercises were run.
3 oil spill
events have occurred with appropriate responses made and clean up arranged.
Costs fully recovered with minimal environmental impacts.
|
Financial Variances Explained
While
there was approximately $120,000 of under expenditure on the flood risk
assessment project this was offset by $60,000 excedence in the flood
forecasting in hydrology flow management project. During the year staff focused
on improved flood forecasting and modelling work to detriment of progressing
flood risk assessment. A shortage of staff resource due to an engineering
position remaining unfilled during the year resulted in an overall under
expenditure in this area.
|
HBRC
Audited 2013-14 Annual Report
|
Attachment 1
|
Transport
Transport covers regional
transport planning, provision of passenger transport and co-ordination and
provision of road safety initiatives across Hawke’s Bay.
The driving force is the
Regional Land Transport Strategy and the Regional Land Transport Programme,
which were required to be prepared by the Regional Transport Committee.
The Land Transport
Management Act 2003 requires Hawke’s Bay Regional Council (HBRC) to
consider the transport needs of disadvantaged people. In September 2011, HBRC
adopted a Regional Public Transport Plan to address this and guide it in
providing a passenger transport system that contributes to the social,
economic, environmental and cultural wellbeing of the people of the region.
HBRC also operates a Total
Mobility Scheme that provides a subsidised taxi service for people with serious
mobility constraints by way of taxi vouchers.
HBRC contracts Go Bus Ltd
to conduct the urban bus services for Hastings and Napier. They receive
all fare income and this is deducted from the contract fees that HBRC pay to Go
Bus Ltd. This contract forms part of the operating expenditure for
Subsidised Passenger Transport.
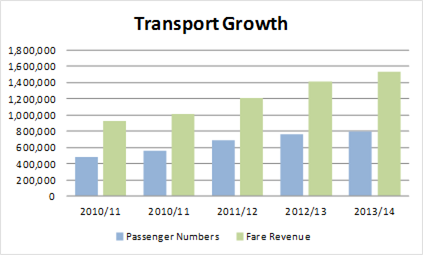
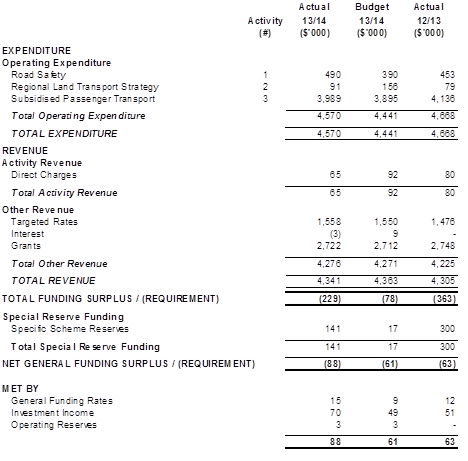
|
HBRC
Audited 2013-14 Annual Report
|
Attachment 1
|
Activity 1 – Regional Road Safety
|
Service Levels and Performance Targets
Activity 1– Regional Road Safety
|
|
Level of Service Statement
|
Level of Service Measure
|
2013-14 Performance Targets
|
2013-14 Year End Results
|
|
HBRC will engage, co-ordinate and implement sustainable regional
road safety initiatives so that Hawke’s Bay roads and pathways are safe
and accessible, and that the emotional and financial costs of road traffic
crashes are reduced
|
Effectively implement Regional Safety Action Plans with the
relevant objectives of the Regional Land Transport Strategy; Safer Journeys
2020; and the New Zealand Injury Prevention Strategy
|
2013-22
Regional
Safety Action Plans for Wairoa, Napier, Hastings, and Central Hawke’s
Bay will be reviewed quarterly with a focus on key issues to be addressed
Road
safety programmes are implemented to reduce the incidence and severity of
road traffic crashes and to align with the key outcomes and issues in the
RoadSafe Strategic Plan
|
Achieved
Quarterly Regional Safety Action Plan meetings have
been held, with the latest taking place in June. These
meetings continue to be purposeful for the stakeholders and provide an
opportunity to identify joint projects.
Achieved
Programmes have been undertaken as per the RoadSafe
Strategic Plan. The plan focuses on the region’s high risk categories.
Quarterly reports have been completed for the Regional Transport Committee.
|
Financial Variances Explained
The budget for this
activity was exceeded with a cost to HBRC of $44,000 against a budget of
$20,500 (after reforecasting). This was mainly due to higher than budgeted
staff costs.
Activity 2
– Regional Land Transport Strategy
|
Service Levels and Performance Targets
Activity 2– Regional Land Transport Strategy
|
|
Level of Service Statement
|
Level of Service Measure
|
2013-14 Performance Targets
|
2013-14 Year End Results
|
|
Through
the region’s transport strategy HBRC will promote improved integration
of all transport modes, land use and efficient movement of freight
|
Approved
Regional Land Transport Strategy in place
|
2013-14
Implement
and report on current RLTS as required by statute
2015
Review
of RLTS completed by July 2015
|
Achieved
The Regional Land
Transport Strategy for 2012-2042 (RLTS) was adopted in June 2012.
Achieved
The RLTS has been
monitored by the Transport Advisory Group and reports have been provided to
the Regional Transport Committee as required.
|
|
Three
yearly Regional Land Transport Programme approved
|
2013-15
Implement
and report on Regional Land Transport Programme 2012-15 as required by
statute
|
Achieved
The Regional Land
Transport Programme is monitored by the Transport Advisory Group and regular
reports are provided to the Regional Transport Committee. Good
progress has been made with the implementation of high priority projects
during 2013-14.
|
Financial Variances Explained
This budget was under
spent, with 73% of the budget used. This was due to low staff costs and less
consultancy cost than budgeted.
Activity 3
– Subsidised Passenger Transport
|
Service Levels and Performance Targets
Activity 3– Subsidised Passenger Transport
|
|
Level of Service Statement
|
Level of Service Measure
|
2013-14 Performance Targets
|
2013-14 Year End Results
|
|
HBRC
will provide an accessible bus service and appropriate service infrastructure
within and between the Napier, Hastings and Havelock North urban areas that
will be expanded to meet the increasing need for public transport for the
people of Hawke’s Bay
|
In
accordance with Regional Land Transport Strategy
|
2013-15
Build
on the improvements made over the last 3 years and ensure current levels of
services are maintained and target any increase in funding towards improving
existing services
|
Achieved
Improvements made over the last 3-4 years have resulted in
increased (and still rising) passenger trips. There was a 5% increase
in patronage during 2013-14, when compared with the previous year.
Additional buses have been added to Route 12 to
address overloading issues at peak times, with costs offset by a reduction of
the express Hastings to Napier service which was under patronised.
|
|
Continue
improving signage, infrastructure and information at all bus stops
|
2013-14
Implement
bus-stop service level standards (as outlined in Regional Public Transport
Plan)
2013-15
Install
four additional bus shelters each year (two in Hastings and two in Napier)
|
Partially Achieved
In consultation with Hastings District Council
bus stop signage
has been installed throughout Hastings. Discussions are
continuing regarding the installation of similar signage at bus stops in
Napier.
Achieved
Two shelters have been installed in Napier and two
have been installed in Hastings.
|
|
Where
bus routes exist, at least 90% of residences and businesses are in the
following walking distances of a bus stop:
500m:
normal conditions
600m:
low density/outer areas
|
2013-15
Increase
the number of bus stops in Hastings and Napier to meet the measure in
the Regional Public Transport Plan
|
Not
Achieved
No
new bus stops have been installed during this period. The Regional
Public Transport Plan is to be reviewed during 2014-15 and bus routes are
under review. Bus stop installation may continue after this review.
|
|
Changes
in technology to be utilised to provide a better service
|
2013-14
Investigate
online top-ups for smartcards
|
Achieved
HBRC is part of a national electronic bus ticketing
project to develop a replacement system for regional councils. It is expected
that online top-ups will be a feature of this system.
|
|
Fare
payment systems are to be simple to understand; reviewed regularly and
accurately record passenger trip information
|
Fare
levels will be reviewed annually
|
2013-19
Fare
reviews to be undertaken annually
|
Achieved
Fares
were increased in September 2013 and the final stage of a three year fare
increase programme will be implemented in September 2014.
|
|
Integration
with other modes
|
Improve
integration between public transport and walking and cycling
|
2013-15
Investigate
further opportunities for installation of secure bike racks at major
bus stops
|
Not
Achieved
No
further bike racks have been installed at bus stops, as suitable sites have not
been identified. Bike racks on buses continue to be well-used, with
over 5647 bikes carried since the carriers were first installed.
|
|
Continue
to provide and deliver the Total Mobility scheme in Napier, Hastings and
Waipukurau for those unable to use public transport due to serious mobility
constraints
|
Membership
is increased and service delivered in accordance with New Zealand Transport
Authority guidelines
|
2013-15
Increase
by at least 5% a year
|
Achieved
Total membership recorded on the Council’s Total
Mobility database continues to increase.
Membership at June 2014 was 3261, an increase of 6.4%
on June 2013 membership.
|
Financial Variances Explained
The budget for this
activity was exceeded by $125,000 as revenue from New Zealand Transport Agency
subsidies was less than budgeted and cost indexation on the bus contract was
higher than predicted.
|
HBRC
Audited 2013-14 Annual Report
|
Attachment 1
|
Hawke’s
Bay Regional Council’s (HBRC) Governance and Community Engagement role
and responsibilities involve decision-making, keeping regional residents
informed, and ensuring that Hawke’s Bay people have a meaningful say on
the direction of their region.
This group
covers the following activities to deliver these roles and responsibilities.
Strategic
Alliances - involves HBRC working with a range of organisations - central
government, university, private sector groups and councils - to provide valued
services and research that is targeted and efficient.
Community
Engagement and Communication - encompasses all HBRC purposes and functions and
engagement with a broad range of stakeholders in the general community through
a variety of media.
Response to
Climate Change – outlines some of the measures that HBRC either has in
place or proposes to introduce to contribute to lowering carbon emissions in
Hawke’s Bay.
Community
Representation and Regional Leadership includes Council elections and the role
of Councillors in representing their constituent community, plus providing
opportunities for individuals and groups to influence decision-making.
Investment Company Support involves the
management and administration support provided to the Hawke’s Bay
Regional Investment Company Ltd.
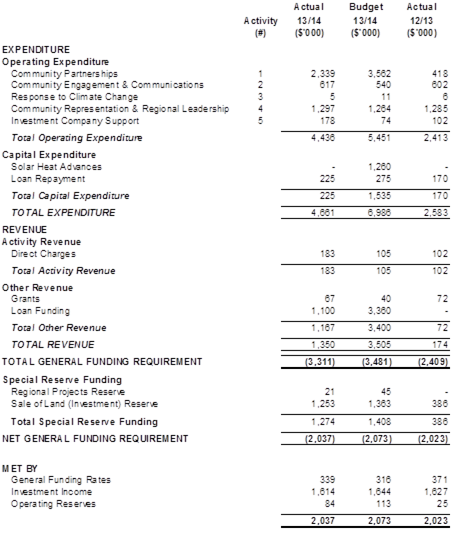
|
HBRC
Audited 2013-14 Annual Report
|
Attachment 1
|
Activity 1 – Community Partnerships
|
Service Levels and Performance Targets
Activity 1– Community Partnerships
|
|
Level
of Service Statement
|
Level
of Service Measure
|
2013-14
Performance Targets
|
2013-14
Year End Results
|
|
HBRC
will engage in strategic relationships that help better achieve its vision
and purposes.
|
Formalisation
of strategic alliances that are sector and institutionally-based.
|
2012-15
Create
a bi-annual forum of primary production sector associations.
Determine
shared services opportunities with Hawke’s Bay councils and wider
regional sector allies
|
Achieved
The
Pan-Sector Group has been formed through the Land Management Team, comprising
agencies across the primary production sector. The aim of the Pan-sector
Group is to
collaboratively develop and coordinate a industry based strategic approach to
sustainable land management that aims to increase the economic benefit from
primary industry throughout Hawke’s Bay while considering processes to
manage and mitigate the effects of current and
potential land uses on water quality in the region. The Group’s
immediate focus is on realizing the economic, environmental and social
benefits from the Ruataniwha Water Storage Project.
The Group meets 3-4 times per year.
Achieved
A Shared Services
Company (HBLASS Ltd) was incorporated in December 2012. Membership of the
Board comprises the CEOs of the 5 local authorities and an independent
Chairman. The Statement of Intent for 2014/15 was adopted by HBRC in February
2014.
Several
work streams have been progressed, principally vehicle fleet management and
the establishment of a GIS Shared Service
|
|
HBRC
will work in partnership with treaty claimant groups to govern natural
resources and to jointly explore sustainable economic opportunities in
Hawke’s Bay.
|
Regional
Planning Committee operating successfully.
|
2012-15
Regional
Planning Committee permanently established.
|
Partially
Achieved
The
Hawke’s Bay Regional Planning Committee Bill, to which HBRC is a party,
was introduced in to the House on 16 April 2014.
|
|
HBRC
will contribute to support the development of Regional Public Infrastructure
projects.
|
Evaluation
of Regional Public Infrastructure projects and which to support.
|
2013-14
- $2M
provision is made for regional hockey turf facilities in Hawke’s Bay,
requiring that the HB Hockey Association, the Hawke’s Bay Hockey
Artificial Surfaces Trust, the Regional Sports Park Trust and the Napier City
and Hastings District councils, produce an acceptable and agreed Plan for any
new Regional hockey turf facilities that complies with Council’s
Regional Community Facilities fund policy.
|
Achieved
Council has paid $2M to the Regional Sports Park
Trust for the construction of a Tier one hockey turf, which has since been
completed.
|
|
|
|
- $500,000
for the upgrade of the Wairoa Community Centre/Alexander Park in Wairoa
District.
|
Not Achieved
Wairoa District Council has now completed its
fundraising for the Community Centre upgrade and is finalising the design
stage of the project. Construction is expected to begin in late 2014 with
completion by mid-2015.
|
|
|
|
- $500,000 for the provision of a Visitor and Education Centre at
Te Mata Peak in Hastings District, subject to negotiations with the Te Mata
Park Trust and the Hastings District Council to ensure the best possible
alignment with HBRC’s policy for Community Facilities and brand
recognition.
|
Not Achieved
The Te Mata Park Trust Board advises that in August
2014 they are commencing fundraising for the final money (approx $1M, with
$3.3M already secured) and are targeting a build commencement in mid-2015.
|
Financial Variances Explained
A sum of $3m was provided in the budget for targeted assistance to
the Hawke’s Bay Regional Sports Park facility, Wairoa Community Centre
and Te Mata Park Trust. This targeted assistance was budgeted to be met
by loan funding ($2.1m) and Council reserves ($0.9m).
During the year $2m was paid to the Regional Sports Park for the
regional hockey turf, and this was funded from loans ($1.1m) and Council
reserves ($0.9m).
The $1m targeted assistance and associated loan funding for Wairoa
and Te Mata Park has been carried forward by Council to the 2014-15 financial
year.
Activity 2
– Community Engagement & Communications
|
Service Levels and Performance Targets
Activity 2– Community Engagement & Communications
|
|
Level of Service Statement
|
Level of Service Measure
|
2013-14 Performance Targets
|
2013-14 Year End Results
|
|
HBRC
will communicate its purpose and direction to the community. The community
will know what it is being done and why.
|
On-time
delivery of Annual Plan, plan change, State of the Environment and statutory
documents.
|
2013-15
Long
Term Plan, State of the Environment, Annual Report, Tukituki Plan change.
|
Achieved
Delivered
2012-13 Annual Report, Summary Annual Report and 2013-14 Draft Annual Plan,
Summary Draft Plan and Annual Plan.
|
|
Councillors,
Executive and staff available to speak/inform on HBRC activities.
|
2013-15
Measure
number of interactions.
|
Achieved
Engaged through HB Home & Garden Show, HB 150th
A&P Show (Ruataniwha storage and bio-security/ diversity expo stands),
Chamber Business Awards, Ballance Farm Environment Awards, Irrigation NZ
Conference, Better Home and Living Show, National Horticultural Field Day,
Walk and Talk Series, planting days, educational workshops and HB Trails
events
|
|
Number
of media releases generated; uptake of digital technologies.
|
2013-15
90
Releases; Number of social media posts.
|
Achieved
127 media releases of which 105 were covered by
media, 153 Facebook posts and 26 tweets in period
|
|
Regional
newsprint media coverage averages > 90% positive/neutral.
|
2013-15
Not
less than 95% average
|
Achieved
Media coverage at 96.3% positive/ neutral
|
|
HBRC
will provide opportunities for the community to be involved in its decision
making processes. Community engagement will be a key component of all major
programmes and projects.
|
Number
of council meetings and workshops.
|
2013-15
Open
reporting of Council/ Committee items.
|
Achieved
44
Council and Committee meetings held in reporting period, of these eleven (11)
had a public-excluded element
|
|
Clearly
flagged opportunities for input, submissions and other feedback into HBRC
documents.
|
2013-15
Refresh and
maintain annual HBRC Communications Plan
|
Achieved
Continuous
improvement through communications strategy and targeted communication plans
|
|
Number
of public meetings, workshops and public events (includes awards and field
days).
|
2013-15
Meetings,
workshops and events strongly considered for major projects and in
HBRC’s statutory role
|
Achieved
In
addition to the interactions outlined above a special consultative process
was undertaken for investment in the Ruataniwha Water Storage Scheme. 17
public meetings were held as part of this process and approximately 500
people attended.
Four
annual plan public meetings were held and the total attendance was between 20
and 30.
Regular
meetings held for TANK Group, HB Biodiversity Strategy and Pan-Sector Group.
Twenty
meetings specific to potential water users (Ruataniwha storage)
|
|
HBRC
will provide information that is relevant to the community and communities of
interest. Information will be audience appropriate.
|
Delivery of updates on HBRC activities and progress.
|
2013-15
Generate
region, community and consent holder/ catchment newsletters
|
Achieved
Targeted
newsletters: Our Place (x3), Rates Update, RWSS consultation flyer; In the
Zone newsletters, leaders Briefing, Step Out (schools) and newsletters to
leaseholders.
|
|
Facilitation of agreed stakeholder groups.
|
2013-15
Audit
number of groups
|
Achieved
93
active partnerships as of March 2014
|
|
Timely delivery information to communities of interest.
|
2013-15
Appropriate
‘tool’ selected according to programme needs
|
Achieved
Council
uses a range of channels to suit programmes and activities, including
websites, publications, newspapers, radio, social media posts, brochures and
events
|
Financial Variances Explained
The
overall project proceeded in accordance with the programme, with budget
variance due to additional Ruataniwha Water Storage requirements with external
contributors.
Activity 3
– Response to Climate Change
|
Service Levels and Performance Targets
Activity 3– Response to Climate Change
|
|
Level of Service Statement
|
Level of Service Measure
|
2013-14 Performance Targets
|
2013-14 Year End Results
|
|
HBRC
will increase the community’s resilience to climate change
|
HBRC’s
corporate total annual Greenhouse Gas emissions measure in carbon dioxide
equivalents (excluding Port of Napier Ltd)
|
2012-22
Reduce
corporate (excluding Port of Napier Ltd) carbon emissions from 2005/06 by:
· 10% by
2014
· 20% by
2020
· 30% by
2050
|
Monitoring of carbon emissions is being undertaken
and strategies for reducing those emissions implemented.
Staff preparing report to Council late in 2014.
|
|
Number
of sectors through which HBRC promotes / influences reduction in carbon
emissions and adaptation to climate change
|
2013
Establish
a process to monitor and report regional carbon emissions with the first
report completed by 30 June 2013
Funding
for conversion of 100 dwellings to solar hot water.
2013-19
Continue
to increase HBRC’s influence in initiatives to improve regional resilience
to the impacts of climate change.
Continue
to update and report regional carbon emissions at least every 3 years.
|
Achieved
A system to quantify regional green house emissions
has been developed by Landcare Research. This requires substantial data
gathering. Staff preparing report to Council late in 2014.
Not Achieved
HBRC has yet to receive a business case for the
establishment for a Solar Hot Water Scheme from Napier City and Hastings
District councils. Provision is still available for loan funding should the
scheme be initiated.
Achieved
A number of initiatives included in HBRC Strategic
document and LTP are being implemented.
A report entitled Global Climate Change and
Barrier-beach responses has been completed and published. This predicts
a significant increase in risk along the regions coast by 2100. HBRC
have initiated the development in conjunction with territorial authorities of
a coastal strategy to determine appropriate mitigation of the impact of this
hazard.
Not Achieved.
Gathering
of information for this report has commenced. Report completion programmed
for presentation to Council during 2014/15.
|
Financial Variances Explained
There were no significant
variances from budget are in this activity.
Activity 4
– Community Representation & Regional Leadership
|
Service Levels and Performance Targets
Activity 4– Community Representation & Regional
Leadership
|
|
Level
of Service Statement
|
Level
of Service Measure
|
2013-14
Performance Targets
|
2013-14
Year End Results
|
|
HBRC
will provide the community with a channel for representation through elected
members and Iwi to enable access and influence on decision making.
|
Councillors’
attendance at monthly Council and Committee meetings achieving at least 90%
attendance of elected and appointed members.
|
2012-22
Attendance rate
of 90%.
|
Achieved
40
Council and Committee meetings were held, with attendance rate of 91%.
|
|
Attendance
at Maori Committee meetings.
|
2012-22
Attendance rate
of 80%
|
Achieved
The
Maori Committee held 5 meetings during the year, with an attendance rate of
84%.
|
|
10
Year Plan/Annual Plan consultation during April and May with the final Plan
being adopted by HBRC by 30 June.
|
2012-22
Consultation and
submission period of at least 25 working days.
|
Achieved
Draft Annual Plan 2014-15 publicly notified 2 April
2014 with submissions closing date 12 May 2014, providing 25 working days.
|
|
Comply
with the provisions of the Local Electoral Act 2001.
|
2013-14
Elections to be
held 12 October 2013.
|
Achieved
Elections held and final results confirmed Wednesday,
16 October 2013.
|
|
HBRC
will aim to maximise Local Government effectiveness and efficiency.
|
Facilitate and report on Local Government
efficiencies achieved.
|
2012-22
Complete
a review, in consultation with territorial authorities within the region,
which will cover:
Opportunities
for inter-regional and central government collaboration.
How
the Hawke’s Bay economy might be further diversified and made more
resilient.
The
role of Local Government in Hawke’s Bay in enabling socioeconomic
development, and the effectiveness of Local Government structures including
planning and compliance frameworks are to be studied.
|
Achieved
The
Study on Improving the Social and Economic Performance of Hawke’s Bay
was initiated in April 2012 with the appointment of McGredy Winder & Co.
The
Terms of Reference called for two phases of work. The first phase was
completed in August 2012.
Phase
2, which assessed the costs and benefits of three alternative local
government structures, was completed in June 2013. It provides a financial
model that can be applied to other local government options within
Hawke’s Bay.
A
Shared Services Company (HBLASS Ltd) was incorporated in December 2012.
Membership of the Board comprises the CEOs of the 5 local authorities and an
independent Chairman. The Statement of Intent for 2014-15 was considered by
Council in February 2014 and no amendments were sought by Council.
Several work streams have been progressed,
principally vehicle fleet management and the appointment of a Regional GIS
Manager.
|
Financial Variances Explained
There were no significant
variances from budget are in this activity.
Activity 5
– Investment Company Support
|
Service Levels and Performance Targets
Activity 5– Investment Company Support
|
|
Level of Service Statement
|
Level of Service Measure
|
2013-14 Performance Targets
|
2013-14 Year End Results
|
|
HBRC
will provide support services to the Investment Company and to any associated
subsidiaries of the Investment Company.
|
A
number of Board meetings to be supported by HBRC staff.
|
2012-22
Provide
support for the Board meetings of the Investment Company and subsidiaries.
Confirm the
Statement of Corporate Intent each year.
|
Achieved
Administrative
and finance support provided as agreed.
Final
Statement of Corporate Intent 2014-15 approved by Council on 28 May 2014.
|
Financial Variances Explained
The actual costs incurred
for this project were $177,000 as compared to the budget of $74,000. All
costs were recovered from the Hawke’s Bay Regional Investment Company
Ltd.
|
HBRC
Audited 2013-14 Annual Report
|
Attachment 1
|
Financial
Statements
Comprehensive
Income Statement
For
the year ended 30 June 2014
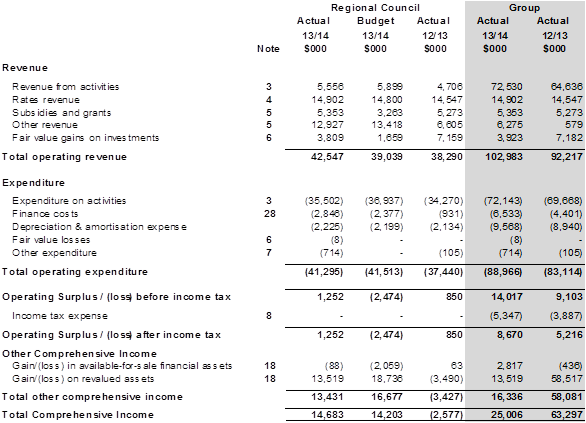
The
accompanying notes form part of these financial statements.
Statement of
Changes in Equity
For
the year ended 30 June 2014
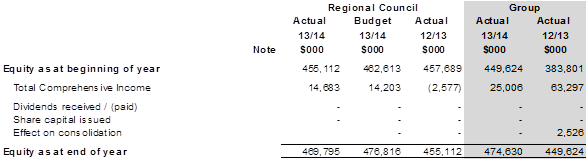
The
accompanying notes form part of these financial statements.
|
HBRC
Audited 2013-14 Annual Report
|
Attachment 1
|
Balance Sheet
For
the year ended 30 June 2014
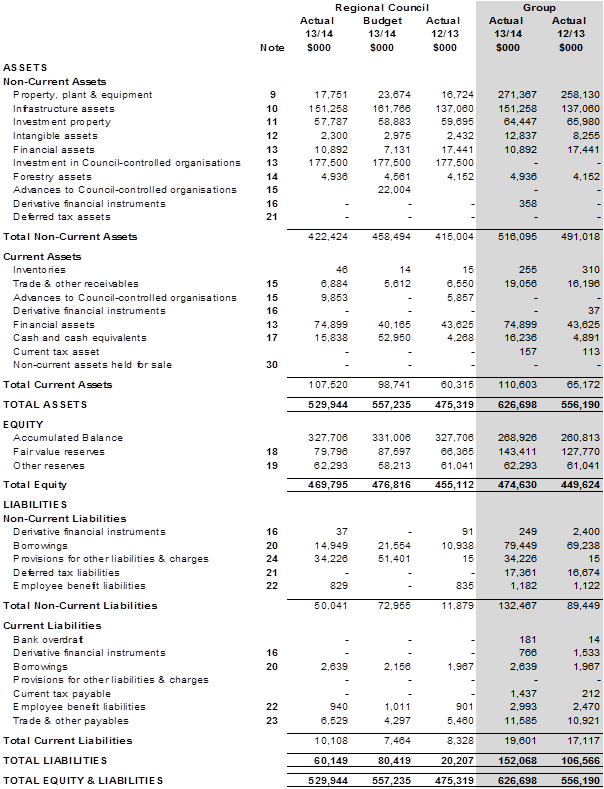
The
accompanying notes form part of these financial statements.
|
HBRC
Audited 2013-14 Annual Report
|
Attachment 1
|
Statement of Cash Flows
For
the year ended 30 June 2014
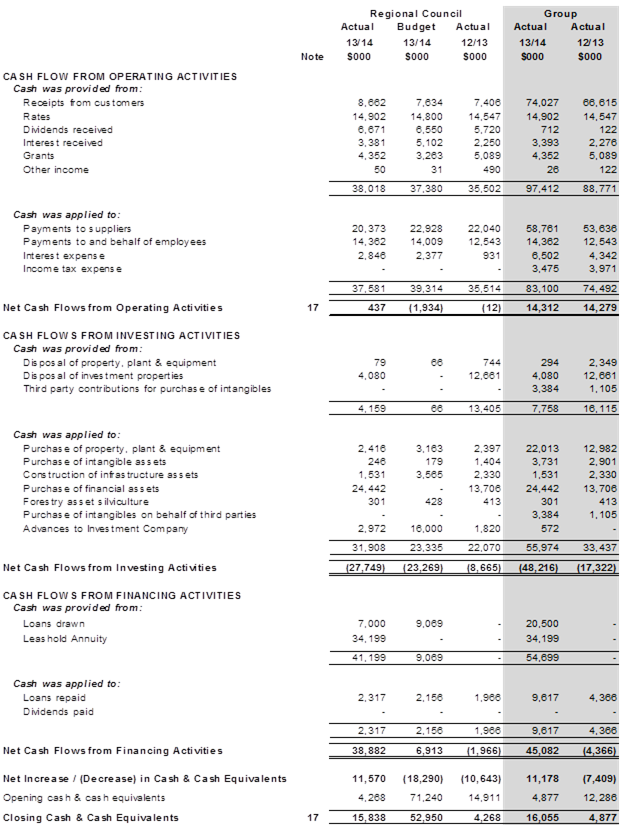
The
accompanying notes form part of these financial statements.
|
HBRC
Audited 2013-14 Annual Report
|
Attachment 1
|
Notes to the
Financial Statements
Note 1: General
Information
1.1 Reporting
Entity
The Hawke's Bay Regional Council
(Council) is a regional local authority governed by the Local Government Act
2002 and is domiciled in New Zealand.
The Hawke’s Bay Regional Council
group (group) consists of the parent, the Council, and its subsidiaries, The
Hawke’s Bay Regional Investment Company Limited (HBRIC) and the Port of
Napier Limited (Port). HBRIC is a 100% owned subsidiary of Council and
the Port is a 100% subsidiary of HBRIC. Both companies are incorporated
and domiciled in New Zealand.
The primary objective of Council is to
provide services for the community and social benefit rather than making a
financial return. Accordingly, The Council has designated itself and the
group as public benefit entities for the purposes of New Zealand equivalents to
International Reporting Standards (NZ IFRS).
The financial statements of the
Council and group are for the year ended 30 June 2014 and were authorised for
issue on 24 September 2014 by the Council.
1.2 Basis
of Preparation
The financial statements have been
prepared in accordance with the Local Government Act 2002, which includes the
requirement to comply with New Zealand generally accepted accounting practice
(NZ GAAP).
These financial statements have been
prepared in accordance with NZ GAAP as appropriate for public benefit entities
adopting NZ IFRS and other applicable New Zealand Financial Reporting
Standards.
The statements have been prepared under
the historic cost convention, as modified by the revaluation of land and
buildings, infrastructure assets, hydrological equipment, investment property,
forestry assets and financial instruments.
The group’s functional currency
is New Zealand dollars and the statements have been presented in thousands of
dollars ($’000) exclusive of New Zealand Goods and Services Tax (GST)
except for trade accounts payable and receivable, which are stated at GST
inclusive amounts.
Note 2: Summary of
Significant Accounting Policies
The principal accounting policies
applied in the preparation of these financial statements are set out
below. These policies have been consistently applied to all the years
presented, unless otherwise stated.
2.1 Consolidation
The Port has a financial year ending
on 30 September. In order to consolidate the subsidiary, a reporting
package with a financial year ending on 31 March is produced so as to avoid
peak seasonal work periods. The subsidiary is accounted for using the
purchase method, which involves adding together corresponding assets,
liabilities, revenues and expenses on a line-by-line basis. All
significant inter-entity transactions are eliminated and significant
transactions occurring during the period 1 April to 30 June are adjusted
for.
2.2 Inventories
Inventories are stated at the lower of
cost (using the weighted average cost method) and net realisable value.
2.3 Trade
Receivables
Trade receivables are recognised
initially at fair value and subsequently re-measured each balance sheet date at
amortised cost using the effective interest method less provision for
impairment.
2.4 Plant,
Property and Equipment
(2.4.1) Operational Assets
Council land and buildings
are shown at fair value less subsequent accumulated depreciation, based on
periodic, but at least triennial, valuations by independent,
professionally qualified valuers.
Hydrological equipment is
shown at fair value less subsequent accumulated
depreciation, based on periodic, but at least
triennial, valuations by suitably experienced Council employees, on the basis
of depreciated replacement cost. Independent, professionally qualified
valuers review all such valuations.
All other operational
assets (including Port assets for consolidated financial statements) are stated
at historical cost less accumulated depreciation. Historical cost
includes expenditure that is directly attributable to the acquisition of the
items.
The costs of asset
constructed by the group include the cost of all materials used in
construction, direct labour on the project and an appropriate amount of
directly attributed costs. Costs cease to be capitalised as soon as the
asset is ready for productive use.
(2.4.2) Infrastructure
Assets
Infrastructure assets are tangible
assets that are necessary to fulfil the Council’s obligations in respect
of the Soil Conservation and Rivers Control Act 1941 and the Drainage Act
1908. Such assets usually show some or all of the following
characteristics:
· They
are part of a system or network that could not provide the required level of
service if one component was removed.
· They
enable the Council to fulfil its obligations to the region’s communities
in respect of flood control and drainage legislation.
· They
are specialised in nature and do not have alternative uses.
· They
are subject to constraints on removal.
Infrastructure assets are shown at
fair value less subsequent accumulated depreciation, based on periodic, but at
least triennial, valuations by suitably experienced Council employees, on the
basis of depreciated replacement cost. Independent, professionally
qualified valuers review all such valuations.
(2.4.3) Subsequent Costs
Subsequent costs are included in the
asset’s carrying amount or recognised as a separate asset, as
appropriate, only when it is probable that future economic benefits associated
with the item will flow to the Council or group and the cost can be measured
reliably. All other repairs and maintenance are charged to the comprehensive
income statement during the financial period in which they are incurred.
(2.4.4) Revaluation
Adjustments
Increases in carrying amounts arising
from revalued assets are credited to revaluation reserves in equity.
Decreases that offset previous increases of the same asset category are charged
against revaluation reserves in equity. All other decreases are charged
to the comprehensive income statement.
Any accumulated depreciation at the
date of revaluation is eliminated against the gross carrying amount of the
asset and the net amount is restated to the revalued amount of the asset.
(2.4.5) Other Adjustments
Gains and losses on disposals are
determined by comparing proceeds with carrying amount. These are included
in the comprehensive income statement. When revalued assets are sold, the
amounts included in revaluation reserves are transferred to the accumulated
balance in equity.
2.5 Investment
Property
Investment property is residential and
commercial land and buildings held to earn rental income and for capital
appreciation. Such property is initially recognised at cost. At
each balance sheet date investment property is measured at fair value,
representing open market value determined annually by independent,
professionally qualified valuers. A gain or loss in value is recorded in
the comprehensive income statement for the period in which it arises.
Under the Hawke’s Bay Endowment
Land Empowering Act 2002, rental income from endowment land in Hawke’s
Bay can only be used for the improvement, protection, management or use of
Napier Harbour or the Regional Council’s coastal marine area as defined
in section 2 (1) of the Resource Management Act 1991. Unspent funds are
held in the Coastal Marine Area Reserve Fund.
2.6 Forestry
Crops
Forestry crops are
measured at their fair value less estimated point-of-sale costs each balance
sheet date by independent, professionally qualified valuers. Fair value
is determined by the present value of expected net cash flows discounted by the
current market-determined pre-tax rate. A gain or loss in value is
recorded in the comprehensive income statement for the period in which it
arises.
2.7 Financial
Assets
Financial assets are designated at
initial recognition into one of the four following categories set out below
depending on the purpose for which the financial asset was acquired. At
each balance sheet date, all financial asset designations are re-evaluated.
(2.7.1) Financial Assets
at Fair Value through Profit or Loss
Financial assets are
classified in this category if acquired principally for the purpose of selling
in the short term or are so designated by management. The category
includes derivatives and has two sub-categories: financial assets held for
trading, and those designated at fair value through the profit and loss at
inception. Assets held in this category are classified as current assets
if they are either held for trading, or are expected to be realised within 12
months of balance sheet date.
Financial assets in this
category, including derivatives, are initially recognised at fair value and are
measured at each balance sheet date at fair value. Realised
and unrealised gains or losses in value are recorded in the comprehensive
income statement for the period in which they arise.
(2.7.2) Loans and
Receivables
Loans and receivables are
non-derivative financial assets with fixed or determinable payments that are
not quoted in an active market. They are included in non-current assets
except when maturities are shorter than 12 months from balance sheet date.
Financial assets in this
category are initially recognised at fair value plus transaction costs that are
directly attributable to their acquisition or use. At each balance sheet
date these financial assets are measured at amortised cost using the effective
interest method. Realised and unrealised
gains or losses in value are recorded in the comprehensive income statement for
the period in which they arise.
(2.7.3) Held-to-Maturity
Investments
Held-to-maturity
investments are non-derivative financial assets with fixed or determinable
payments and fixed maturities that management have a positive intention and
ability to hold to maturity.
Financial assets in this
category are initially recognised at fair value plus transaction costs that are
directly attributable to their acquisition or use. At each balance sheet
date these financial assets are measured at amortised cost using the effective
interest method. Realised and unrealised
gains or losses in value are recorded in the comprehensive income statement for
the period in which they arise.
(2.7.4) Available-for-Sale
Assets
Available-for-sale
financial assets are non-derivative financial assets that are either designated
in this category or are not classified in any of the other categories.
They are included in non-current assets unless there is an intention to dispose
of the investment within 12 months of balance sheet date.
Available-for-sale
financial assets are carried at fair value
using a quoted price if an active market exists or using discounted valuation
techniques if no active market exists. Any gain or loss in value is
recognised directly in equity through the statement of changes in equity for
the period in which it arises.
When an available-for-sale
financial asset is sold, the accumulated fair value adjustments are included in
the comprehensive income statement.
At each balance sheet
date, an assessment is made whether there is any objective evidence that a
financial assets or group of financial assets is impaired. If objective
evidence of impairment exists for available-for-sale
financial assets, then any cumulative loss is transferred from equity to the
comprehensive income statement. Such a transfer is not reversible.
2.8 Intangible
Assets
Intangible assets comprise acquired computer
software licences and development expenditure. All intangible assets with
finite lives are carried at the historical cost incurred to acquire and bring
into use the specific software less accumulated amortisation.
2.9 Impairment
of Non-Financial Assets
Assets that have an indefinite useful
life are not subject to amortisation and are tested for impairment at each
balance sheet date. Assets that are subject to amortisation are reviewed
for impairment whenever events or changes in circumstances indicate that the
carrying amount may not be recoverable. An impairment loss is recognised
in the comprehensive income statement for the amount by which the asset’s
carrying amount exceeds its recoverable amount. The recoverable amount is
the higher of an asset’s fair value less costs to sell and value in
use. For the purposes of assessing impairment, assets are grouped at the
lowest levels for which there are separately identifiable cash flows.
2.10 Depreciation
and Amortisation
Land, reserves and hard dredging are
not depreciated. Depreciation on other assets is calculated using the
straight-line method to allocate their cost or revalued amounts to their
residual values over their estimated useful lives. Assets’ residual
values and useful lives are reviewed, and adjusted if appropriate, at each
balance sheet date. Major depreciation and amortisation periods are as
follows.
|
Asset
Category
|
Years
|
|
Buildings
|
10
- 100
|
|
Site
Improvements
|
10
- 40
|
|
Wharves
& Jetties
|
10
- 80
|
|
Vehicles
|
3 - 10
|
|
Plant &
Equipment
|
3 - 25
|
|
Computer
Equipment
|
3
- 5
|
|
Computer
Software & Licences
|
3
- 10
|
|
Infrastructure
Assets
|
10
- 70
|
|
Soft
Dredging
|
6
- 8
|
No depreciation is provided for stop
banks, berm edge protection, sea or river groynes, drainage works, sawfly
protection, or unsealed roads. These assets are not considered to
deteriorate over time and, therefore, will provide a constant level of service
unless subjected to a significant flood event.
2.11 Cash
and Cash Equivalents
Cash and cash equivalents include cash
in hand, deposits held at call with banks, other short-term highly liquid
investments with original maturities of three months or less, and bank
overdrafts. Bank overdrafts are shown within borrowings in current
liabilities in the balance sheet.
2.12 Borrowings
Borrowings are recognised initially at
fair value, net of transaction costs incurred. Borrowings are
subsequently stated at amortised cost. Any difference between the
proceeds (net of transaction costs) and the redemption value is recognised in
the comprehensive income
statement
over the period of the borrowings using the effective interest method.
Borrowings are classified as current
liabilities unless the group has an unconditional right to defer settlement of
the liability for at least 12 months after the balance sheet date.
Borrowing costs are recognised as an
expense when incurred except to the extent that they are capitalised.
Borrowing costs that are directly attributable to the acquisition, construction
or production of an asset are capitalised as a part of the cost of that asset.
2.13 Income
Tax
Income tax expense charged to the
comprehensive income statement includes both current and deferred tax and is
calculated after allowing for non-assessable income and non-deductible costs.
Deferred income tax is provided using
the balance sheet liability method, providing for temporary differences between
the carrying amounts of assets and liabilities for financial reporting purposes
and the amounts used for taxation purposes. Temporary differences are not
provided for where the initial recognition of assets and liabilities does not
affect either accounting or taxable profit. The amount of deferred tax
provided is based on tax rates enacted or substantively enacted at the balance
sheet date and are expected to apply when the related deferred tax liability is
settled.
A deferred tax asset is recognised
only to the extent that it is probable that future taxable profits will be
available against which the asset can be utilised. Deferred tax assets
are reduced to the extent that it is no longer probable that the related tax
benefit will be realised.
2.14 Employee
Benefits
Short-term employee benefits including
salaries and wages, annual leave and contributions to superannuation schemes
are recognised when they accrue to employees and are measured at undiscounted
cost.
The liability for accumulating sick
leave is stated as the cost of sick leave that is expected to be used.
Long-term employee benefits including
long service leave and retirement gratuities are recognised at the present
value of the Group’s obligation at balance sheet date.
2.15 Provisions
Provisions are recognised when:
· the Group has a present
legal or constructive obligation as a result of past events, and
· it is more likely than not
that an outflow of resources will be required to settle the obligation, and
· the
amount has been reliably estimated.
Provisions are measured at the present
value of the expenditures expected to be required to settle the obligation
using a pre-tax rate that reflects the current market assessments of the time
value of money and risks specific to the obligation. The increase in the
provision due to passage of time is recognised as interest expense
Provisions are not recognised for
future operating losses.
2.16 Revenue
Recognition
Revenue comprises the fair value for
the sale of goods and services, net of GST, rebates and discounts and after elimination
of sales within the Group. Revenue is recognised as follows:
· Sales
of goods are recognised when a product is sold to a customer. The
recorded revenue is the gross amount of the sales.
· Sales
of services are recognised in the accounting period in which the services are
rendered, by reference to the completion of the specific transaction assessed
on the basis of the actual service provided as a proportion of the total
service provided.
· Interest
income is recognised on a time proportion basis using the effective interest
method.
· Dividend
income is recognised when the right to receive payment is established.
· Government
grants are recognised as income when eligibility has been established by the
grantor agency.
· Rates
are recognised as income in the accounting period in which they are set and
assessed.
2.17 Leases
Finance leases, which transfer to the
Group substantially all the risks and benefits incidental to ownership of the
leased item, are capitalised at the inception of the lease at the fair value of
the leased property or, if lower, at the present value of the minimum lease
payments.
Lease payments are apportioned between
the finance charges and reduction of the lease liability so as to achieve a
constant rate of interest on the remaining balance of the liability.
Finance charges are included in the comprehensive income statement as finance
costs.
Capitalised leased assets are
depreciated over the shorter of the estimated useful life of the asset and the
lease term.
Leases in which a significant
proportion of the risks and benefits of ownership are retained by the lessor
are classified as operating leases. Payments made under operating leases
are charged to the comprehensive income statement on a straight-line basis over
the period of the lease.
2.18 Financial
Risk Management
The Group’s activities expose it
to a variety of financial risks including:
· Market
risk, including currency risk, fair value interest rate risk and price risk;
· Credit
risk;
· Liquidity
risk; and
· Cash
flow interest-rate risk.
The Group’s overall risk
management programme focuses on the unpredictability of financial markets and
seeks to minimise potential adverse effects on the Group’s financial
performance. The Group uses derivative financial instruments such as
foreign exchange contracts and interest rate swaps to hedge certain exposures.
The Group enters into foreign currency
forward exchange contracts to hedge foreign currency transactions, when
purchasing major property, plant and equipment and when payment is denominated
in foreign currency.
Interest rate swaps are entered into
to manage interest rate risk exposure.
The Group has no significant
concentrations of credit risk. It has policies in place to ensure that
services are provided to customers with an appropriate credit history.
Collateral or other security in not
required for financial instruments subject to credit risk.
2.19 Accounting
for Derivative Financial Instruments and Hedging Activities
Derivatives are initially recognised
at fair value on the date a derivative contract is entered into and are
subsequently remeasured at the fair value at each balance sheet date.
Where the Group determines that it
will hedge a transaction the Group documents at the inception of the
transaction the relationship between hedging instruments and hedged items, as
well as the its risk management objective and strategy for undertaking various
hedge transactions.
The Group also documents its
assessment, both at inception and on an ongoing basis, of whether the derivatives
that are used in hedging transactions are highly effective in offsetting
changes in fair values of hedged items.
(2.19.1) Cash Flow Hedge
The effective portion of changes in
the fair value of derivatives that are designated and qualify as cash flow hedges
are recognised in equity. The gain or loss relating to the ineffective
portion is recognised immediately in the comprehensive income statement.
The Group accounts for hedges of foreign currency risk of a firm commitment as
cash flow hedges.
(2.19.2) Derivatives that
Do Not Qualify for Hedge Accounting
Certain derivative instruments do not
qualify for hedge accounting and changes in the fair value of these instruments
are recognised immediately in the comprehensive income statement.
Any changes in the fair value of
interest rate swaps due to changes in interest rates are recognised in the
comprehensive income statement in the period in which they occur.
2.20 Foreign
Currencies
Transactions in foreign currencies are
translated at the New Zealand rate of exchange ruling at the date of the
transaction. At balance sheet date foreign monetary assets and
liabilities are translated at the closing rate and exchange variations arising
from these are included in the comprehensive income statement.
2.21 Basis
of Allocation of Council’s Indirect Costs
Clearly identifiable costs are
directly charged against each activity. Indirect costs are allocated to
cost centres in the first instance under a variety of methods including:
· Floor
area occupied
· Number
of full time equivalent employees
· Assessed
use of various services provided.
These costs are then charged to
projects on a labour standard costing basis. The allocation unit is each
working hour charged by employees at a pre-determined rate. Variances
arising from this method will be allocated on the same basis as for costs of a
fixed nature referred to above. Project costs are then summarised for
each activity and group of activities.
2.22 Changes
in Accounting Policies
There have been no changes to
accounting policies.
|
HBRC
Audited 2013-14 Annual Report
|
Attachment 1
|
Note 3: Groups of Activities Revenue & Expenditure
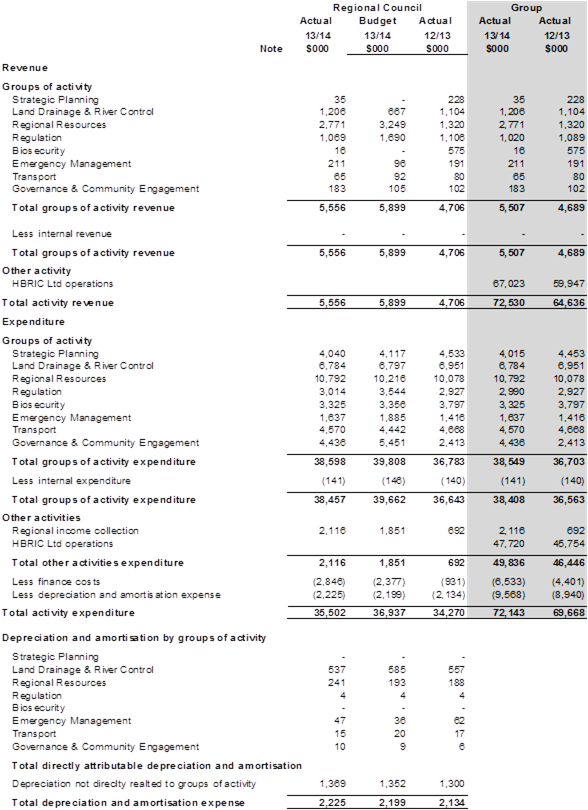
Note
4: Rates Revenue
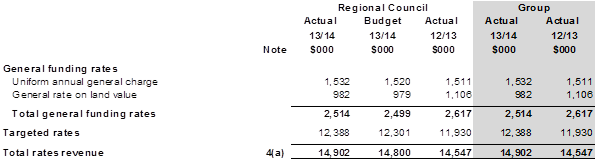
Note 4(a)
Under Council's rates
remission policy for multiple ownership land, 84 rates remissions were
approved, totaling $41,989 (2012-13 99 remissions totaling $40,054).
Rating base
information
The number of rating units
within the region as at June 2014 are 70,046.
The total capital value of
rating units within the region as at 30 June 2014 is $30,588,812,400.
The total land value of
the rating units within the region as at 30 June 2014 is $15,547,998,650.
Note
5: Other Revenue
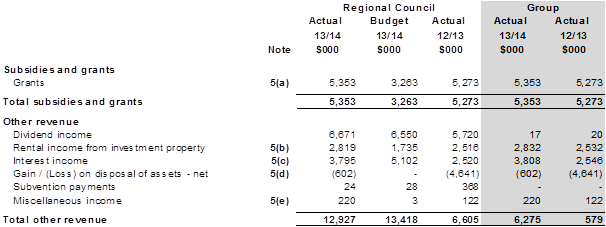
Note 5(a)
Government grants are
received from the New Zealand Transport Agency for bus services and road safety
projects, New Zealand Trade and Enterprise for regional development projects,
Ministry of Justice and the Ministry for the Environment for Iwi initiatives,
and the Ministry of Primary Industries for afforestation, environmental and
water initiative projects. The grants are recognised as revenue upon
entitlement, as conditions pertaining to eligible expenditure have been
fulfilled. There are no unfulfilled conditions and other contingencies
attached to the grants recognised as other revenue.
Note 5(b)
Under the Hawke's Bay
Endowment Land Empowering Act 2002, income from leasehold endowment land can
only be used for the improvement, protection, management or use of Napier
Harbour or the Regional Council's coastal marine area as defined in section
2(1) of the Resource Management Act 1991. Unspent income is held in the Coastal
Marine Area Reserve Fund. The 2013-14 budget assumed that the Wellington
leasehold investment property held by the Council would be sold during the
2013-14 financial year. These sales did not take place due to the cash
flows not being required and the solid return from these investments.
Note 5(c)
The 2013-14 budget assumed
the sale of Napier leasehold cash flows would take place early in the financial
year and interest would be earned of approximately $2.0 million on this lump
sum. This transaction was not completed until December 2013 and so the
interest was earned over 6 months and the amount received was $37 million
rather than the $51 million estimated in the Annual Plan.
Note 5(d)
There was a loss on
disposal on the sale of endowment leasehold property of $4,000 which continue
to sell even though Council are no longer offering discounts as an incentive
for leaseholders to freehold their properties. The Council has taken a
loss on investment in VHB writing off the debt and investment costs of
$292,000.
Note 5(e)
Miscellaneous income
includes $193,000 for uncollectable rates provisions which are no longer
required and have been released.
Note
6: Fair Value Gains & Losses through the Income Statement
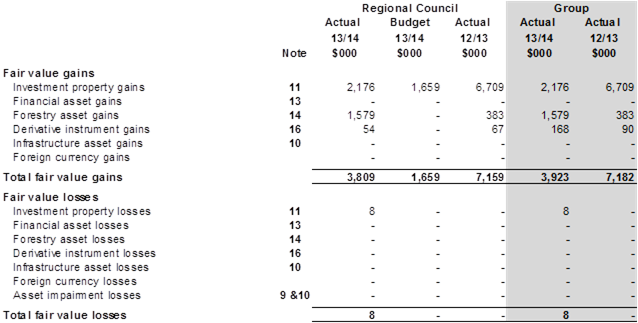
Note: Fair
value gains and losses on trading assets (listed above) are recorded in the
Income Statement. In addition, when asset revaluation decrements are
greater than the corresponding surplus in the Fair Value Reserve, the excess
decrements are also recorded in the Income Statement as an asset impairment.
Note
7: Expense Disclosures
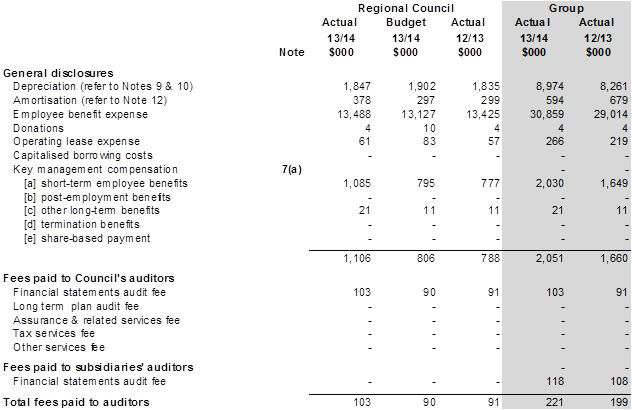
Note 7(a)
Key
management comprises Councillors and the Chief Executive for Council and
Directors and Chief Executive for each subsidiary. (2013-14 actual figures
for the Regional Council include both the Chief Executive seconded to
HBRIC Ltd and the interim Chief Executive)
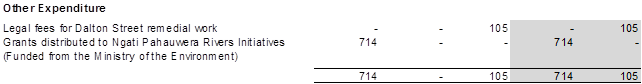
Note 8: Income Tax Expense
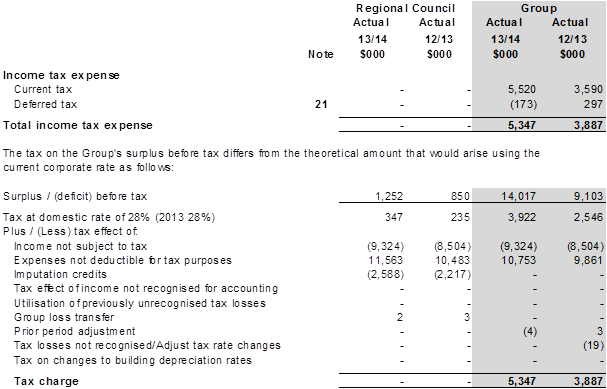
The
Council and Group have unrecognised income tax losses of $5,909 (2012-13
$10,971) with a tax effect of $1,654 (2012-13 $3,072) that are available to
carry forward, subject to compliance with the Income Tax Act.
|
HBRC
Audited 2013-14 Annual Report
|
Attachment 1
|
Note 9: Property, Plant & Equipment
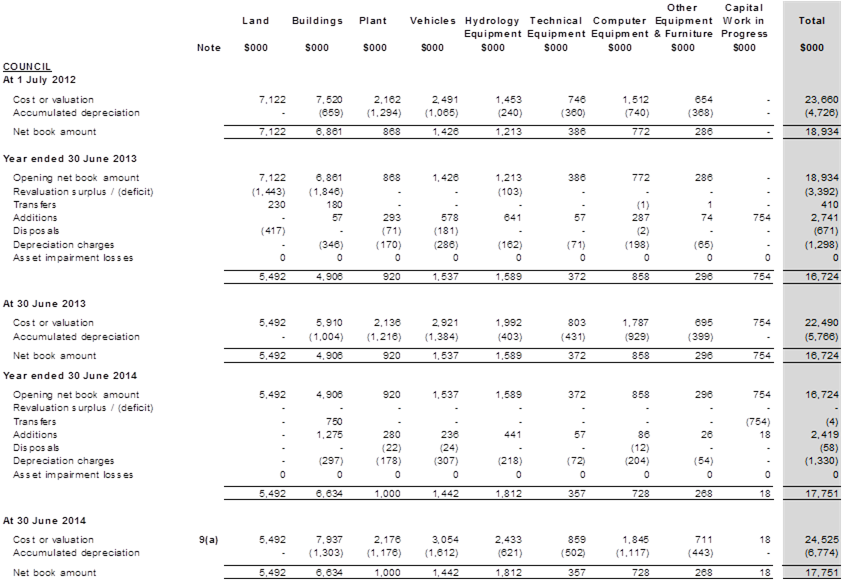
Note 9(a)
Council land and buildings were valued
at 30 June 2013 to fair value on the basis of market value by independent
valuer, Telfer Young (Hawke's Bay) Limited. The total fair value of property,
plant and equipment valued by Telfer Young (Hawke's Bay) Ltd was $8,255,000.
Land used for forestry in the Lake
Tutira Country Park and Tangoio Soil Conservation Reserve was valued at 30 June
2013 by Morice Limited, independent valuers. The total fair value of this
land was $808,000.
Land used for carbon sequestration and
wastewater disposal was valued at 30 June 2013 by Morice Limited, independent
valuers. The total fair value of this land was $1,647,000.
While ownership of the Tangoio Soil
Conservation Reserve is not vested in the Council, full managerial and
financial control was transferred to Council in 1989 under section 16 of the
Soil conservation and Rivers Control Act 1941.
Hydrological equipment was valued at
30 June 2013 on the basis of depreciated replacement value. This valuation was
carried out by Dr Jack McConchie, an experienced hydrologist with independent
consulting engineers Opus International Consultants Limited.
Insurance of
Assets

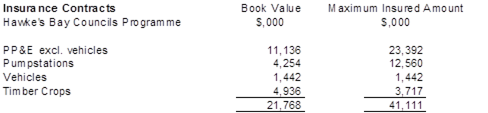

HBRC
is a member of the Local Authority Protection Programme (LAPP) which is a
collective insurance scheme where local authority members share the cost of
insuring infrastructure assets from natural disaster.
Infrastructure assets are insured at
modern equivalent value with LAPP. LAPP then meets 40% of repair costs
above an excess of $2,027,000 with the remaining 60% covered by Central
Government under the National CDEM Plan. The excess amount and any costs
under the excess amount are self-insured by Disaster Damage Reserves.
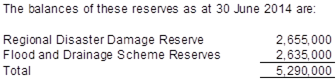
Note
9: Property, Plant & Equipment continued
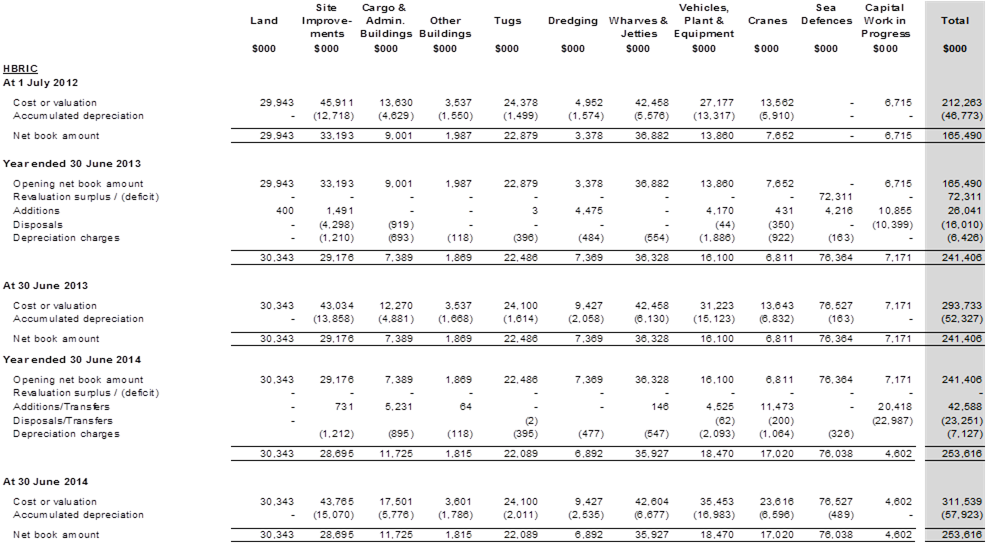
Note 9(b)
As at 30 September 2012
the Napier Port chose to revalue the sea defences of the Port. The sea
defences are classified as specialised assets and as such were valued on a
depreciated replacement cost basis. The value increased by $72,311,000
and this valuation was undertaken by independent valuer, Rob Kilgour of AECOM
as sub consultant to Darroch Ltd.

|
HBRC
Audited 2013-14 Annual Report
|
Attachment 1
|
Note 10: Infrastructure Assets (Parent & Group)
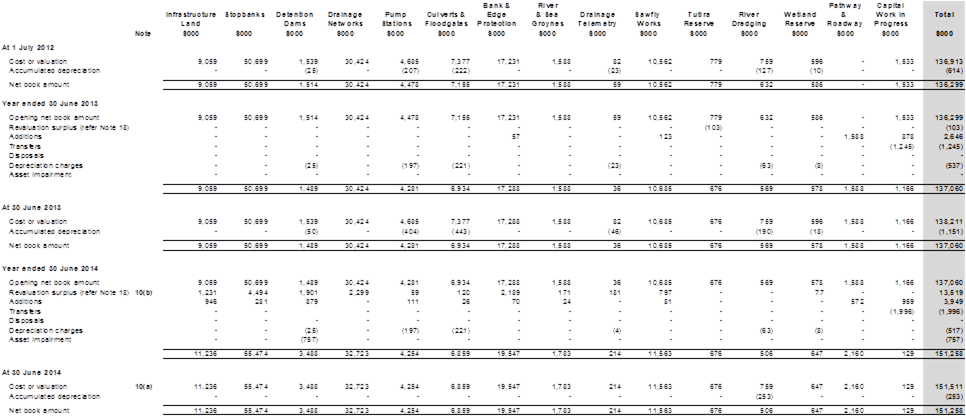
Note 10(a)
Infrastructure assets were valued by
suitably experienced Council employees at 30 June 2014 on the basis of
depreciated replacement cost. Significant assumptions used in the methodology
include:
- current
prices were used for all input costs such as labour rates, plant hire rates,
material costs, and contract works rates,
- where
current prices were not available, the Capital Good Price Index, published by
Statistics New Zealand was used,
- Heretaunga
Plains land protected from flooding was valued at $45,000 per hectare,
- Ruataniwha
Plains land protected from flooding was valued at $16,000 per hectare,
- floodable
land that is grazed was valued at $4,500 per hectare
- floodable
land that is not grazed was valued at nil.
The depreciated replacement cost
valuation methodology was reviewed by Gary Williams, an independent registered
engineer, while the land values were assessed by G S Morice, a
registered valuer with Morice Ltd.
Note 10(b)
The Tutira Reserve Assets were valued
at 30 June 2013 by M H Morice, a registered valuer of Morice Ltd, on the basis
of fair value. The total value of assets valued was $676,000.
|
HBRC
Audited 2013-14 Annual Report
|
Attachment 1
|
Note 11: Investment Property
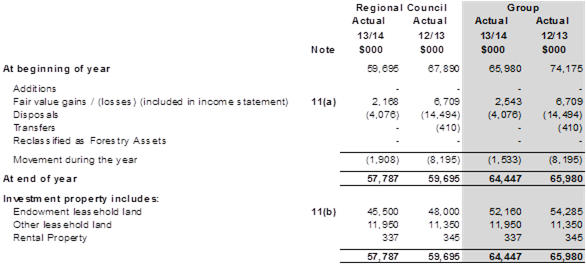
Note 11(a)
Wellington leasehold land was valued
as portfolio at 30 June 2014 to fair value on the basis of the discounted
rental cash flows from the perpetual leasehold properties by Martin J Veale,
registered valuer of Telfer Young (Wellington) Ltd. The discount rate
used was between 7.75% and 8.25%. The total fair value of the twelve properties
valued by Martin J Veale as an independent valuer was $11,950,000.
Napier leasehold endowment land was
valued as a portfolio at 30 June 2014 to fair value on the basis of the
discounted rental cash flows from the perpetual leasehold properties by Trevor
W Kitchin, registered valuer of Telfer Young (Hawke's Bay) Ltd. The
discount rate used was 7.75%. The total fair value of property, valued by
Trevor W Kitchin as an independent valuer, was $45,500,000.
Property at Tutira was valued at 30
June 2014 to fair value on the basis of market value by M H Morice, registered
valuer of Morice Ltd. The total fair value of property valued by M H
Morice as an independent valuer was $337,000.
At 30 September 2013 the Napier Port's
interest in investment properties was valued at $6,660,000, resulting in no
movement in the last 12 months. This valuation was undertaken by Frank
Spencer, a registered valuer with Logan Stone Ltd, using the fair value basis
under the highest and best use scenario. Mr Spencer is a member of the New
Zealand Institute of Valuers.
The following amounts have been
recognised in the comprehensive income statement.
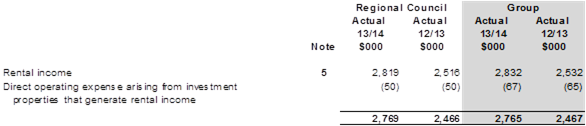
Note 11(b)
Under the Hawke's Bay
Endowment Land Empowering Act 2002, residential leasehold endowment land can
only be sold, using a specified valuation methodology, to the current lessee,
or to a person nominated by that lessee.
Note
12: Intangible Assets
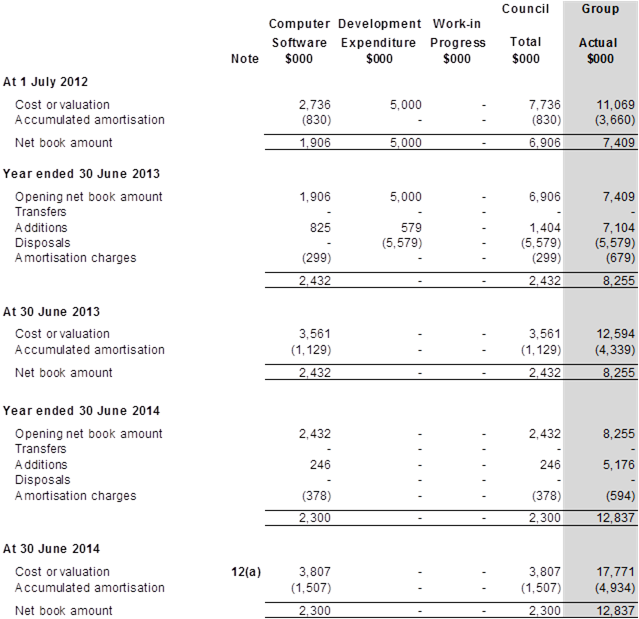
Note 12(a)
In accordance with Note
2.9 assets, such as Development Expenditure, that have an indefinite life are
tested for impairment at each balance sheet date. If the asset is
considered to be impaired, it must be written down to its recoverable value
immediately against income.
Note 13: Financial Assets & Investment in
Council-controlled organisations
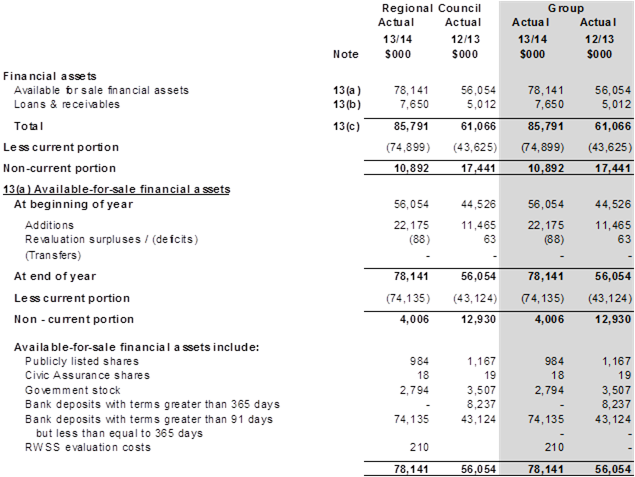 Note 13(a) Available-for-sale financial assets
The effective interest rate on
government stock was 4.52% (2012-13 5.63%). This stock has an average maturity
of 5.5 years (2012-13 3 years).
The effective interest rate on bank
deposits with terms greater than 91 days but less than 365 days was 4.43%
(2012-13 4.08%). These deposits have an average maturity of 96 days
(2012-13 64 days).
Note 13(b)
Loans & receivable financial assets
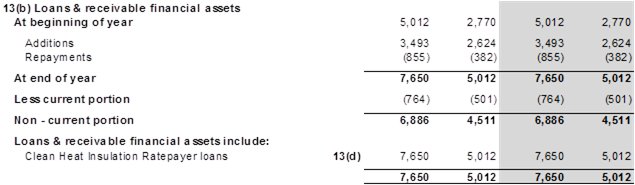 Note 13(c)
There were no impairment
provisions on investment financial assets in current or prior years.
Note 13(d)
The Council has provided
loans to ratepayers for the installation of clean heat and insulation.
The loans are repayable by a targeted rate over a 10 year period.
Interest is charged on Insulation loans at between 6% - 7.02% and on Clean heat
loans at between 3% - 3.51% at the inception of the loan.

Council's shareholding in the Port of
Napier Ltd was valued to fair value on 31 March 2012 by the Corporate Finance
Division of Deloitte. These revalued shares were transferred to Hawke's
Bay Regional Investment Company on 28 June 2012.
Note
14: Forestry Assets
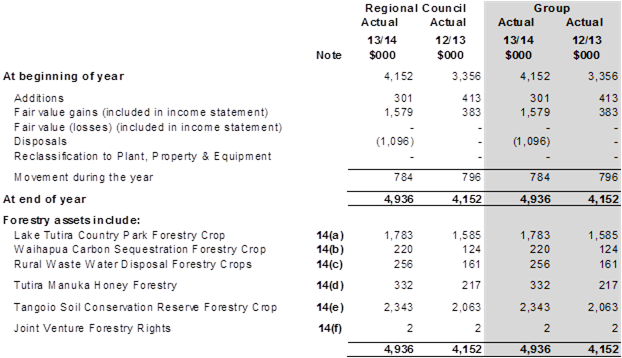
Council's forestry assets comprise a
total of 497 hectares of mixed forestry crops situated in the Lake Tutira
Country Park (114 ha), Mahia (36 ha), Waihapua (174 ha) and Central Hawke's Bay
(173 ha). During the period no forest crops were logged (2012-13 Nil ha).
Council owned forestry assets were
fair valued to $2,259,000 at 30 June 2014 (2012/13 $1,870,000) by M H Morice, a
registered valuer of Morice Ltd. The valuation assumed discount rates of
7.0%
Note 14(a)
Lake Tutira Country Park Forestry Corp
consists of radiata plantings on 114 hectares situated at Tutira Country
Park. These forestry assets were valued to $1,782,706 by Morice Limited,
independent valuers at 30 June 2014 (2012-13 $1,585,100). The valuation
assumed a discount rate of 7%.
Note 14(b)
Council's carbon sequestration
forestry assets consist of 174 hectares of mixed plantings situated at
Waihapua. These forestry assets were fair valued to $219,605 by Morice Limited,
independent valuers at 30 June 2014 (2012-13 $124,500). The valuation
assumed a discount rate of 7.0%.
Note 14(c)
Council's wastewater disposal forestry
assets consist of eucalyptus and radiata pine plantings on 69 hectares at
Pourere Road Waipawa, and 104 hectares at Mangatarata Road Waipukurau, and 36
hectares at Kinikini Road Mahia. These forestry assets were fair valued
to $256,437 by M H Morice of Morice Limited, independent valuers, at
30 June 2014 (2012-13 $160,700). The valuation assumed a discount
rate of 7.0%.
Note 14(e)
Council is developing 50 hectares of
manuka forestry at Tutira for honey production. The plantings of
seedlings and other development costs totalling $331,803 were not valued this
year.
Note 14(e)
Council does not own the land at the
Tangoio Soil Conservation Reserve, but in 1989 full managerial and financial
control of the Tangoio Soil Conservation Reserve was transferred from central
government to the Council under section 16 of the Soil Conservation and Rivers
Control Act 1941.
Note 14(f)
Council has entered into eleven joint
ventures under the Forestry Rights Agreement Act 1983 under which Council
provided grants to farmers to plant and maintain to maturity soil conservation
forestry crops on marginal land. In return, Council has a right to a
percentage of the profits on harvest. A nominal value of $10 per hectare
planted has been ascribed to these rights.
Note 14(g)
Council is exposed to financial risks
arising from changes in timber prices. As a long-term forestry investor,
Council does not expect timber prices to decline significantly during the
foreseeable future and therefore has not taken any measures to manage the risks
of a decline in timber prices. Council reviews its outlook for timber
prices regularly in considering the need for active financial risk management.
Note 14(h)
Council has 14,907 NZ emission units
for carbon credits. These where valued between $3.60 and $3.90 per unit
(2012-13 $1.90 and $2.05), giving a value of between $53,665 and $58,137
(2012-13 $28,323 and $30,559). These values have not been included in
these financial statements.
Note
15: Trade & Other Receivables
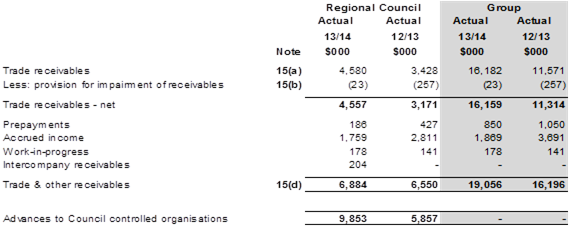
Note 15(a)
Trade receivables
are non-interest bearing and are generally on 30 day terms.
Note 15(b)
Movements in the
provision for impairment of receivables are as follows.
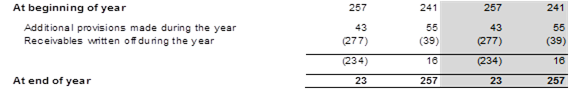
Note 15(c)
The carrying amount
of trade and other receivables approximates their fair value.
Note 15(d)
The status of trade
receivables at reporting dates is:
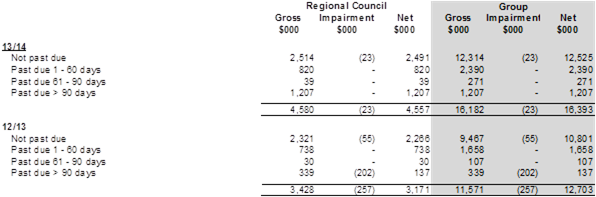
Note
16: Derivative Financial Instruments
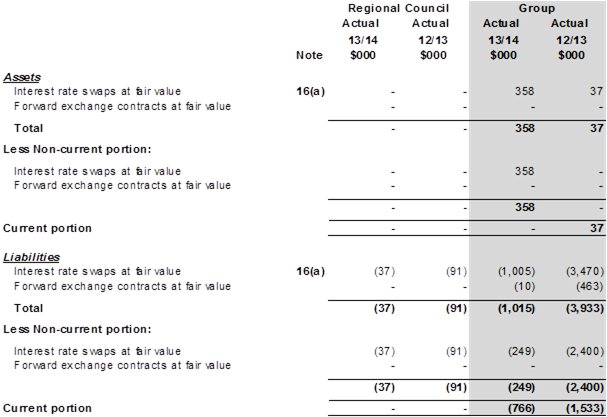
Note 16(a)
The notional principal amounts of the
outstanding interest rate swap contracts at 31 March 2014 were $74,500,000
(2012/13 $60,500,000). $57,000,000 of these swaps were active at 31 March
2014. The remaining $17,500,000 are forward starting, future dated swaps.
At 31 March 2014, the various interest
rates were in the range of 4.53% to 5.34% (2012/13 4.53% to 5.34%).
Note
17: Cash & Cash Equivalents
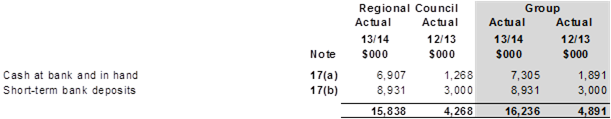
Note 17(a)
Cash at bank earns
interest at floating rates based on daily bank deposit rates.
Note 17(b)
Short term deposits are made for
varying periods up to 91 days depending on the immediate cash requirements of
the Group, and earn interest at the respective short term deposit rates.
The effective interest rate on
short-term bank deposits was 4.32% (2012-13 2.80%). These deposits have
an average maturity of 32 days (2012-13 2 days).
Note 17(c)
Cash, cash equivalents and
bank overdrafts included the following for the purposes of the Cash Flow
Statement


Note 17(d)
Reconciliation of Surplus after Tax to Net Cash Flows from Operations

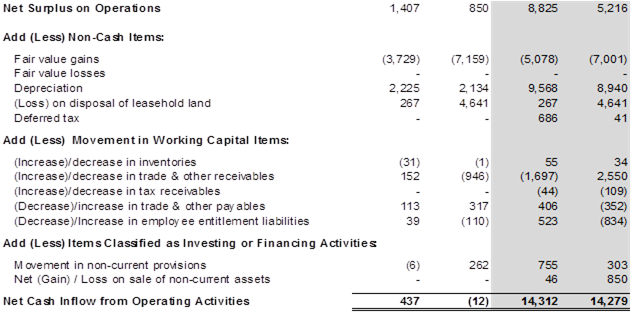
|
HBRC
Audited 2013-14 Annual Report
|
Attachment 1
|
Note 18: Fair Value Reserves
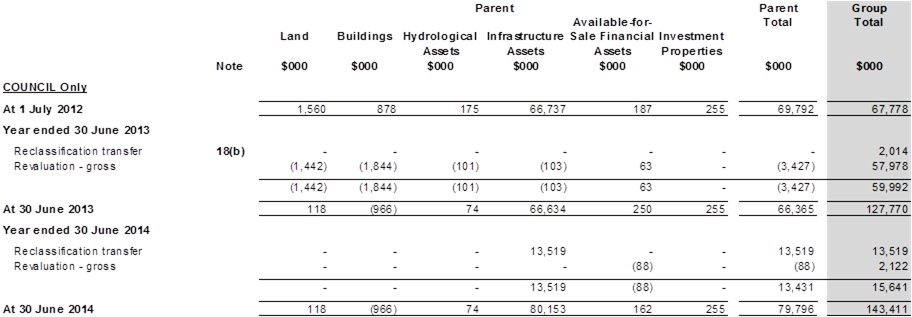
Note 18(a)
Revaluation
increments and decrements on operating and financial assets (listed above) are
recorded in the Statement of Changes in Equity. However, if revaluation
decrements are greater than the corresponding surpluses in the Fair Value
Reserve, the excess decrements are recorded in the Note 6, Fair Value Gains and
Losses through the Income Statement, as an asset impairment.
Note 18(b)
On
28 June 2012, Council transferred its shareholding in the Port of Napier
Limited to the Hawke's Bay Regional Investment Company in exchange for
177,400,000 shares. At the same time, Council transferred the remaining
fair value reserve component of its Port shareholding to its Accumulated
Balance.
Note
19: Other Reserves (Parent & Group)
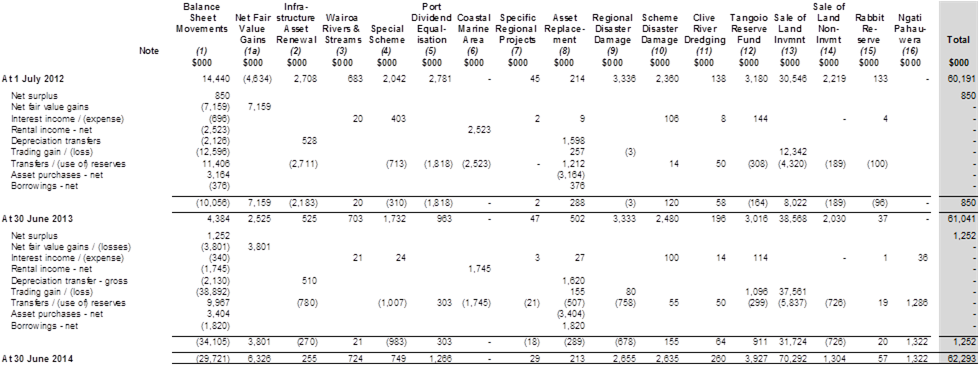
|
HBRC
Audited 2013-14 Annual Report
|
Attachment 1
|
Nature and purpose of reserves
[1] Balance Sheet
Movements
This balance reflects
adjustments to balance sheet accounts to give effect to movement in the reserve
accounts. This balance also includes operating reserve balances to fund
day to day cash flow and working capital requirements
[1a] Net fair value gains
Net fair value gains
records the fair value (non-cash) component of the operating reserve.
[2] Infrastructure asset
depreciation reserve
A reserve established to
fund the renewal of scheme infrastructure assets as required by the Local
Government Act 2002.
[3] Wairoa rivers &
streams reserve
A reserve established to
fund flood mitigation and recovery work within the Wairoa District.
[4] Special flood &
drainage scheme reserves
Reserves established for
each scheme to account for rating balances that arise each year as a
consequence of the actual income and expenditure incurred in any one year.
[5] Port dividend
equalisation reserve
A reserve established to
smooth out the dividend receipts from the Port so that fluctuations in
Council's general funding rates are minimised.
[6] Coastal marine area
reserve
A reserve established to
meet the statutory requirements on the use of rental income earned on Council's
endowment leasehold land.
[7] Specific regional
projects reserve
A reserve established to
meet the statutory requirements on the use of 50% of rental income on Council's
endowment leasehold land received prior to 1 July 2003.
[8] Asset replacement
reserve
A reserve established to
fund the replacement of operating property, plant and equipment, which are not
scheme based.
[9] Regional disaster
damage reserve
A reserve established to
meet the commercial insurance excess of $3.0 million on each event, the
uninsured 60% of edge protection damage and the costs of managing the response
and recovery for a disaster event.
[10] Scheme disaster
damage reserve
Reserves established to
meet each scheme's share of Local Authority Protection Programme (LAPP)
insurance excess and other costs to restore scheme assets that are not
recoverable from other sources.
[11] Clive river dredging
reserve
A reserve established to
meet the expenditure of dredging requirements on the Clive River.
[12] Tangoio soil
conservation reserve
A reserve established to
separate the revenues and expenses associated with the Tangoio Soil
Conservation Reserve as this reserve is managed and overseen by Council on
behalf of the Crown.
[13] Sale of land
investment reserve
A reserve established to
hold the proceeds of endowment leasehold land sales to be reinvested in
accordance with Council's policy on "Evaluation of Investment
Opportunities" approved on 30 April 2008.
[14] Sale of land
non-investment reserve
A reserve established to
hold transfers from the Sale of Land Investment Reserve to be invested in
accordance with Council's policy on "Open Space Investment" approved
on 25 June 2008 and Council's Investment Policy set out in the 2009-19 Long
Term Plan.
[15] Rabbit reserve
A reserve established to
fund costs expected to be incurred with growing rabbit populations. The reserve
is limited to a maximum balance of $133,000.
[16] Ngati Pahauwera
reserve
A reserve established to
ring-fence funding for Ngati Pahauwera Rivers Initiatives. For the
clean-up of the Mohaka, Waikari and Waihua Rivers and their catchments.
|
HBRC
Audited 2013-14 Annual Report
|
Attachment 1
|
Note 20: Borrowings
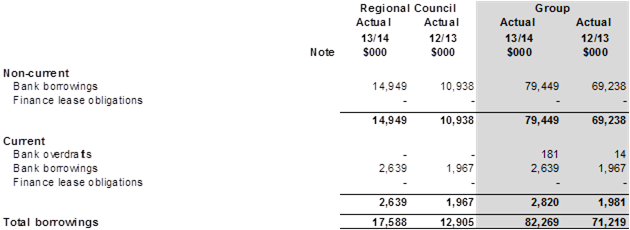
20(a)
Security
Council bank loans are
secured over the rating base of the Council.
The Napier Port have two
multi option credit facilities with Westpac, one for $50 million expiring
December 2015 and the other for $60 million expiring December 2016. The
facility gives Napier Port the option to raise money on the money market,
through wholesale advances or a fixed rate advance for all or any part of the
commitment expiring on a date no later than the termination date.
Security is by way of a negative pledge over the assets of Napier port in
respect of both sale of such assets and other security interests.
20(b)
Maturity analysis of borrowings
The
exposure of the Group's borrowings to interest-rate changes and the contractual
repricing dates or maturity dates at the balance sheet date are as follows.
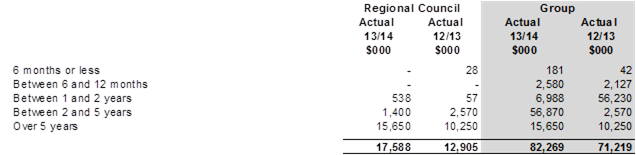
20(c)
Effective interest rates
The
effective interest rates at the balance sheet are as follows.

20(d) Fair values
The
carrying amount for the fair value of non-current borrowings is as follows.

The fair values as based
on cash flows discounted using a rate based on the borrowing rate of 6.45%. The
carrying amount of borrowings repayable within one year approximate their fair
value.
20(e)
Undrawn facilities
The
Group has the following undrawn borrowing facilities.
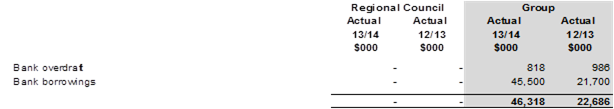
20(f)
Internal Borrowings
The
following internal borrowings have been funded by Council reserves.
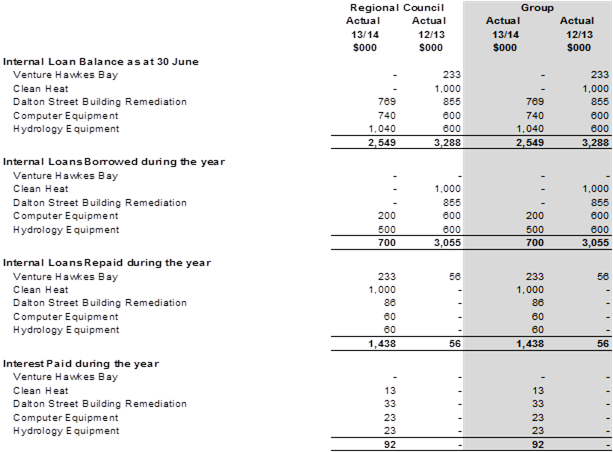
Loans for Clean Heat, Dalton Street
Building Remediation, Computer and Hydrology Equipment were borrowed at
30 June 2013 so no repayments or interest were paid for the 2012-13
financial year.
The
loan to the Heat Smart project was a temporary loan facility until external borrowing
is completed in the 2013-14 financial year.
Note
21: Deferred Income Tax (Group)
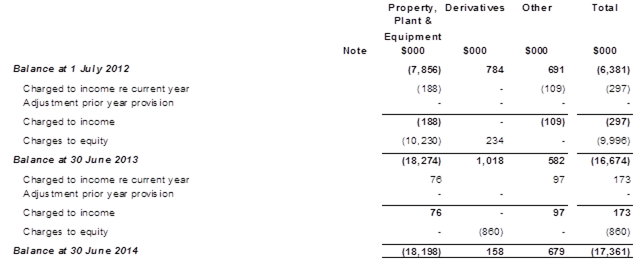
Note
22: Employee Benefit Liabilities
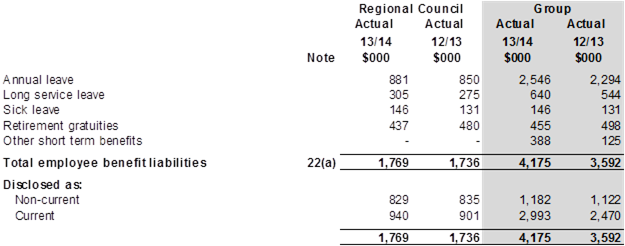
Note 22(a)
Movement in employee benefit liability
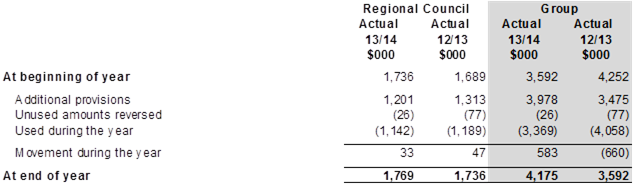
Note
23: Trade & Other Payables
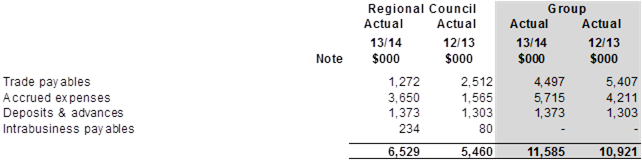
Trade
payables are non-interest bearing and are generally on 30 day terms.
The
carrying amount of trade and other payables approximates their fair value.
Note
24: Provisions for Other Liabilities and Charges
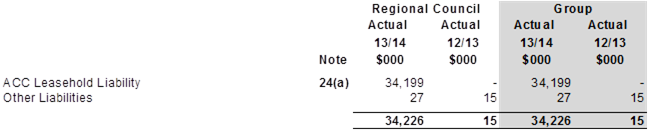
Note 24(a)
In
December 2013 Council entered into a contract with the Accident Compensation
Corporation (ACC) to sell the cash
flows generated from the portfolio of Napier leasehold properties for a period
of 50 years ending 30 June 2063 (after
a free-holding initiative to lessees). A lump sum of $37.7 million was
received for this to fund
investment
activity. The liability to ACC reduces by any sales of leasehold property
during the year as these are
paid
to ACC during as compensation for lost rental income over the 50 term.
Note
25: Related-Party Disclosures (Group)
Note 25(a)
The following transactions were carried out with subsidiaries
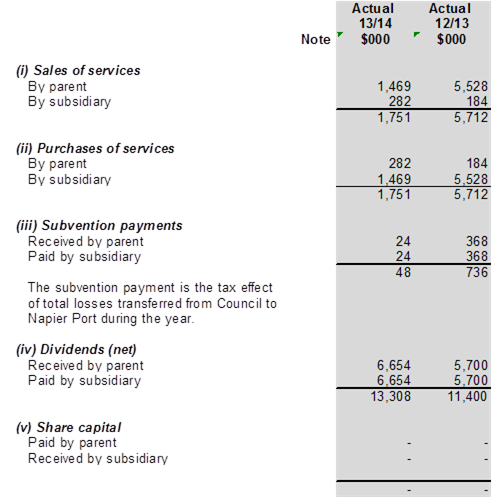
Note 25(b)
Transactions with key management personnel
During the year Councillors and key
management personnel, as a part of normal customer relationship, were involved
in minor transactions with Group (such as payment of rates, purchases of small
amounts of goods and services).
Note 25(c)
Year-end balances arising from sales/purchases of goods and services

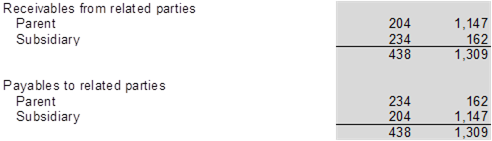
Note 25(d)
Terms and conditions of transactions with related parties
Sales to and purchases from related
parties are made in arm's length transactions at both normal market prices and
normal commercial terms.
Outstanding balances at year end are
unsecured and settlement occurs in cash.
There have been no guarantees provided
or received for any related party receivables.
At year end, there is no impairment
relating to amounts owed by related parties (2012-13 $nil).
Note
26: Commitments & Contingencies
Note 26 (a)
Capital commitments
Capital expenditure
contracted for at balance sheet date but not yet incurred as follows.
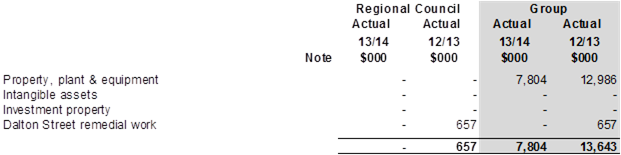
On 29 October 2012 the Napier Port
entered into a contract with Gottwald Port Technology GmbH for the purchase and
supply of two mobile harbour cranes at a cost of $10,016,452. These cranes were
delivered to the Napier Port in September 2013 and went into service in
December 2013. The Napier Port had put in place foreign exchange contracts to
mitigate exchange rate risk.
Note 26 (b)
Operating lease commitments
The Group has entered into commercial
leases for certain offices, plant and equipment under non-cancellable operating
lease agreements. The leases have varying terms and conditions.
Future aggregate minimum lease
payments under non-cancellable operating leases are as follows.

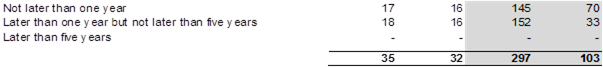
Note 26 (c)
Contingencies
In respect of the Council only:
The Dalton Street building owned by
the Council has had extensive remedial work completed as a result of water
ingress. This was started during the 2012-13 financial year and was
completed in the 2013-14 year. The total cost of the project was
$2,024,483. Legal action is continuing but it is yet to be determined what
compensation will be recovered.
The Tangoio Soil Conservation Reserve
fund contains the proceeds from the Reserve since management and control of the
Reserve was vested in Council in 1985, less the cost of managing the
Reserve. This fund is held by Council on behalf of the Crown. The
value of the funds at 30 June 2014 are $3,927,462 (2012-13 $3,017,079).
At balance date Council has a
provision of $272,808 in respect of the New Zealand Mutual Liability Riskpool
calls to cover the costs of leaky building existing claims for the five years
to 30 June 2014. Riskpool did not cover new claims on leaky buildings
from 1 July 2009. This provision was based on the best information from
the Board of Riskpool, but may not be sufficient to cover all claims eventually
settled. In the five year period to 30 June 2014 Council has paid out
calls totalling $412,889.
In respect of HBRIC Ltd only:
This
year and last year HBRIC Ltd recorded no contingent liabilities or assets.
Note 26 (d)
Contractual Obligations Under LAPP Arrangements
As a part of Council's insurance
programme covering damage to Council's infrastructure assets in the event of a
natural disaster, Council has insurance cover above a deductible of $1,259,000
for 40% of the cost of repair with the Local Authority Protection Programme
(LAPP).
LAPP is a mutual scheme involving
approximately 57 local authority members. This scheme has an obligation
on all members for a payment of up to five times Council's annual premium,
payable in any one event impacting on any of the LAPP members. In any one year
Council's exposure is to cover a maximum of two events.
Council's annual premium covering the
financial year 2013-14 equals $234,400 excluding GST, which means that
Council's maximum obligation would amount to $2,344,000 in the event of two
very large natural disasters in any one year.
|
HBRC
Audited 2013-14 Annual Report
|
Attachment 1
|
Note 27 Local Government Act 2002 Disclosures
Note 27(a)
Remuneration of Chairman and Elected Members of Council
Remuneration of Elected Members of the
Council includes salary, vehicle allowance, meeting and hearing fees that,
during the year, were paid or payable to the Councillor by the Council or any
council organisation. Remuneration levels are set each year for all local
authorities by the Remuneration Authority.
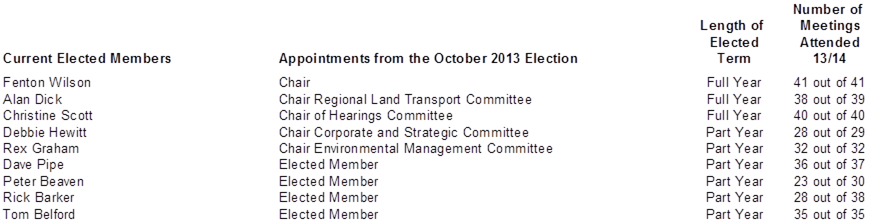
Note that the number of meetings
attended above report elected members' attendance at advertised meetings of the
Regional Council, Council Committees, Council led stakeholder groups, bodies to
which Councillor appointments have been made, Council workshops and Hearing
panels (excludes paid consent hearings).
|
HBRC
Audited 2013-14 Annual Report
|
Attachment 1
|
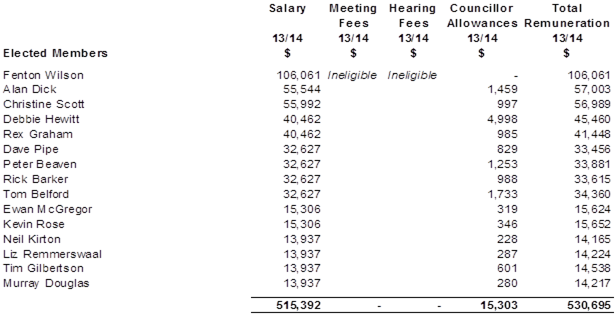
The Chairman is provided with a
vehicle to use on Council business. Use of a vehicle reduces the
Chairman's salary in accordance with Remuneration Authority policy.
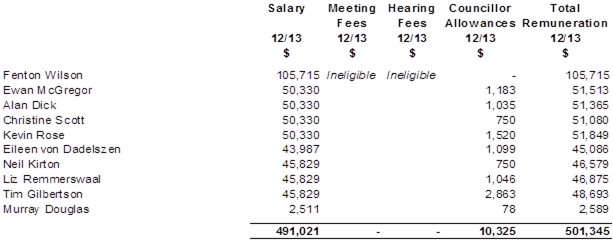
Note 27(b)
Remuneration of Chief Executive
The Chief Executive of the Hawke's Bay
Regional Council received a salary of $330,091 for the year ended 30 June 2014
(2013; $264,423).
The Chief Executive was seconded to
HBRIC Limited for the full year and the salary figure includes a higher duties
allowance of $62,347 which was funded by HBRIC Limited.
An interim Chief Executive was
appointed to cover the Chief Executive role for the secondment period and
received a salary of $202,424.
For the year ended 30 June 2014, the
value of the total remuneration package received by the Chief Executive
(including the value of non-financial benefits) was $361,425 (2013; $293,172),
while the total remuneration package received by the interim Chief Executive
was $224,511.
Note 27(c)
Severance Payments
During the year one
severance payment was made to council employees (2012-13; four payments
totalling $101,246)

Note 27(d) Council Employees
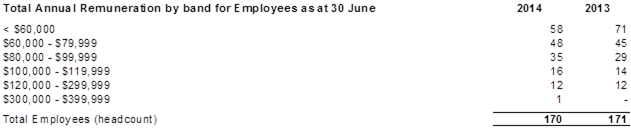
Total
remuneration includes non-financial benefits provided to employees.
At
balance date, the Council employed 154 (2013; 154) full-time employees, with
the balance of staff representing 9.7 (2013; 10.5) full-time equivalent
employees. A full-time employee is determined on the basis of a 40-hour
working week.
|
HBRC
Audited 2013-14 Annual Report
|
Attachment 1
|
Note 28: Major Budget Variances (Parent)
The Council published prospective
financial information in relation to the 2013/14 year in its 2013/14 Annual
Plan. Explanations for the major variances from the forecast figures
published in the Annual Plan are set out below:
28 (i)
Comprehensive Income Statement
Operating revenue is $3.5 million or
9% more than budget. This variance is explained below:
Revenue from Council activities is
$343,000 or 6% less than budgeted due to:
· Regulation
income is down $0.6 million. Consent processing income was down on budget
as a result of low numbers of consent applications and some staff vacancies not
being filled.
· Regional
Resources income is down $0.5 million. This was mainly due to a reduction
of gravel extraction income due to low demand and lower Section 36 charges.
· Land
and Drainage income was up $0.5 million due to an increase in external income
earned by the HBRC Works Group.
Other revenue is $1.6 million or 9%
more than budget due to:
· Rental
income is $1 million or 62% more than budgeted due to deferral of the sale of
Wellington Leasehold property.
· Interest
income is $1.2 million or 24% less than budget as the sale of the Wellington
Leasehold property did not take place and interest rates were not as high as
had been forecast in the budget.
· Grant
income is $2 million or 64% more than budget due to Council receiving funding
from the Ministry for the Environment to distribute to Ngati Pahauwera for the
cleanup of the Mohaka, Waikari and Waihua Rivers and their catchments.
· There
was also a loss on disposal on the sale of endowment leasehold property of
$4,000 which continue to sell even though Council are no longer offering
discounts as an incentive for leaseholders to freehold their properties.
The Council
has
taken a loss on investment in VHB writing off the debt and investment costs of
$292,000.
The
Council has taken a loss on Infrastructure Assets of $335,000 for the write off
feasibility work that has not been capitalised.
· Other
income is $213,000 over budget due to uncollectable rates provisions which are
no longer required and have been released
Fair
value gains are $2.2 million or 130% above budget mainly due to an increase in
the value of leasehold land and forestry crops.
Expenses from Council activities is
$1.4 million or 4% less than budgeted due to:
· Governance
and Community Engagement expenditure is down $1.0 million due to the targeted
assistance for the Te Mata Park Visitor Centre and the upgrade of the Wairoa Community
Centre not being drawn down in the 2013/14 year and has been carried forward to
the 2014/15 year.
· Regulation
and Emergency Management costs are down $0.5 million due to staff vacancies and
delays in recruitment.
Finance costs are $469,000 above
budget due to the treatment of the leasehold annuity fees which are paid to ACC
in return for their lump sum contribution. These fees make up $1,728,000
of the total finance costs.
Other
comprehensive income is $3.2 million less than budget due to the revaluation of
Infrastructure Assets.
28 (ii)
Operating Surplus / (Deficit) & Statement of Changes in Equity
The operating surplus / (deficit)
(total recognised revenue and expenses) is $480,000 more than budget. The
major causes for this are set-out above.
28 (iii)
Balance Sheet
Equity is $7.0 million or 1.5% less
than budget.
Property, plant & equipment assets
are $5.9 million less than budget due to the fair value write downs at the end
of the 2012/14 year and the deferral of the $630,000 to be spent on the Guppy
Road and Wairoa properties.
Infrastructure assets are $10.5
million (6.5%) less than budget due mainly to the revaluation variances on
river control assets.
Investment property is $1.1 million
(1.1%) less than budget due to actual sales of endowment leasehold property
exceeding those forecast.
Intangible assets are $675,000 less
than budget as a result the timing of internal system integration projects and
amortisation.
Cash, cash equivalents and financial
assets are $1.3 million more than budget as the $37 million received from the
sale of leasehold property cash flows has been retained for longer than had
been budgeted for due to the slowdown in the RWSS decision making
process. Also the mix of Current and Non-Current financial assets has
changed due to the requirements of when these funds might be required.
Advances to Council-controlled
organisations are $12 million less than budget due to the deferral of the
Whakatu Road/Rail Hub project.
Current and Non-current borrowings
taken together are $6.1 million less than budget because loan funding for Solar
Hot Water, Open Spaces and Regional Infrastructure were not drawn down this
financial year.
Provisions for other liabilities and
charges are $17 million less due to the sale value of leasehold property cash
flows reducing from $51 million to $38 million due to the influx of sell downs
before the sale was completed.
28 (iv) Cash
flow statement
Net cash out flows from operating
activities are $2.4 million more than budget mainly due to a decrease in
expenditure and an increase in overall income.
Net cash outflows from investing
activities are $4.5 million less than budget. The main reasons for this
are the $4 million increase in financial assets being the increase in bank
deposits from the sale of leasehold land, $2.0 million decrease in the
construction of infrastructure assets and the $13.0 million decrease in
advances to HBRIC Ltd offset by $24.4 million increase in the purchase of
financial assets which is the investment of the money received from the sale of
leasehold property cash flows.
Net cash inflows from financing
activities was $32 million more than budget due to $37 million received sale of
leasehold property cash flows which the budget assumed was received in the
2012/13 year.
28 (v) Significant
asset acquisitions or replacements
There were no other significant asset
acquisitions or replacements.
Note
29: Financial Risk Management
Introduction
The Group's principal financial
instruments comprise bank loans, government stock, shares in listed companies
and the Hawke's Bay Regional Investment Company, cash and bank term
investments. The main purposes of these financial instruments are to
raise finance for the Group's operations and to generate income.
The Group also enters into derivatives,
consisting principally of interest rate swaps and forward currency
contracts. The purpose is to manage interest rate and currency risks
arising from the Group's operations and its sources of finance.
The Group has various other financial
instruments such as trade debtors and trade creditors, which arise directly
from its operations.
Other than government stock and shares
in listed companies, the Group does not trade in financial instruments.
Market Risk
Price Risk
Price risk is the risk that the value
of a financial instrument will fluctuate as a result of changes in market
prices. The Group is exposed to equity and securities price risk on its
investments, which are classified as available for sale and held to maturity
financial assets. The Group manages price risk by diversification of its
investment portfolio in accordance with limits set out in its investment
policy.
The Group holds shares in companies
listed on various world stock exchanges. If these exchanges at 30 June
2014 had fluctuated by plus or minus 0.5% and the value of the shareholdings
had moved proportionately the effect would have been to increase or decrease
the fair value through equity reserve by $4,922 (2012-13 $5,835).
Currency Risk
Currency risk is the risk that the
value of a financial instrument will fluctuate due to changes in foreign
exchange rates.
From time to time the Group enters
into transactions denominated in foreign currencies and uses forward and spot
foreign exchange contracts to manage its exposures to currency fluctuations.
If the currencies in which the Group
has contract exposures at 30 June 2014 had fluctuated by plus or minus 0.5%,
the effect would have been to increase or decrease profit or loss by $1,645
(2012-13 $43,135).
Interest Rate Risk
The interest rates on the Group's
investments are show at Note 13 and on borrowings at Note 20.
Fair Value Interest Rate Risk
Fair value interest rate risk is the
risk that the value of a financial instrument will fluctuate due to change in
market interest rates. Borrowing and investing at fixed rates exposes the
Group to fair value interest rate risk. The Group does not usually hedge
against this risk.
If interest rates on borrowings at 30
June 2014 had fluctuated by plus or minus 0.5%, the effect would have been to increase
or decrease the fair value through equity reserves by $397,000 (2012-13
$346,000).
If interest rates on government and
local body stock at 30 June 2014 had fluctuated by plus or minus 0.5%, the
effect would have been to increase or decrease the fair value through equity
reserves by $13,970 (2012-13 $17,600).
Cash Flow Interest Rate
Risk
Cash flow interest rate risk is the
risk that the cash flows from a financial instrument will fluctuate because of
changes to market interest rates. Borrowing at variable interest rates
exposes the Group to cash flow interest rate risk.
The Group manages its cash flow
interest rate risk on borrowings by using interest rate caps and floating to
fixed interest rate swaps.
If interest rates on borrowings at 30
June 2014 had fluctuated by plus or minus 0.5%, the effect would have been to
increase or decrease the surplus after tax by $397,000 (2012-13 $346,200)
as a result of higher or lower interest expense on variable rate borrowings.
Credit Risk
Credit risk is the risk that a third
party will default on its obligation to the Group, causing it to incur a
loss. The Group has no significant concentrations of credit risk, as it
has a large number of credit customers, mainly ratepayers. Under the
Local Government (Rating) Act 2002, the Council has powers to recover
outstanding debts from ratepayers. The Group has a policy of assessing
the credit risk of significant new customers and monitors the credit quality of
existing customers.
The Group invests funds only with registered
banks, government stock and its investment policy limits the amount of credit
exposure to any one institution or organisation.
Investments in other local authorities
are secured by charges over rates. The Group only invests in other entities
with a minimum credit rating from Standard & Poors (or other credit agency
of similar reputation) of A1 for short term debt (up to twelve months) or A+
for term debt (more than twelve months).
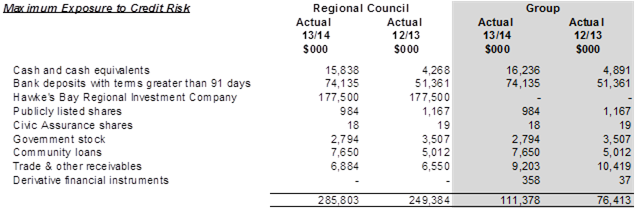
|
HBRC
Audited 2013-14 Annual Report
|
Attachment 1
|
Note 29 (a): Financial Risk Management
Liquidity Risk
Liquidity risk is the risk that the
Group will encounter difficulty raising liquid funds to meet commitments as
they fall due.
The Council maintains a level of cash
operating balances sufficient to meet its commitments as they fall due as well
as managing its borrowings in accordance with its funding and financial
policies. Napier Port operates a multi-option credit facility with its
bank as set out in Note 20.
Set out below is a contractual
maturity analysis of financial liabilities as at balance sheet date. The contractual
amount includes scheduled interest payments.
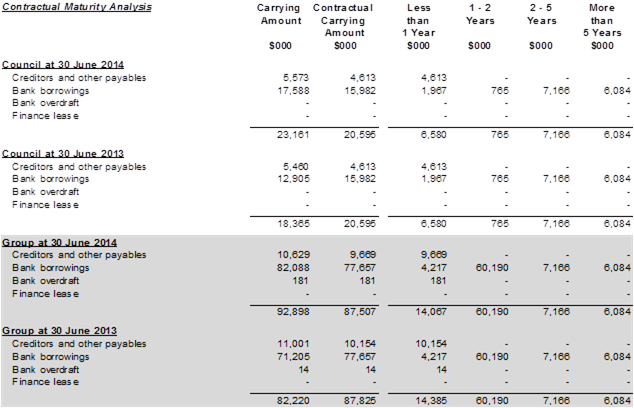
Foreign Exchange Risk
The Group enters into transactions
denominated in foreign currencies from time to time and is thereby exposed to
the risk that movements in foreign currency rates may cause a financial loss to
the Group.
The Group uses forward and spot
foreign exchange contracts to manage its exposure. The contract amounts
of foreign exchange instruments outstanding at balance date are:
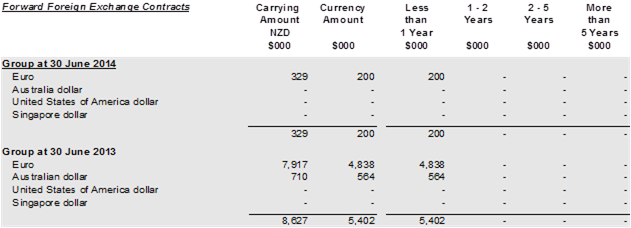
Note 29 (b):
Capital Management
Council's capital is its equity (or
ratepayers' funds), which comprise accumulated funds and reserves. Equity
is represented by net assets.
The Local Government Act 2002 (the
Act) requires Council to manage its revenues, expenses, assets, liabilities,
investments, and general financial dealings prudently and in a manner that
promotes the current and future interests of the community. Ratepayers'
funds are largely managed as a by-product of managing revenues, expenses,
assets, liabilities, investments and general financial dealings.
The objective of managing these items
is to achieve intergenerational equity, which is a principle promoted in the
Act and applied by the Council. Intergenerational equity requires
ratepayers to meet the costs of utilising the Council's assets and not
expecting them to meet the full cost of long-term assets that will benefit
ratepayers in future generations. Additionally, the Council has in place asset
management plans for major classes of assets detailing renewal and maintenance
programmes to ensure that ratepayers in future generations are not required to
meet the costs of deferred renewals and maintenance.
The Act requires the Council to make
adequate and effective provision in its Long Term Plan (LTP) and in its Annual
Plan (where applicable) to met the expenditure needs identified in those plans,
and the Act sets out the factors that the Council is required to consider when
determining the most appropriate sources of funding for each of its activities.
The sources and levels of funding are
set out in the funding and financial policies in the Council's most recent LTP
(2012-2022 Ten Year Plan).
HBRC has the following Council-created
reserves:
- reserves
for different areas of benefit, and
- self-insurance
reserves.
Reserves for different areas of benefit
are used where there is a discrete set of rate of levy payers as distinct from
payers of general rates. Any surplus or deficit relating to these
separate areas of benefit is applied to the specific reserves.
Self-insurance reserves are built up
annually from general rates and are made available for specific unforeseen
events.
The release of these funds can
generally be approved only by Council.
Note 30
Non-current assets held for sale
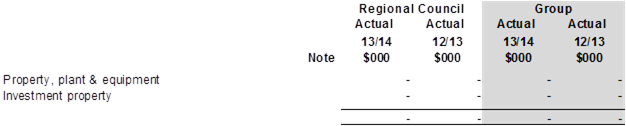
Note 31
Events After Balance Sheet Date (Parent & Group)
There
were no significant events after balance date.
|
HBRC
Audited 2013-14 Annual Report
|
Attachment 1
|
Financial Impact Statements
|
HBRC
Audited 2013-14 Annual Report
|
Attachment 1
|
General
Information
Information is available
from Council on a range of matters relating to projects it has undertaken,
meetings held and research it has been involved in, including:
- Council
meeting agendas and minutes
- Technical
reports
- Educational
material
- Correspondence
- Pamphlets
and newsletters
- Council’s
website – www.hbrc.govt.nz
.
If it is necessary to
obtain information under the Local Government Official Information and Meetings
Act please contact the Governance and Administration Manager or Communications
Co-ordinator, but note that information is usually readily available without the
need for a formal request.
Legislative
Framework
It is important to note that there are
numerous statutes, which specifically identify regional councils as having a
specific function and role in various activities. These include:
- Biosecurity
Act 1993
- Building
Act 2004
- Civil
Defence Emergency Management Act 2002
- Hawke’s
Bay Endowment Land Empowering Act 2002
- Land
Drainage Act 1908
- Land
Transport Management Act 2003 and Land Transport Management Amendment Act 2008
- Local
Electoral Act 2001
- Local
Electoral Act 2001 Amendment Act 2013
- Local
Government Act 2002
- Local
Government (Rating) Act 2002
- Local
Government Act 2002 Amendment Act 2012
- Local
Government Act 2002 Amendment Act 2014
- Maritime
Transport Act 1994
- Public
Transport Management Act 2008
- Resource
Management Act 1991
- Soil
Conservation and Rivers Control Act 1941
- Hawke’s
Bay Endowment Land Empowering Act 2002
Plans we use
The Local Government Act
2002 (the Act) came fully into effect on 1 July 2003. This Act requires Council
to produce the following plans and reports:
- A
Long Term Plan 2012-22, prepared under Section 93 of the Act (Adopted June
2009)
- The
Annual Report for the financial year ending 30 June 2013 is prepared under
Section 98 of the Act.
The reporting will also
include ‘a summary of information’ contained in the Annual Report
for both the Annual Report and the Long Term Plan.
The Resource Management
Act 1991 gives the Hawke’s Bay Regional Council the responsibility for
promoting the sustainable management of the natural and physical resources of
the region. The Council has produced a Regional Policy Statement, in line with
the requirements of the Act, which establishes a planning framework to balance
the demands placed on the natural resources by users.
In addition to the
Regional Policy Statement, the Resource Management Act enables Council to
develop plans containing rules and regulations by which the management of the
natural resources will be carried out.
The following resource
management plans, prepared by the Council have legal status:
- Regional
Resource Management Plan (incorporating the Regional Policy Statement)
(operative 28 August 2006) plus associated Plan Changes 1-6.
- Regional
Coastal Plan (operative June 1999)
- Proposed
Regional Coastal Environment Plan (adopted by Council on 31 October 2012
incorporating Variations 1-3). This Plan was recently approved by the
Minister of Conservation and so it will be made operative in September
2014. At that time, it will fully replace the 1999 Regional Coastal Plan.
The Resource Management
Act also requires the Council to monitor the state of the environment, so State
of the Environment (SoE) reports are produced. The latest five-yearly SoE
report was completed in 2009-10. The next SoE report will be produced in
2014-15.
The Biosecurity Act 1993
allows the Council to undertake biosecurity functions provided they have
developed a Pest Management Strategy. The Regional Pest Management Strategy has
been developed in accordance with the Biosecurity Act 1993 and sets out
Council’s goals and objectives with regard to its biosecurity functions.
The current Regional Pest Management Strategy was adopted by the Council in
March 2013 and must be reviewed again by March 2018.
A revised Regional Land
Transport Strategy (RLTS) was adopted by the Council in June 2012. The RLTS
will be replaced by the Regional Land Transport Plan as required under the
amended Land Transport Management Act 2003.
A revised Regional Public
Transport Plan was adopted by the Council in June 2011. This will be revised by
June 2015 as required under the amended Land Transport Management Act 2003.
|
HBRC
Audited 2013-14 Annual Report
|
Attachment 1
|
About
Hawke’s Bay Regional Council
Council
Committee Structure
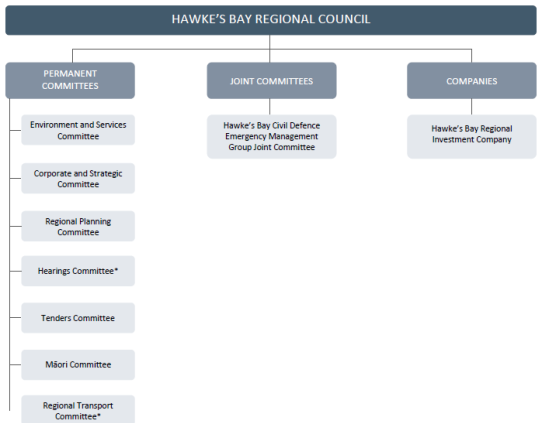
Management
Structure
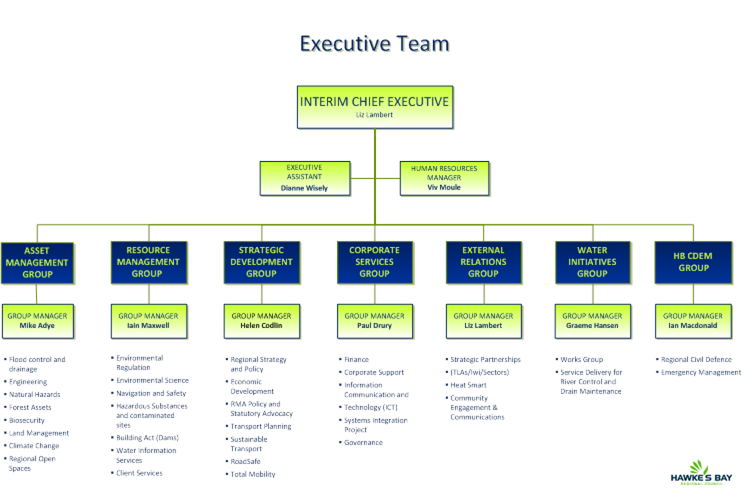
|
HBRC
Audited 2013-14 Annual Report
|
Attachment 1
|
Key
Implementation milestones and activities for the 2011 National Policy Statement
for Freshwater Management
|
|
Status key (for 2013-2014 period)
|
NPSFM Objectives
|
|
|

|
Completed within Programme’s
indicative timeframe
|
A1 – safeguarding life-supporting
capacity etc. (water quality)
|
B3 – efficient allocation and use
(water quantity)
|
|
 
|
In progress during Programme’s
indicative timeframe
|
A2 – overall water quality in
region
|
B4 – significant values of wetlands
(water quantity)
|
|
|
Not started during Programme’s
indicative timeframe
|
B1 – safeguarding life-supporting capacity
etc. (water quantity)
|
C1 – integrated management of land
and fresh water
|
|

|
Implementation activity/phase ongoing
|
B2 – over-allocation (water
quantity)
|
D1 – tangata whenua roles and
interests
|
|
|
Implementation not programmed in current
reporting period
|
|
|
|
|
|
|
|
|
Activity
|
2012-
2013 Status
|
2013-
2014 Status
|
Comment
on 2013 – 2014 progress
|
Principal
2011 NPSFM Objective(s) relevant to Activity (indicative only)
|
|
Obj A1
|
Obj A2
|
Obj B1
|
Obj B2
|
Obj B3
|
Obj B4
|
Obj C1
|
Obj D1
|
|
Change
4 (Built Environment) to Hawke's Bay Regional Resource Management Plan
– appeals on decisions phase
|

|

|
Council released
its decisions on 26 March 2013. Transpower NZ Ltd had lodged an appeal with
the Environment Court against some of the Council’s decisions on Change
4. That appeal was resolved by negotiation and Change 4 became
operative on 1 January 2014.
|
|
|
|
|
|
|
l
|
|
|
Change 5 (Land use and Freshwater) to
Hawke's Bay Regional Resource Management Plan -
appeals on decisions phase
|
|

|
Council released its decisions on
submissions on 5 June 2013. Four appeals were lodged with the
Environment Court against some of the Council’s decisions on Change
5. Three Environment Court-assisted mediation sessions were held during
the 2013-14 period. By end of the reporting period, parties had reached
in-principle agreement to settle the majority of appeal points. One
matter is likely to require an Environment Court hearing fixture in 2014-15
period. Another matter requires external expertise to assess the extent
of six ephemeral wetlands in the region before parties can agree that matter
is settled.
|
l
|
l
|
l
|
l
|
l
|
l
|
l
|
l
|
|
Plan Change 6 (Tukituki Catchment)
- Submissions, hearing and decisions
phase
|
|
|
Plan Change 6 (Tukituki Catchment) was
publicly notified on 4th May 2013. Change 6 was called-in by the
Environment and Conservation Ministers (via the Environmental Protection
Authority) so it is part of the Tukituki Catchment Proposal (in conjunction
with applications for the Ruataniwha Water Storage project). Board of
Inquiry’s hearings held over 18 November 2013 to 21 January 2014.
The Board issued its draft decision on 15
April 2014 and subsequently issued its final decisions on 26 June.
|
l
|
l
|
l
|
l
|
l
|
l
|
l
|
l
|
|
- High Court appeals phase
|

|

|
Two appeals against the Board’s
decisions were lodged in the High Court on points of law. Resolution of
those appeals will be during the 2014-15 period.
|
|
|
|
|
|
|
|
|
|
Plan Change: Mohaka River catchment
- Stakeholder engagement and policy
drafting
|
|
|
An update report was
presented to the Regional Planning Committee in February 2014. That update
included reporting on a management framework for the Taharua sub-catchment, a
stakeholder engagement proposal and water quality monitoring trends.
For wider Mohaka
catchment, supporting science continued to be progressed, stakeholder
engagement has occurred in targeted interviews, focus groups during the
reporting period. Mohaka Consultation Group is yet to be formed as a
sounding board for issues, options, choices and plan drafting prior to
notification of a plan change. A consultant was engaged to prepare an
initial assessment of recreational use and values within the Mohaka River
catchment.
Extension to the time frame for plan
change notification was included in the 2013-14 Annual Plan (i.e.
notification Dec 2014).
|
l
|
l
|
l
|
|
|
|
l
|
l
|
|
Plan Change: Greater Heretaunga/Ahuriri
- Stakeholder engagement and policy
drafting
|
|
|
An update report was
presented to the Regional Planning Committee in September 2013. A
collaborative stakeholder group (the ‘TANK Group’) has been
discussing management options for groundwater and surface water resources in
the Greater Heretaunga and Ahuriri area (which includes the Tutaekuri,
Ahuriri, Ngaruroro and Karamu catchments, the Heretaunga aquifers and the
receiving marine environments). The TANK Group has prepared a report
outlining the Group’s 45 interim agreements. That report was
presented to the Regional Planning Committee in February 2014 where the RPC
endorsed the TANK Group’s work and agreed to have particular regard to
any consensus outcome from the group should one emerge. Previously (August
2012), the Council gave a good faith commitment to support any consensus
recommendations (that are consistent with other planning documents) from the
TANK Group.
Extension to the time
frame for regional plan change notification was included in the 2013-14
Annual Plan (i.e. notification Dec 2016).
|
l
|
l
|
l
|
l
|
l
|
l
|
l
|
l
|
|
Plan Change: urban stormwater
|
|
|
This Plan Change aligns
with Greater Heretaunga/Ahuriri plan change and the policy development will
stem from the collaborative process being undertaken by the
‘TANK’ Group.
Council adopted its
progressive implementation programme for NPS for Freshwater Management in
September 2012. That programme indicates stormwater plan change
notification in parallel to the regional plan change for Greater Heretaunga /
Ahuriri Catchment Area (i.e. notification Dec 2016).
|
l
|
l
|
|
|
|
|
l
|
l
|
|
RPS and/or plan change: 2010 Coastal
Policy Statement implementation
|
|
|
No specific investigations dedicated to
solely the coastal environment were necessary during the period. Gap analysis
of RCEP against 2010 NZCPS was commenced using a consultant and will be
completed in early 2014-15 period. Meanwhile, staff resources were
redirected to other projects. Nonetheless, a number of indirectly related
investigations have been commissioned in relation to catchment-based regional
plan changes (e.g.: Tukituki and Greater Heretaunga/Ahuriri areas) where the
coast is ultimately those catchment areas’ receiving environments.
Minister of Conservation issued his approval
(on 19 June 2014) of the RCEP’s coastal marine area-related provisions
over 18 months after the provisions were forwarded to his office.
|
l
|
l
|
|
|
|
|
l
|
l
|
|
Biodiversity Strategy
|
|
|
Project scoping
commenced and completed. Terms of Reference for Working Group have been
developed. Working Group’s first meeting held in October 2012
focussing on gaining an understanding of what the individuals in the group
were doing in the biodiversity area and how best to work as a group in the
future. Steering group have met and begun developing the strategy
objectives. Steering group members have been reviewed and Mana Whenua
connections made to contribute to the development. Refinement of
Biodiversity Accord complete with accord concepts to be further refined
through the steering group.
Inventory work is
completed and informed further field investigations undertaken in the 2013-14
summer period.
Due to staff focus on priority projects,
the timeline has been revised and the Strategy is now scheduled to be
completed in early 2015. A programme for work relevant to HBRC for
inclusion in the next Long Term Plan will be prepared in 2014-2015.
|
|
|
|
|
|
|
|
|
|
RPS Change for Biodiversity (significant
wetlands)
|
|
|
Policy development
is subject to completion of the Regional Biodiversity Strategy.
|
l
|
l
|
l
|
|
|
l
|
l
|
l
|
|
Identification of outstanding freshwater
bodies
|
|
|
Preliminary desktop review and scoping of
information regarding possible evaluation criteria was undertaken during
preparation of RRMP Change 5 (2012-13 period). Further criteria
development and waterbody assessment by HBRC was parked pending in
particular, development of national guidance on this issue by Ministry for
the Environment, and the resolution of Change 5 appeals. In June,
Council lodged an application to MfE’s Community Environment Fund to
provide resourcing for a proposal to develop criteria, a methodology and run
‘pilot’ project in Hawke's Bay for identification of outstanding
freshwater bodies. As at 1 August 2014, the Minister for the Environment
was yet to announce if that funding application was successful.
|
|
|
|
|
|
|
|
|
|
RPS Change for outstanding freshwater
bodies
|
|
|
Policy development
is subject to completion of the identification of outstanding freshwater
bodies.
|
l
|
l
|
l
|
|
|
|
l
|
l
|
|
Plan change: rest of region
|

|
|
No specific policy
development activity during the 2013-14 period.
|
l
|
l
|
l
|
l
|
l
|
l
|
l
|
l
|
|
Specific
plan effectiveness monitoring programmes (Tukituki; Taharua/Mohaka;
Heretaunga/Ahuriri)
|
|
|
Specific plan
effectiveness monitoring and reporting not yet developed. Development
of implementation plan (and associated plan effectiveness monitoring
programme) to be a focus during the 2014-15 period.
|
|
|
|
|
|
|
|
|
|
RPS/ Plan Effectiveness Reporting/Review
|
|
|
No specific plan
effectiveness monitoring and reporting scheduled during the 2013-14 period.
|
|
|
|
|
|
|
|
|
|
SOE Reporting and Review (5 yearly,
annual)
|
|
|
Council undertakes monthly and annual
reporting on specific investigations carried out in that reporting
period. Every five years Council undertakes State of the Environment
Reporting to assess longer term trends. Council is currently compiling
the five-yearly state of the environment report due for publication in late
2014.
|
|
|
|
|
|
|
|
|
|
Regional Afforestation Scheme
|
|
|
Council proposed to work in partnership
with landowners with highly erodible land to promote afforestation of the
steepest and least productive portion of their land in return for a share of
carbon credit revenue. The afforestation of steep, highly erodible hill
country would likely improve water quality in rivers due to reduced sediment
from erosion. This project commonly known as ‘Trees on
Farms’ has been put on hold indefinitely as the current down turn in
carbon prices has significantly reduced the economic viability of the project
as a working model. In 2013, Council instructed staff to explore other
options and seek other economic drivers for investment.
|
|
|
|
|
|
|
|
|
|
Water Storage Investigations –
Ruataniwha & Ngaruroro/Heretaunga Plains
|
|
|
A pre-feasibility study was completed for
the Ngaruroro/ Heretaunga Plains catchment in 2011. An on farm economic
assessment to determine the viability of water storage for the Ngaruroro
catchment needs to be conducted. This will help to establish if the
project should proceed to a feasibility investigation. This economic
assessment was due for completion in 2012 however it has been deferred due to
resource constraints. It is anticipated that recommendations will be
made to Council in 2015. This is being considered as part of the
Greater Heretaunga / Ahuriri policy development work.
Consent
applications for the Ruataniwha Water Storage Scheme (RWSS) were lodged with
the Environmental Protection Authority on May 2013 and were subsequently
called in by the Environment and Conservation Ministers as part of the
‘Tukituki Catchment Proposal’ (alongside Plan Change 6) . The
RWSS applications were notified by the EPA on 6 July 2013. The Board
issued its draft decisions on 15 April 2014 and subsequently issued its final
decision on 26 June.
|
|
|
|
|
|
|
|
|
|
Science
investigations to support plan changes including nutrient modelling;
groundwater modelling; instream flow assessments; water quality monitoring;
flow gauging; surface water/ groundwater interactions for Heretaunga Plains
|
|
|
Targeted water quality investigations are
on-going and feed into the Tukituki, TANK and Mohaka Plan Changes. This is
over and above Council’s statutory obligations for monitoring surface
water quality throughout the region. The objectives of the work is to better
define current state; define and understand ecological and physical-chemical
conditions and dynamics; and allow for effective limit setting in relation to
water quality limits.
|
|
|
|
|
|
|
|
|
|
Implementation of Water Measuring
Regulations
|
|
|
The first phase of the transitional
Resource Management (Measurement and Reporting of Water Takes) Regulations
2010 came into force on 10 November 2012. This affected approximately
950 consents of which 450 new water meter installations were
required, for consented rates of at 20 litres/second or more.
Council reached effective 100% compliance with the Regulations by September
2013. The second phase of the transitional Regulations comes into force
from 10 November 2014 for water takes of 10 litres/second or more, but less
than 20 litres/second. Council is currently progressing with the
verification of phase two and anticipates full compliance will be achieved by
the November 2014 timeframe.
Of those water takes that are currently
required to be metered (i.e. required by the Regulations or consent
conditions), approximately 40% supply that data by telemetry (daily cellphone
communications) to HBRC.
|
|
|
|
|
|
|
|
|
|
Facilitation of water user groups
|
|
|
Council is continuing to work with water
users to establish efficient water use through alternative water management
options. This is on a ‘where and when’ basis due to
resourcing limitations (funding and staffing levels). Council has
facilitated the establishment of key water user groups such as the Ngaruroro
Irrigation Society and the Twyford Irrigators Group. Both of these
water user groups are part of the TANK collaborative stakeholder group.
|
|
|
|
|
|
|
|
|
|
Management and mitigation plans
|
|
|
Council is working towards an adaptive
management framework with key stakeholders to achieve limits and targets in
Tukituki Plan Change 6. Phosphorus management plans within priority
sub-catchments are proposed to address phosphorus loads using specific
mitigation methods suited to the situation. Methods could include
afforestation of hill country to address sediment migration into waterways.
The Phosphorous
Management Framework
is in the
final
development stages
in conjunction with AgResearch,
|
|
|
|
|
|
|
|
|
|
|
|
|
|
|
|
|
|
|
|
|
|
|
Facilitation of catchment groups for
non-point source discharges
|
|
|
Council is working on an adaptive
management framework to manage non-point source discharges from land into
water. A pilot is being developed for the Tukituki Catchment that will
comprise an overall facilitation group informed by the primary industry pan
sector which then supports six sub-catchment operational groups which
comprises landowners, Hapu and HBRC. The objectives of the pilot are to
build the capacity within the sub-catchment groups to enable them to self
manage to reduce/mitigate contaminant discharges with a focus on nutrients.
The pilot is being in run in the Papanui
catchment. In the past year there has been significant science
investment which has run in parallel to the development of a Catchment
Management Plan and in tandem with significant community engagement. A
mauri monitoring pilot is also under development for the catchment.
|
|
|
|
|
|
|
|
|
|
|
|
|
|
|
|
|
|
|
|
|
|