Meeting of the Hawke's Bay Regional Council
Date: Wednesday 25 June 2014
Time: 9.00am
|
Venue:
|
Council Chamber
Hawke's Bay Regional Council
159 Dalton Street
NAPIER
|
Attachments
Excluded From Agenda
item subject page
8. Decision
on Ruataniwha Water Storage Scheme Investment
Attachment 1: Sainsbury
Logan and Williams Legal opinion 8 April 2014 2
Attachment 2: Sainsbury
Logan & Williams Legal opinion 18 June 2014 13
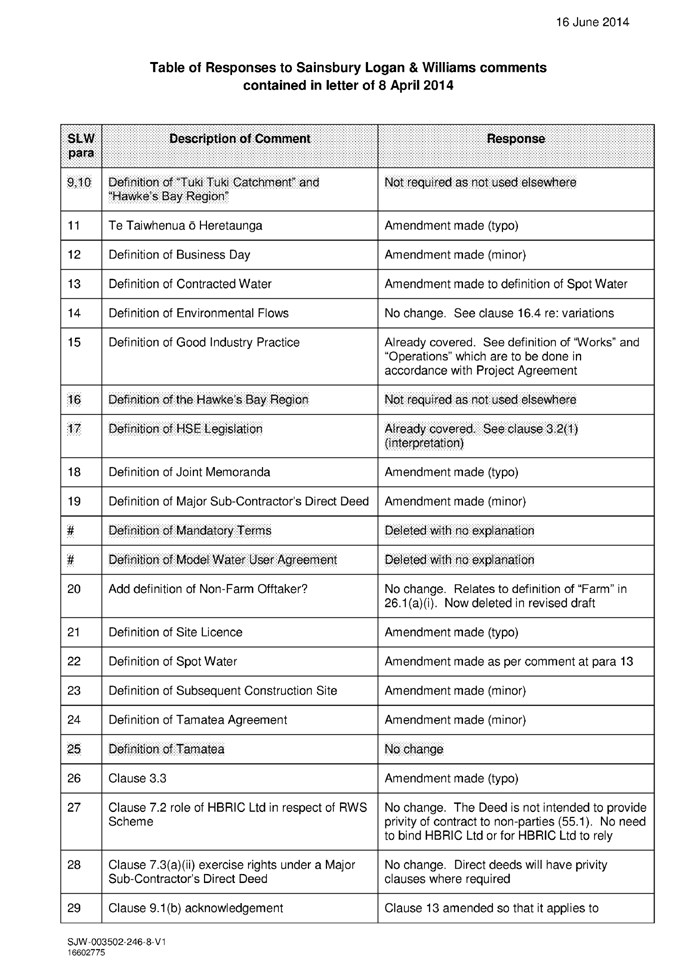
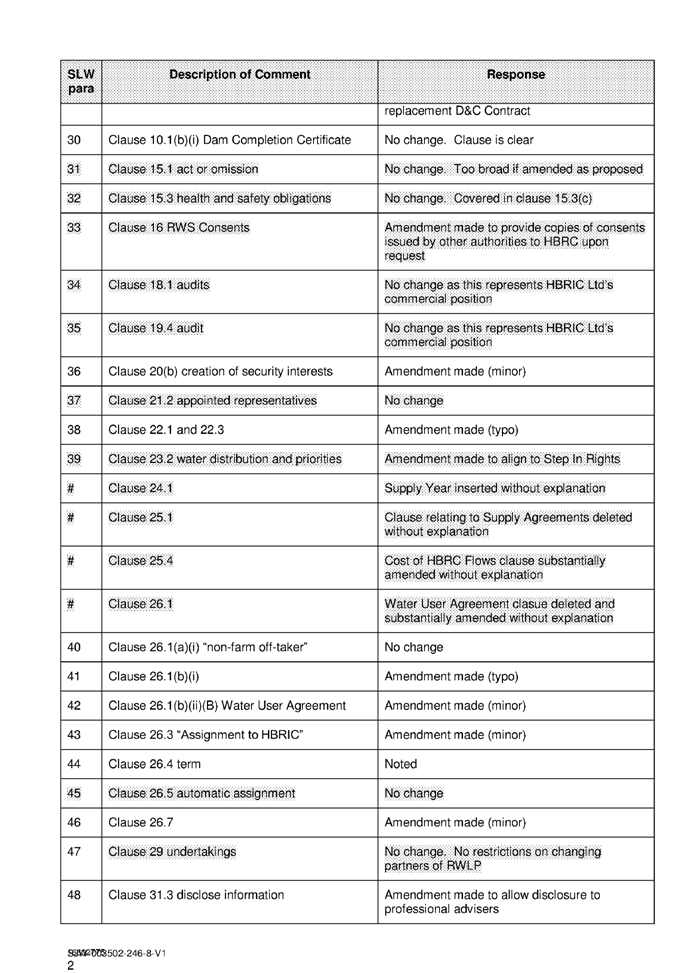
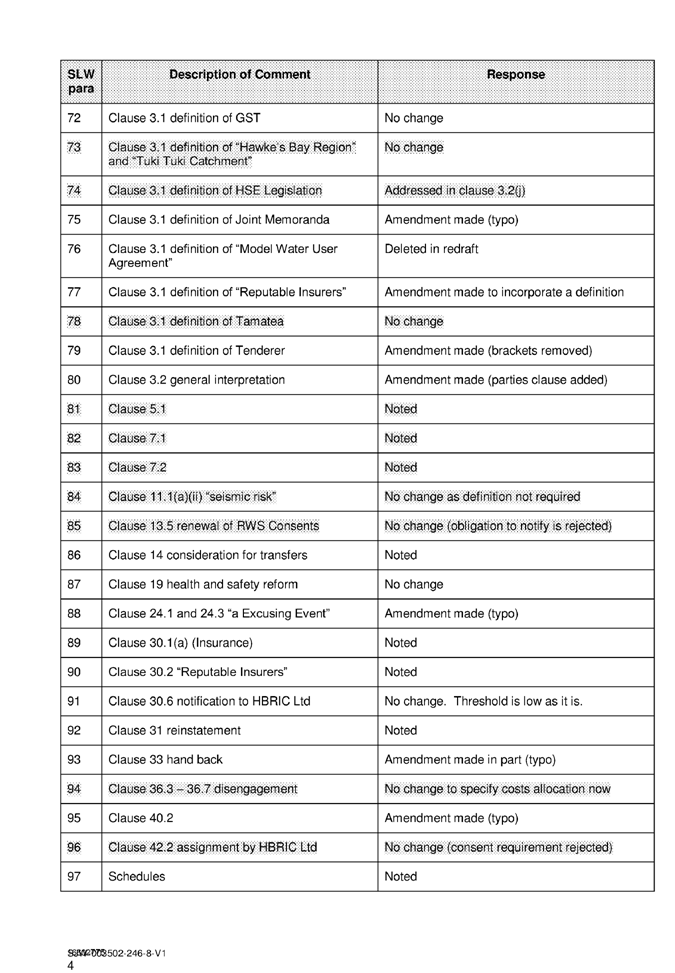
Attachment 3: Table
of Responses - changes to legal documents 15
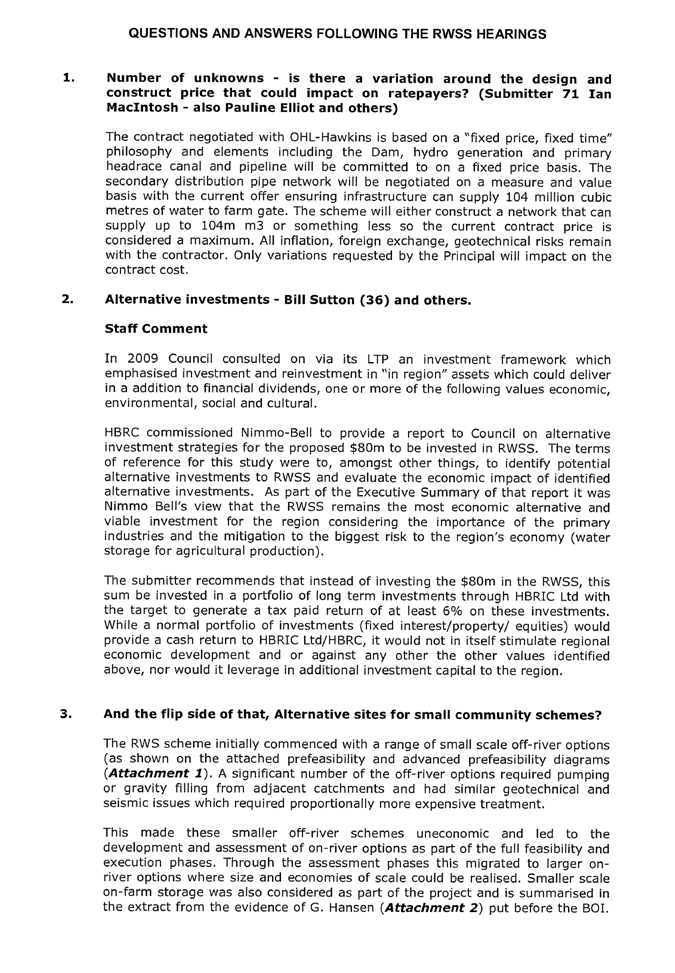
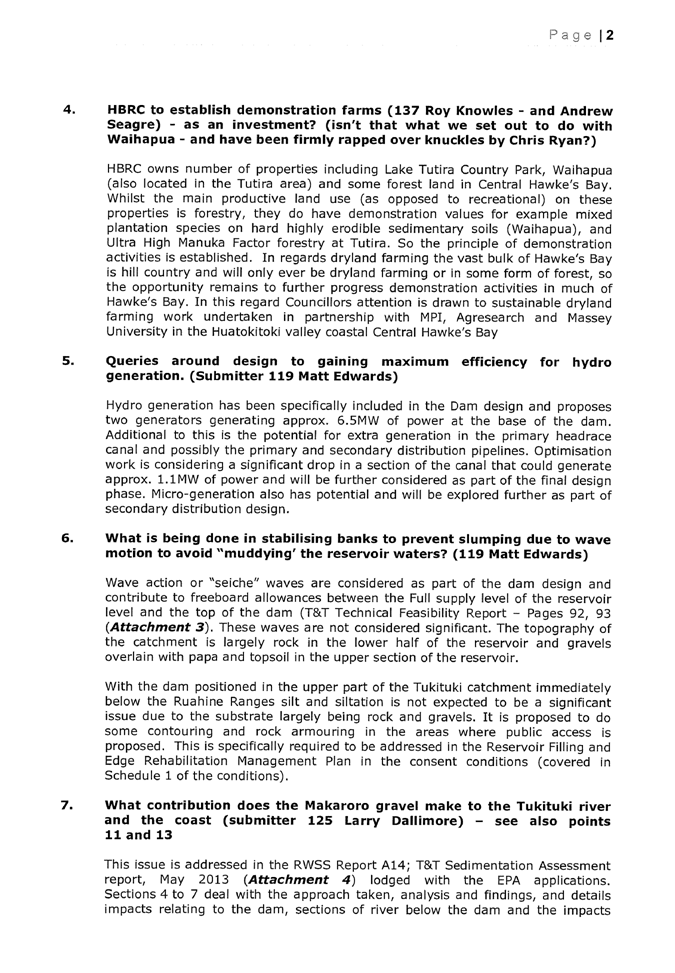
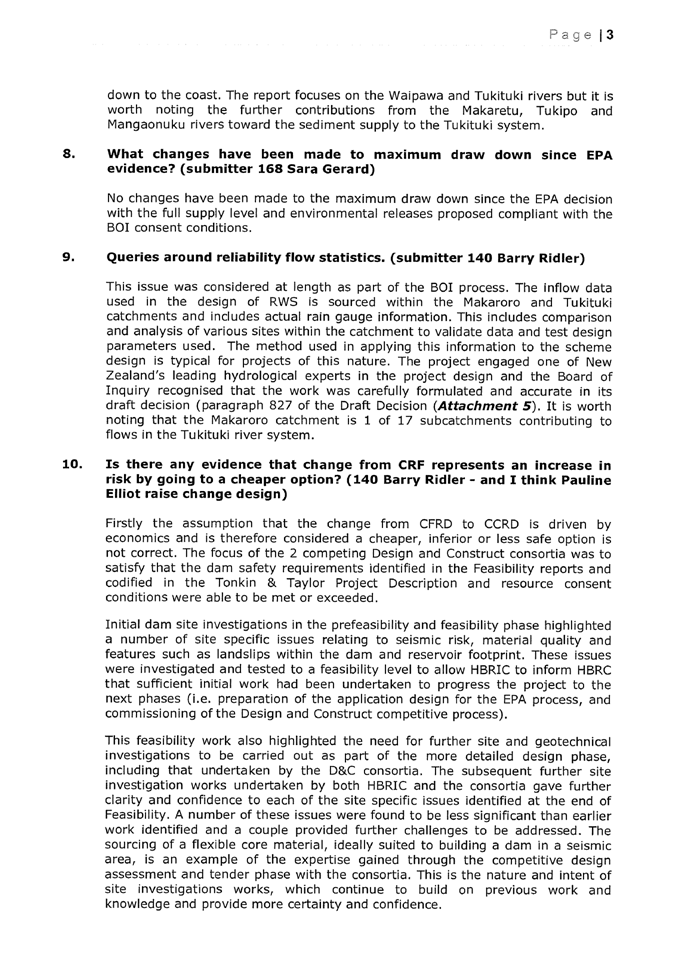
Attachment 4: Answers
to questions raised by submitters 19
Attachment 5: Alternative
off-river options investigated 24
Attachment 6: BoI
evidence for on-farm storage investigation 26
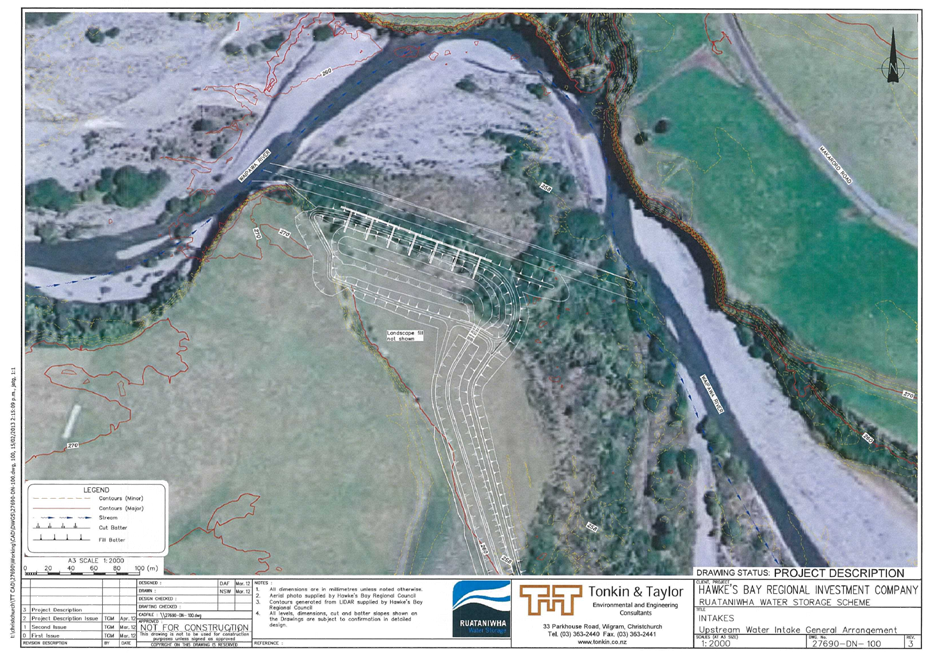
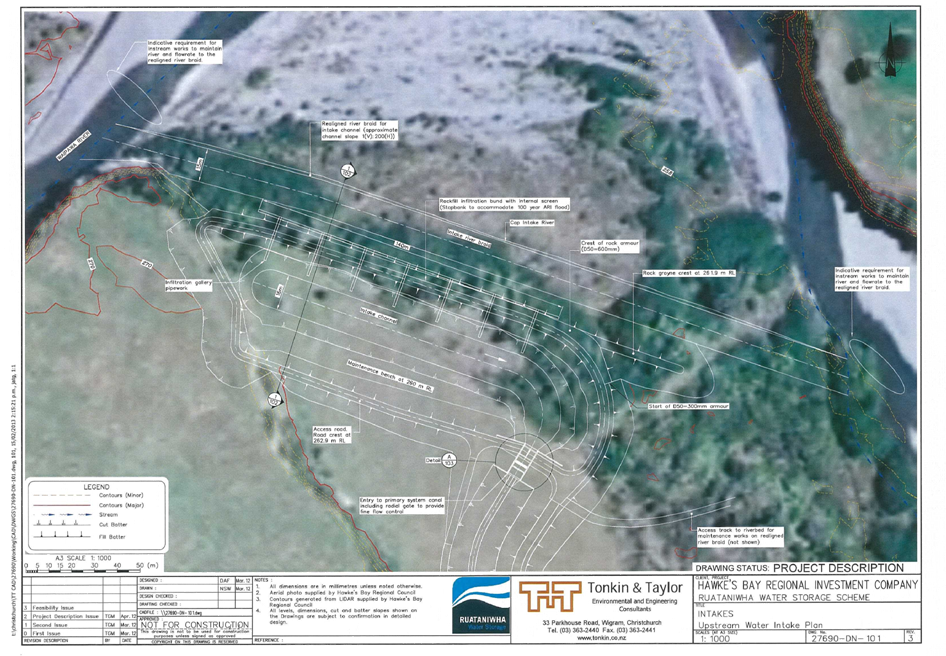
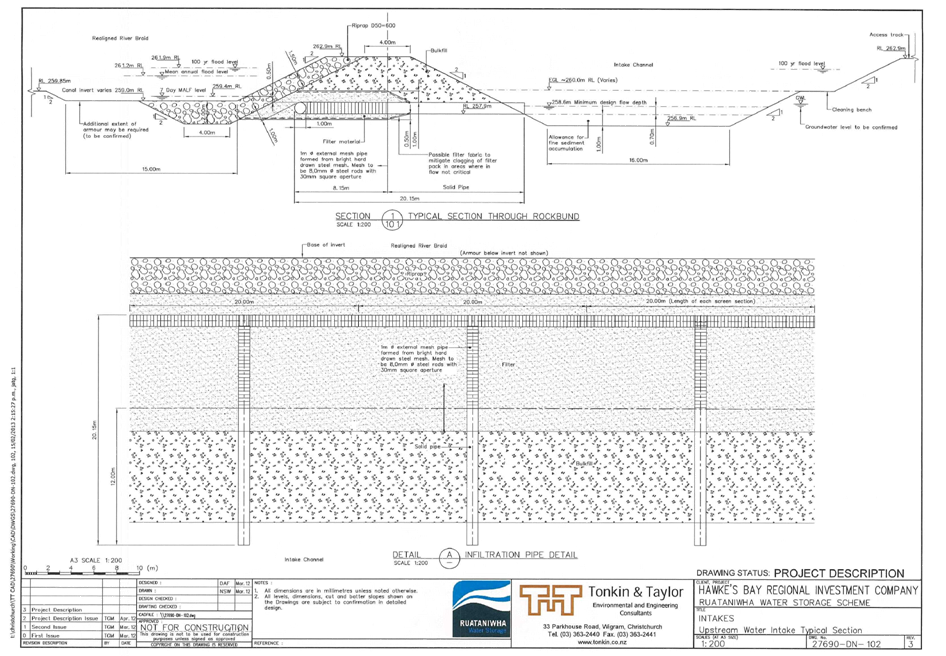
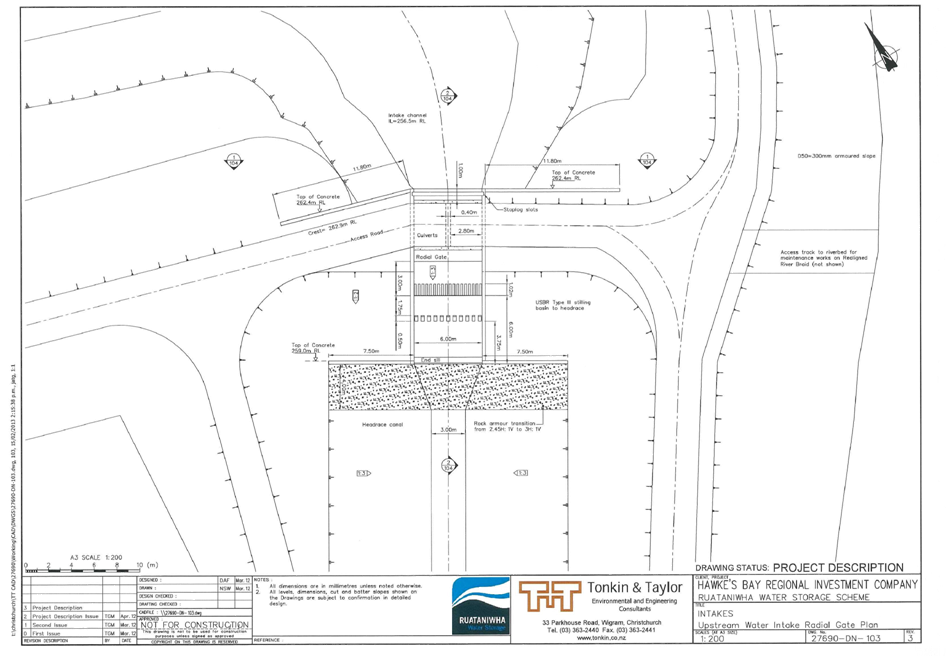
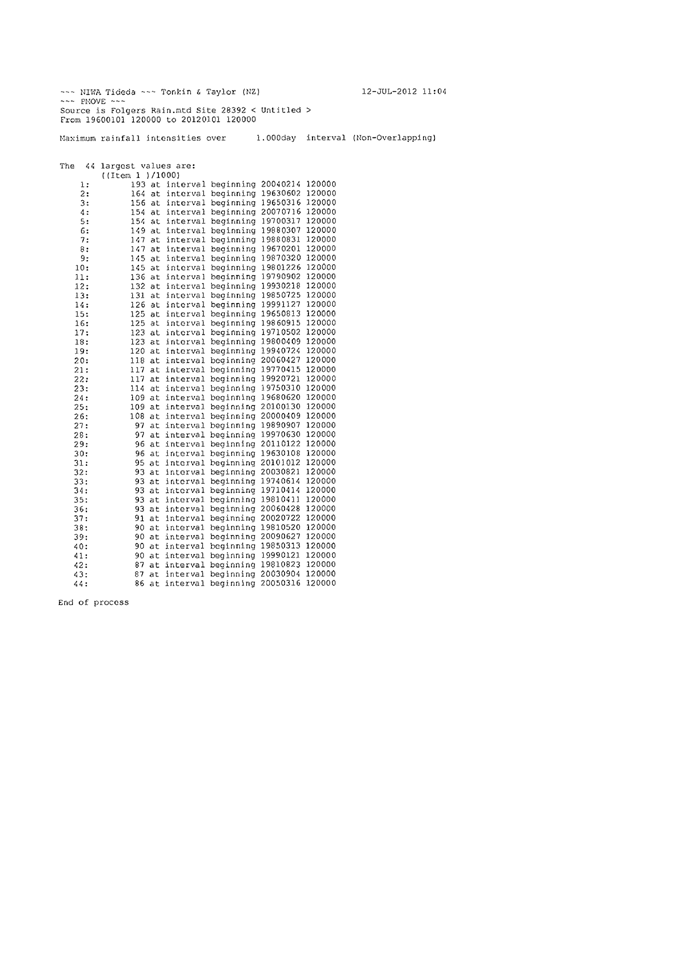
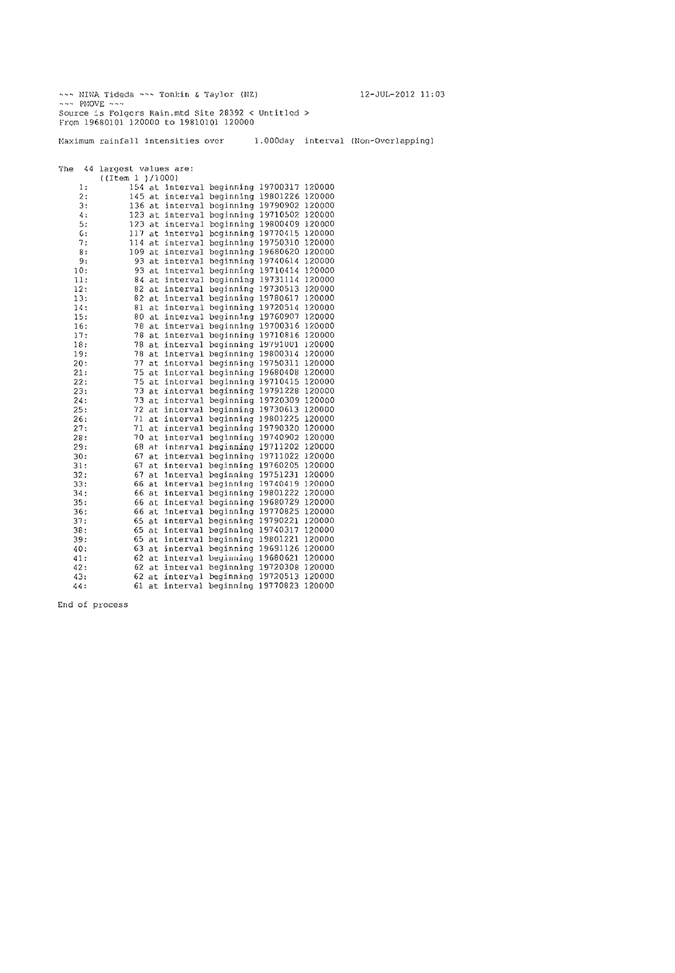
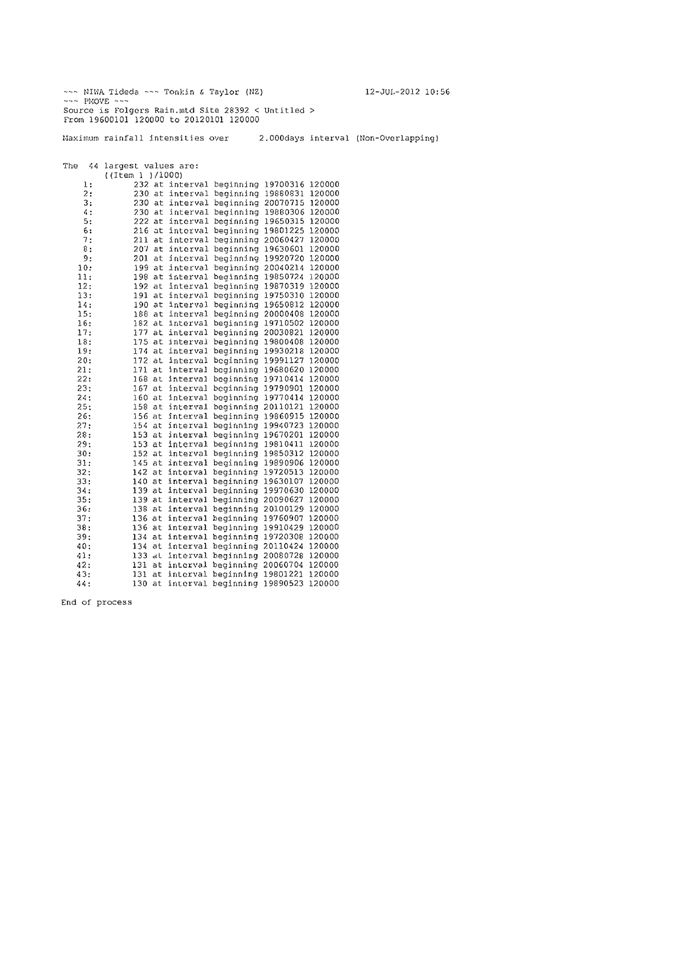
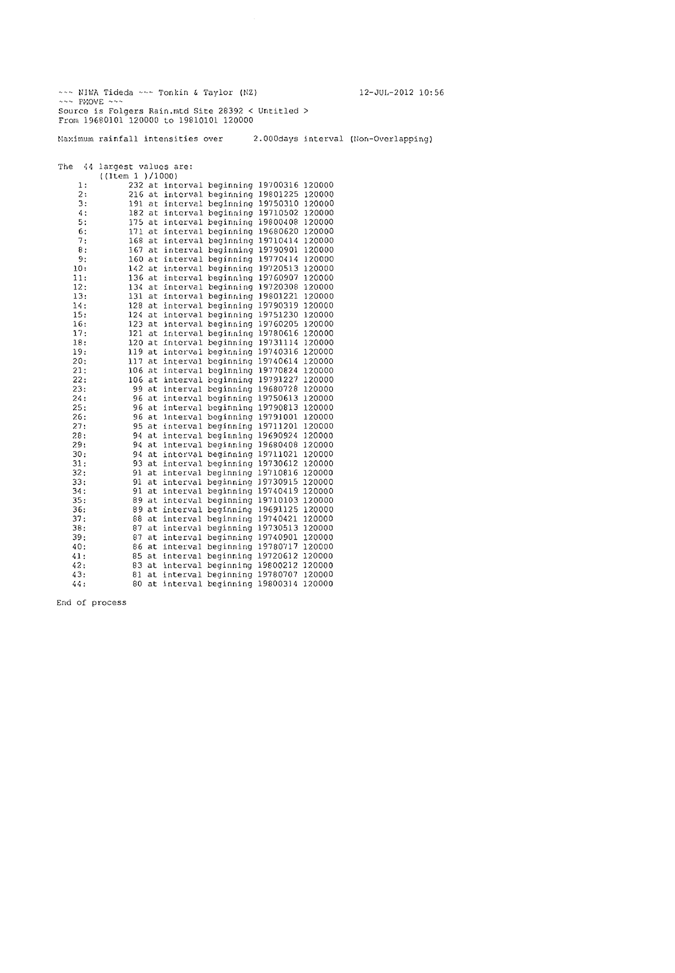
Attachment 7: Extract
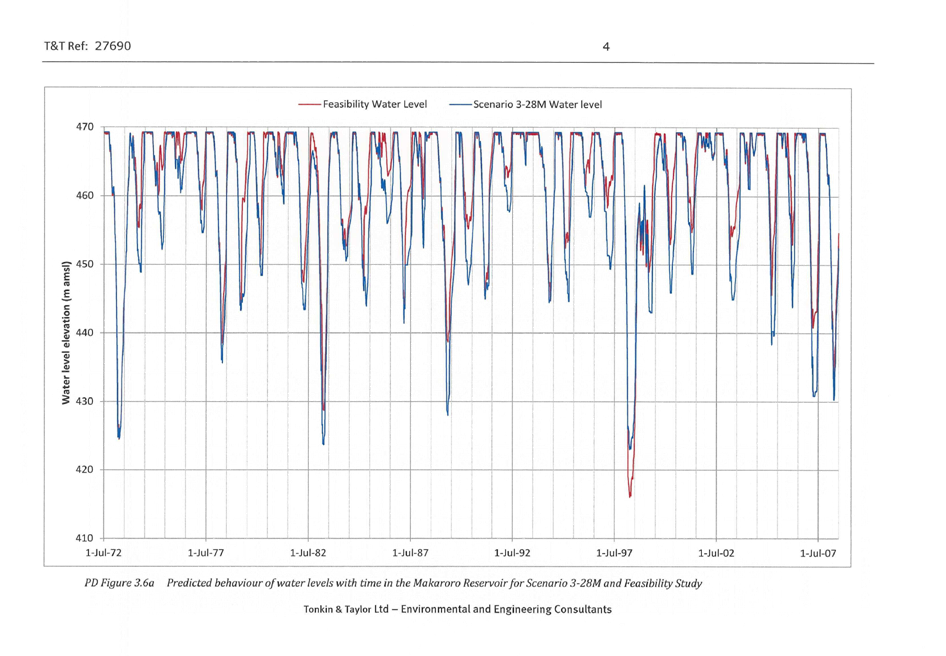
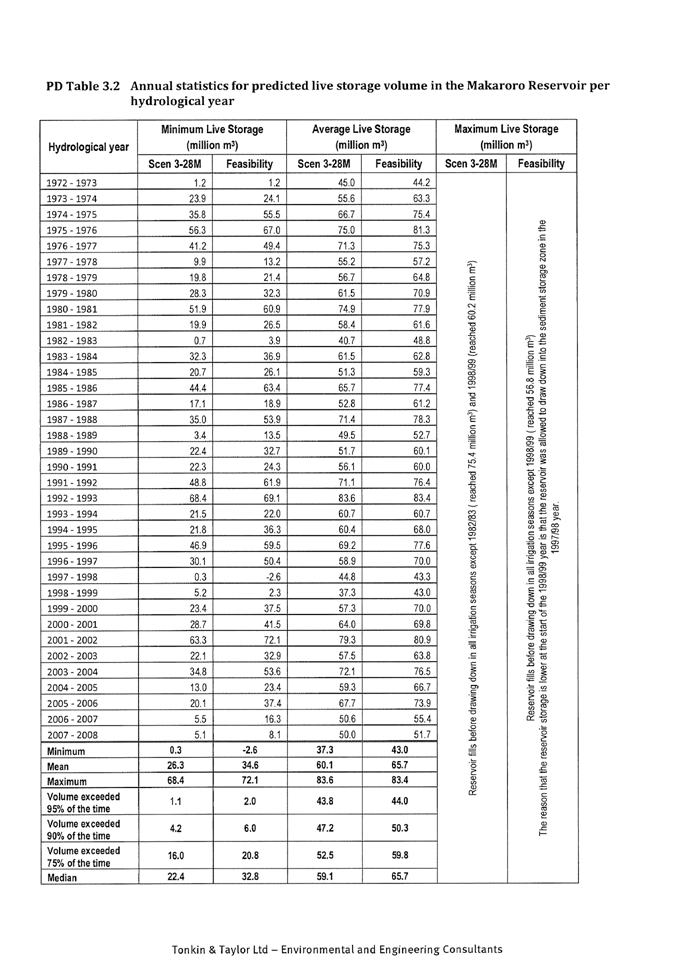
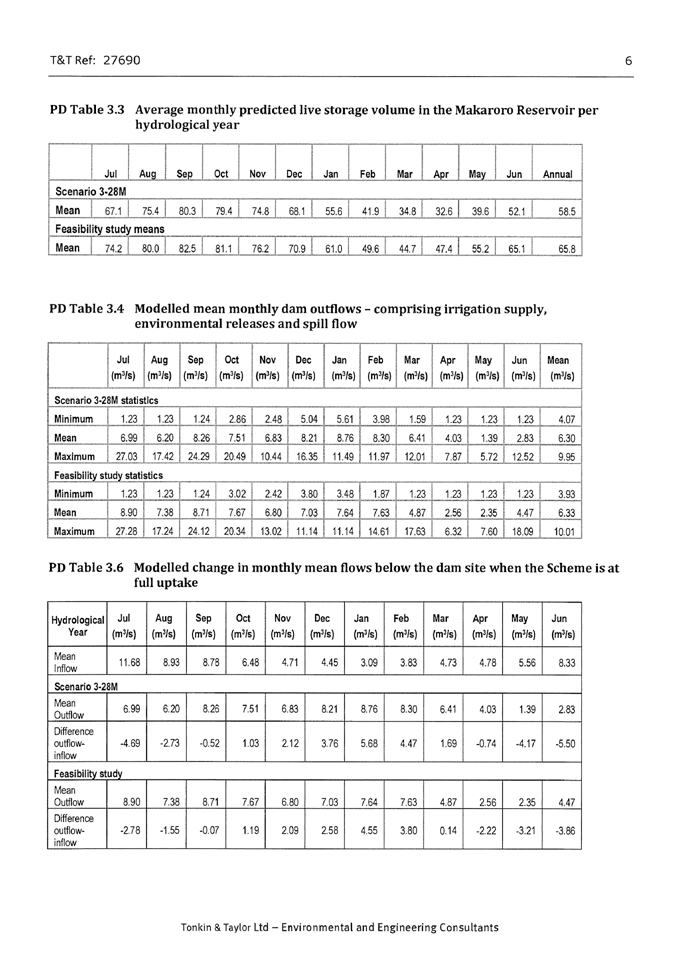
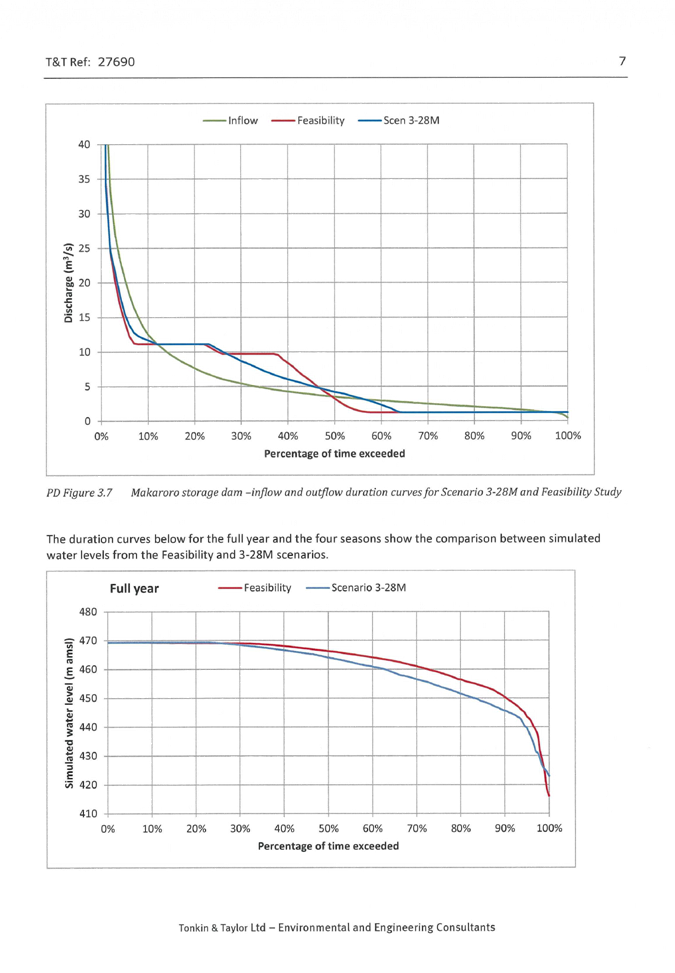
from Tonkin and Taylor Technical Feasibility Report - reservoir level 32
Attachment 8: Extract
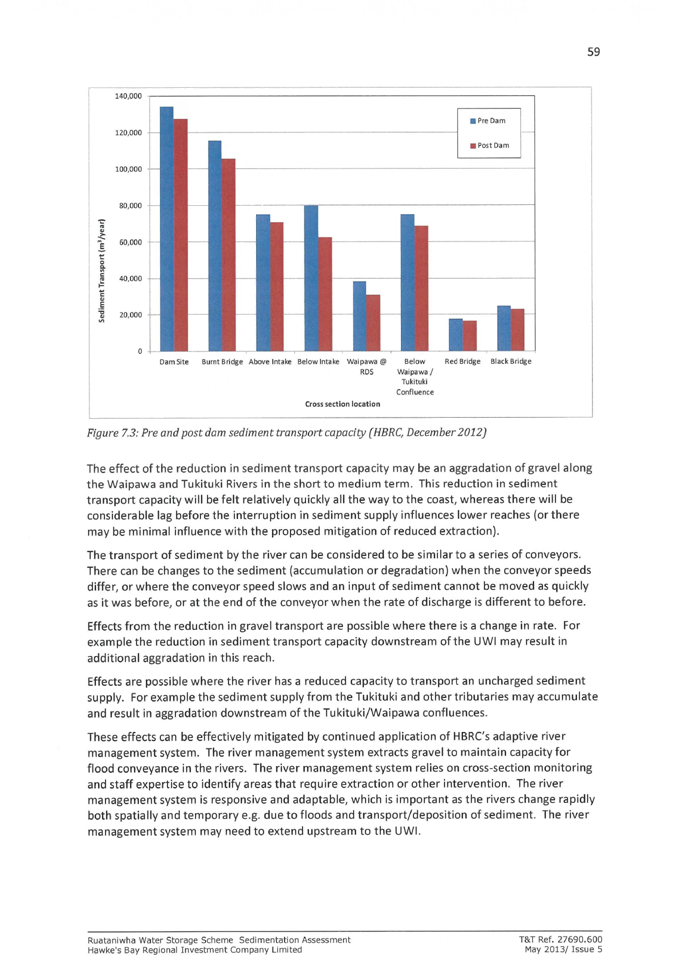
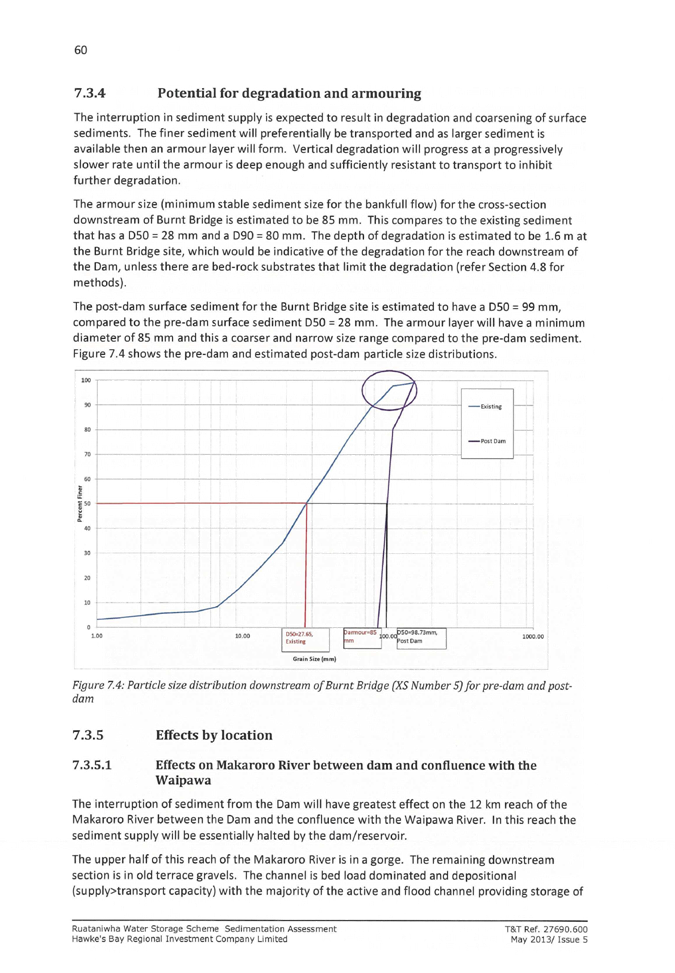
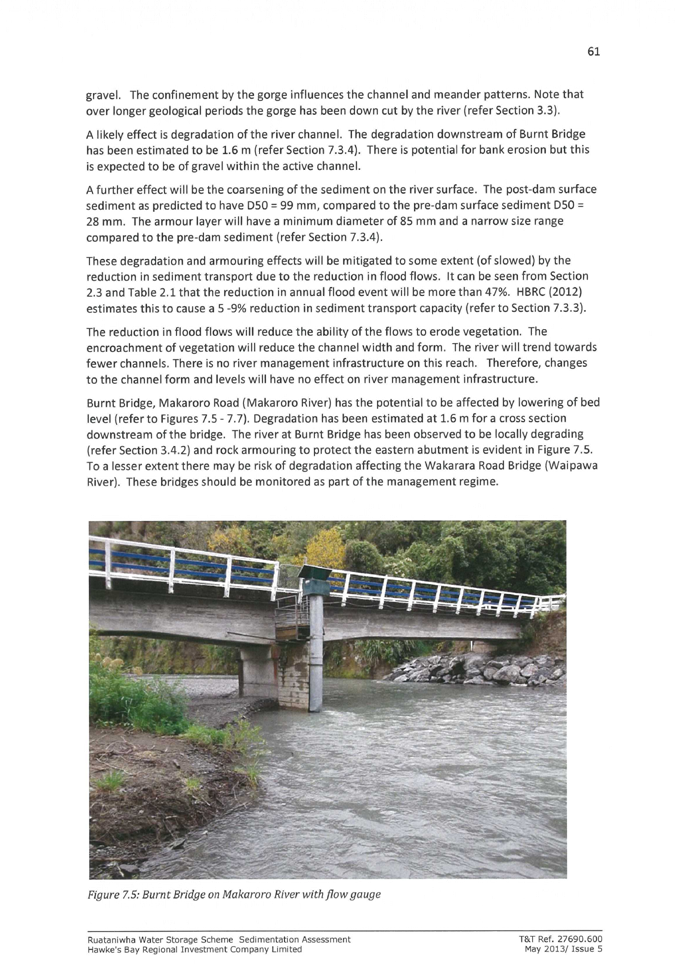
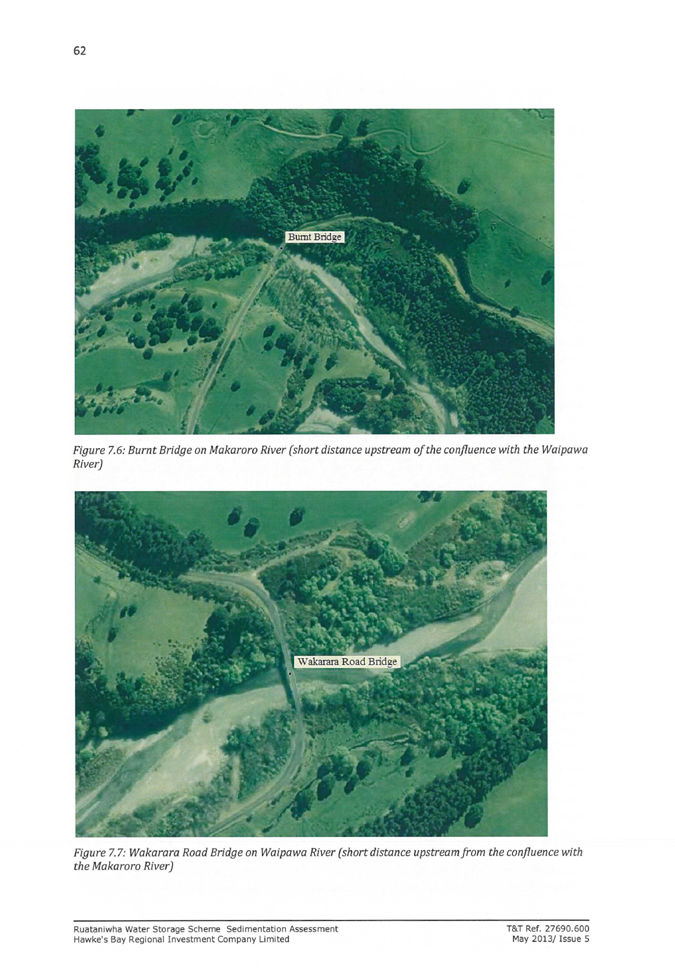
from Tonkin and Taylor Sedimentation Assessment 34
Attachment 9: Extract
from Draft BoI decision on Flow Statistics 261
Attachment 10: Extract
from Draft BoI decision on movement of river gravel 262
Attachment 11: Update
on water user agreements and legal report 268
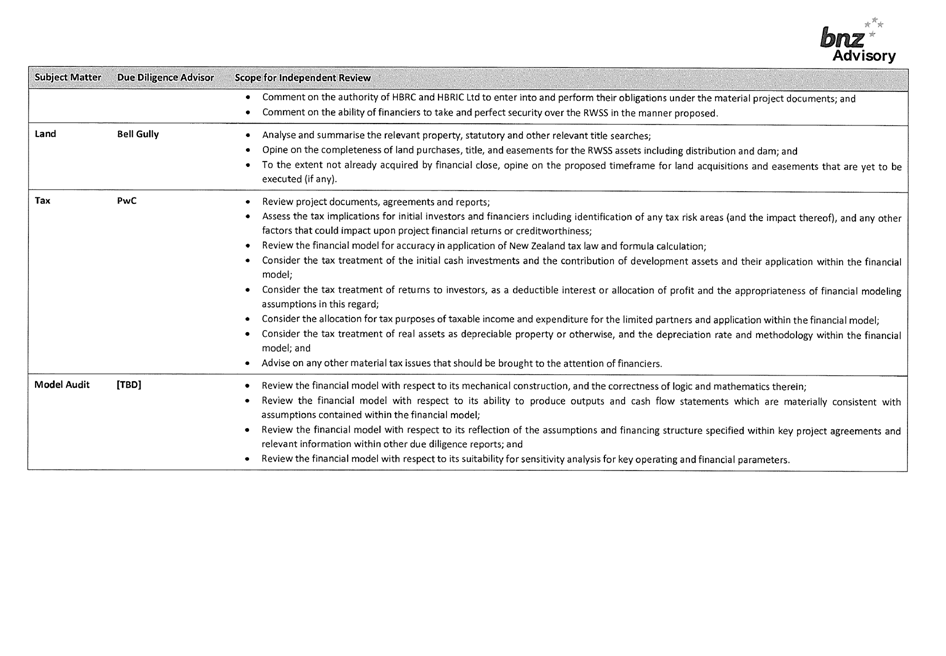
Attachment 12: HBRIC
Ltd Letter and Scope of Due Diligence 273
11. Adoption
of the Hawke's Bay Regional Council 2014-15 Annual Plan
Attachment 2: HBRC
2014-15 Annual Plan - Part 1 Introduction 278
Attachment 3: HBRC
2014-15 Annual Plan - Part 2 Activivities 304
Attachment 4: HBRC
2014-15 Annual Plan - Part 3 Financial Information 372
|
Sainsbury
Logan and Williams Legal opinion 8 April 2014
|
Attachment 1
|
|
Sainsbury Logan &
Williams Legal opinion 18 June 2014
|
Attachment 2
|
|
Table of Responses -
changes to legal documents
|
Attachment 3
|
|
Answers to questions raised
by submitters
|
Attachment 4
|
|
Alternative off-river options
investigated
|
Attachment 5
|
|
Alternative
off-river options investigated
|
Attachment 5
|
|
BoI
evidence for on-farm storage investigation
|
Attachment 6
|
|
Extract from Tonkin and
Taylor Technical Feasibility Report - reservoir level
|
Attachment 7
|
|
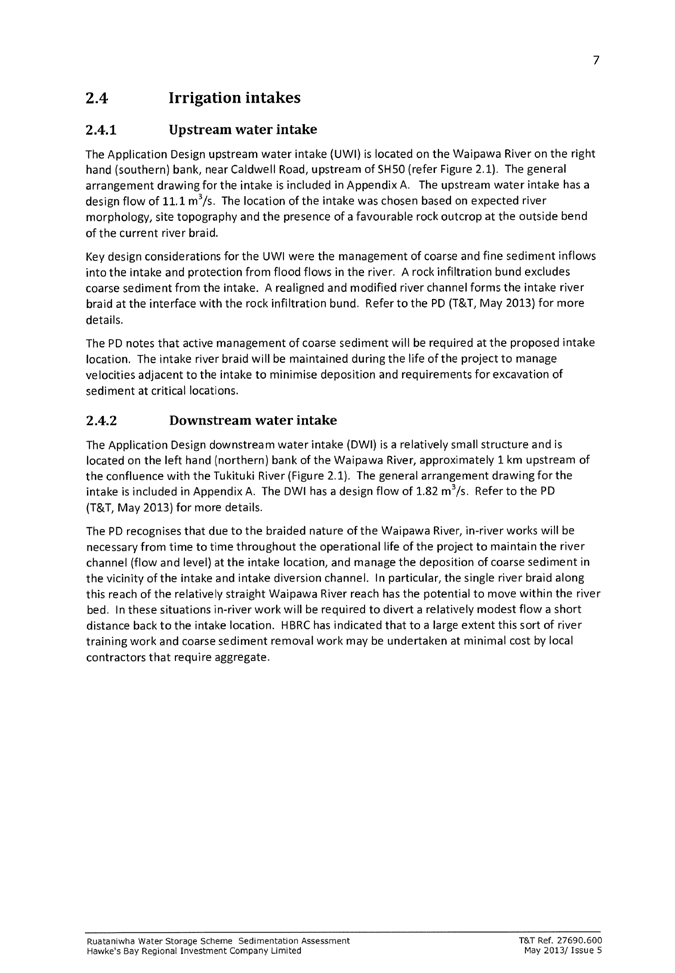
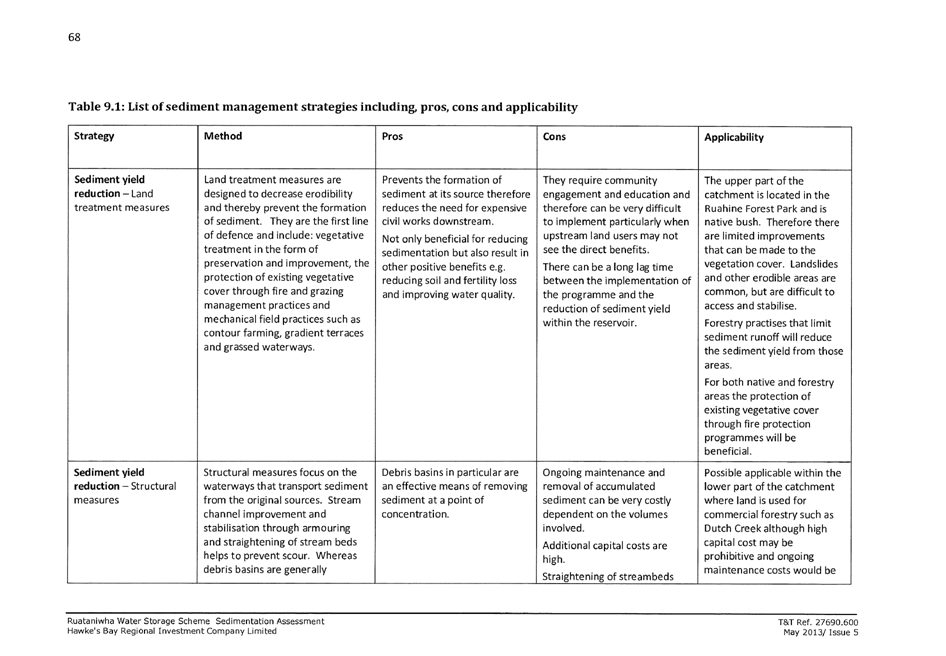
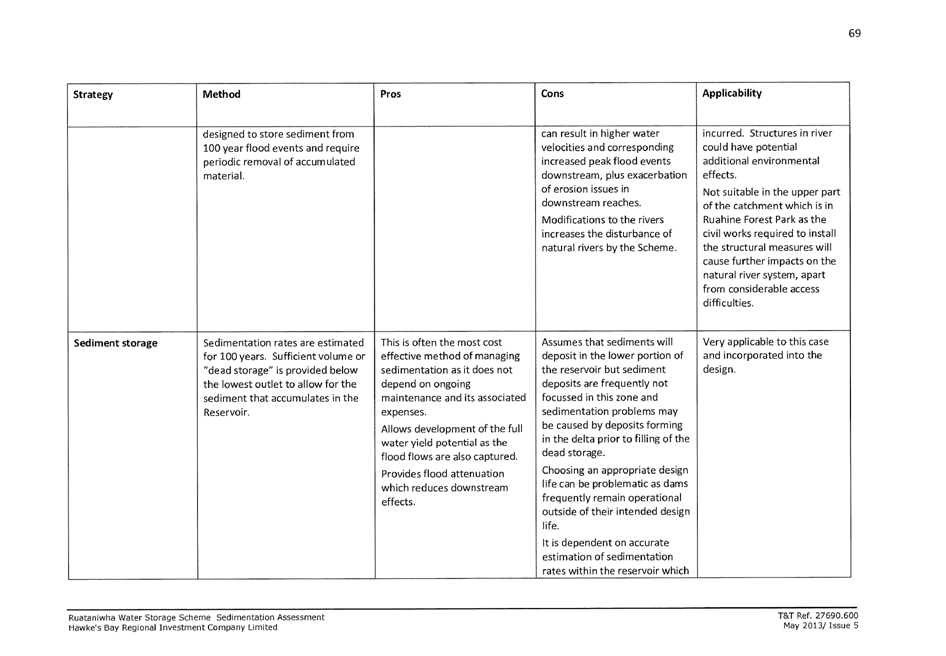
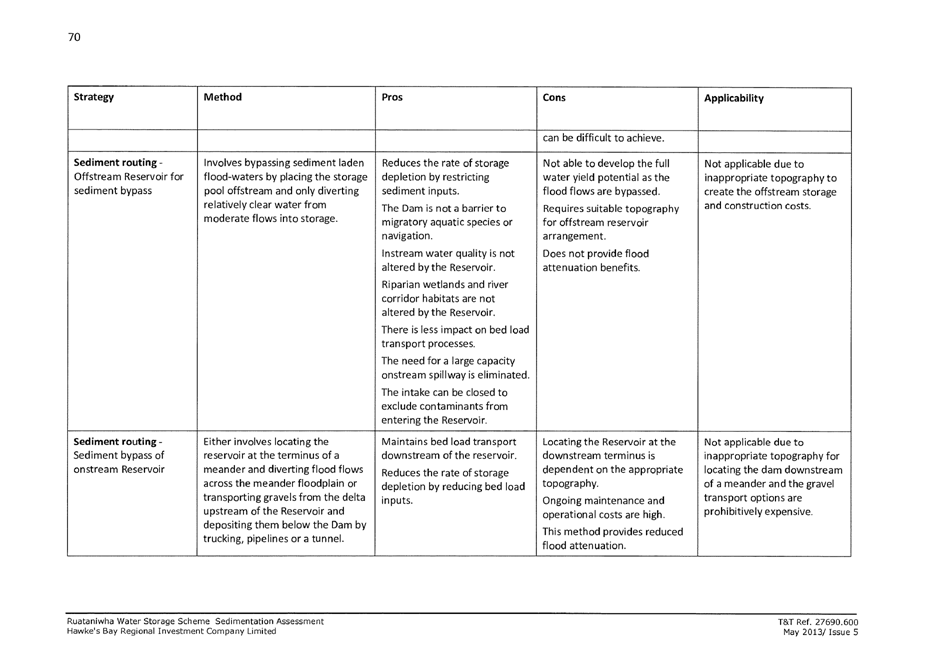
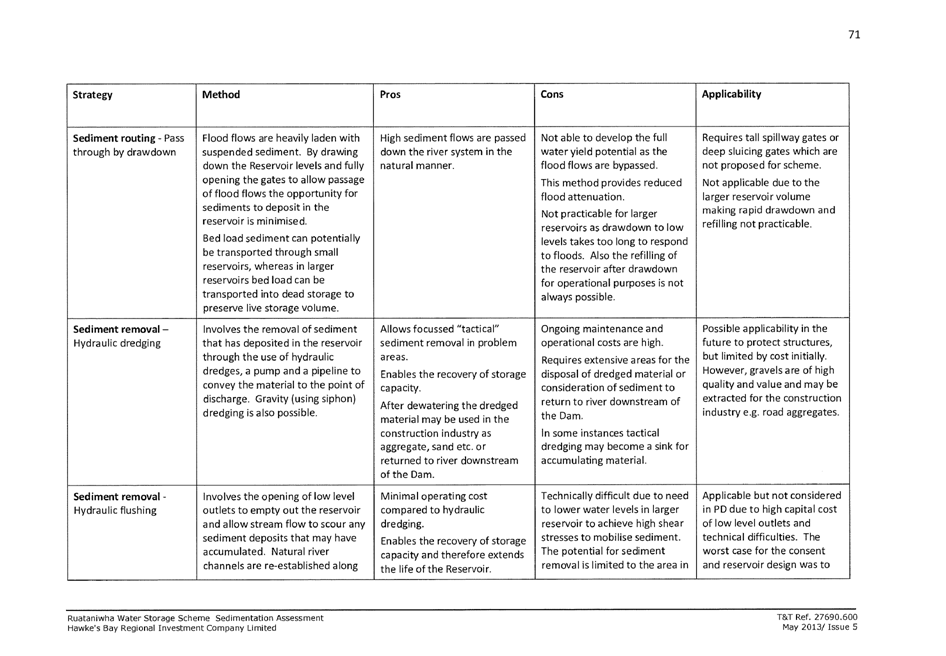
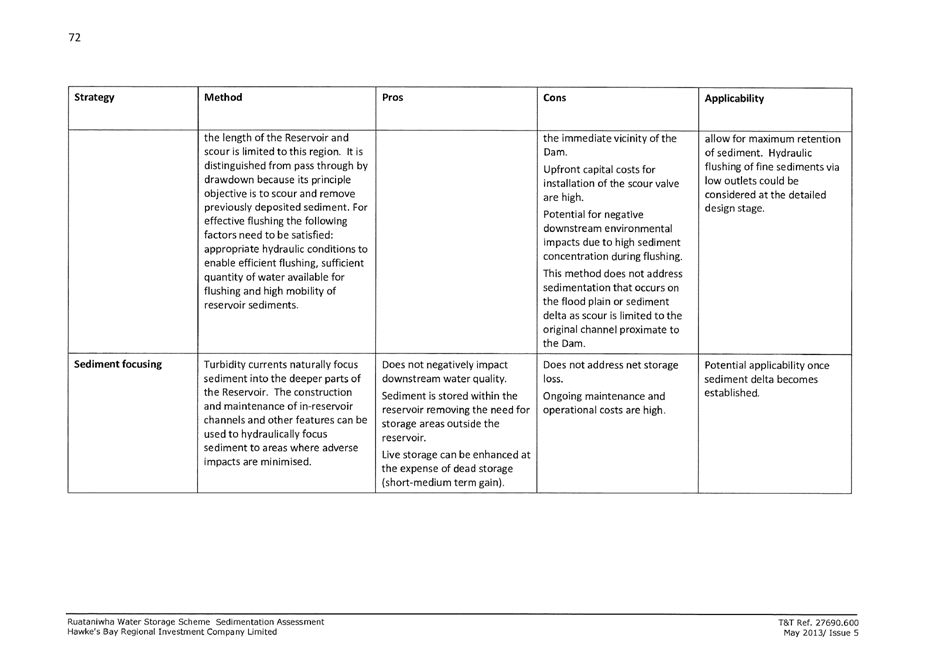
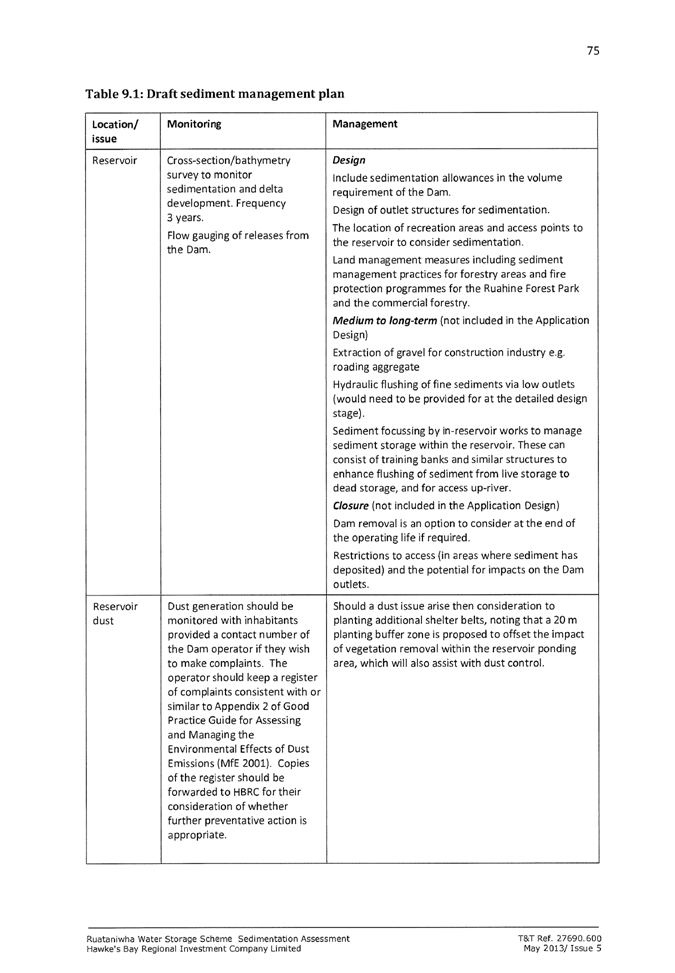
Extract from Tonkin and
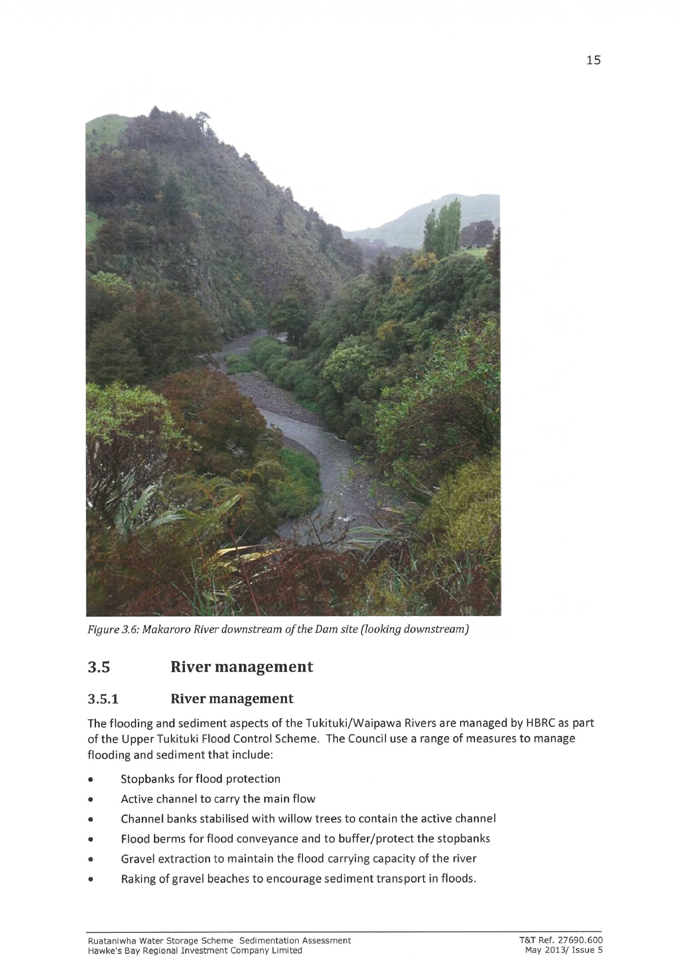
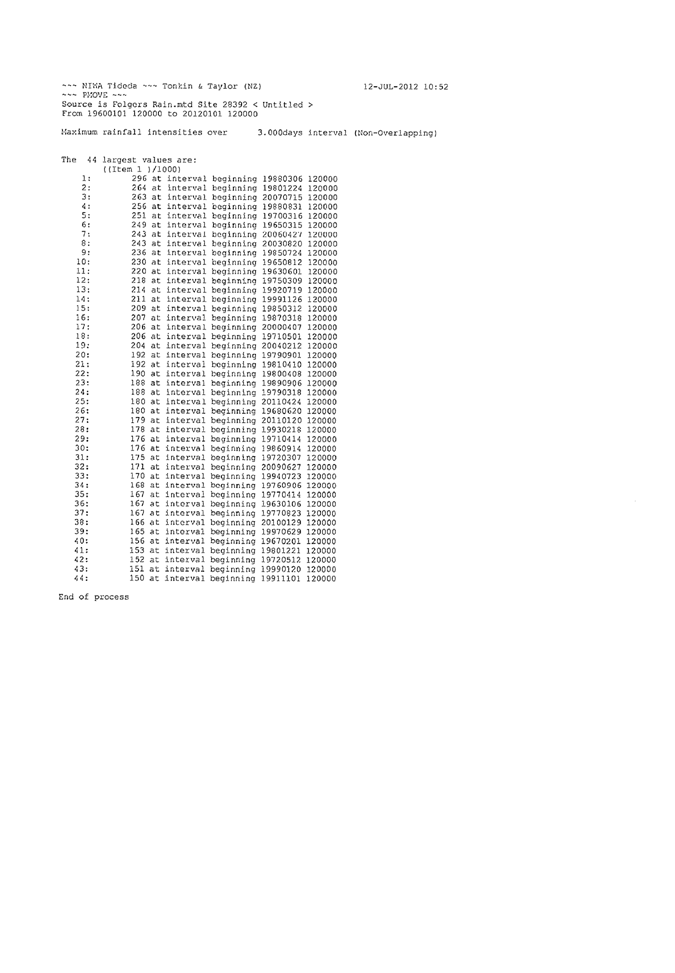
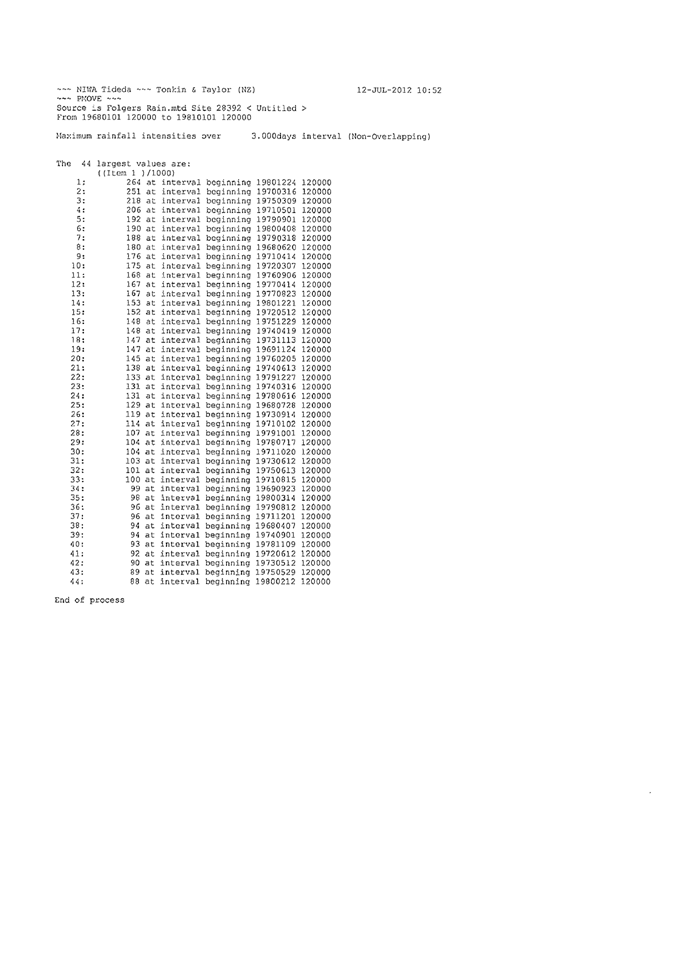
Taylor Sedimentation Assessment
|
Attachment 8
|


|
Extract
from Tonkin and Taylor Sedimentation Assessment
|
Attachment 8
|
|
Extract
from Tonkin and Taylor Sedimentation Assessment
|
Attachment 8
|


|
Extract
from Tonkin and Taylor Sedimentation Assessment
|
Attachment 8
|
|
Extract
from Tonkin and Taylor Sedimentation Assessment
|
Attachment 8
|
|
Extract
from Tonkin and Taylor Sedimentation Assessment
|
Attachment 8
|
|
Extract
from Tonkin and Taylor Sedimentation Assessment
|
Attachment 8
|


|
Extract
from Tonkin and Taylor Sedimentation Assessment
|
Attachment 8
|
|
Extract
from Tonkin and Taylor Sedimentation Assessment
|
Attachment 8
|

|
Extract
from Tonkin and Taylor Sedimentation Assessment
|
Attachment 8
|


|
Extract
from Tonkin and Taylor Sedimentation Assessment
|
Attachment 8
|


|
Extract
from Tonkin and Taylor Sedimentation Assessment
|
Attachment 8
|
|
Extract
from Tonkin and Taylor Sedimentation Assessment
|
Attachment 8
|

|
Extract
from Tonkin and Taylor Sedimentation Assessment
|
Attachment 8
|
|
Extract
from Tonkin and Taylor Sedimentation Assessment
|
Attachment 8
|


|
Extract
from Tonkin and Taylor Sedimentation Assessment
|
Attachment 8
|
|
Extract
from Tonkin and Taylor Sedimentation Assessment
|
Attachment 8
|

|
Extract
from Tonkin and Taylor Sedimentation Assessment
|
Attachment 8
|
|
Extract
from Tonkin and Taylor Sedimentation Assessment
|
Attachment 8
|


|
Extract
from Tonkin and Taylor Sedimentation Assessment
|
Attachment 8
|

|
Extract
from Tonkin and Taylor Sedimentation Assessment
|
Attachment 8
|
|
Extract
from Tonkin and Taylor Sedimentation Assessment
|
Attachment 8
|
|
Extract
from Tonkin and Taylor Sedimentation Assessment
|
Attachment 8
|
|
Extract
from Tonkin and Taylor Sedimentation Assessment
|
Attachment 8
|
|
Extract
from Tonkin and Taylor Sedimentation Assessment
|
Attachment 8
|
|
Extract
from Tonkin and Taylor Sedimentation Assessment
|
Attachment 8
|
|
Extract
from Tonkin and Taylor Sedimentation Assessment
|
Attachment 8
|


|
Extract
from Tonkin and Taylor Sedimentation Assessment
|
Attachment 8
|

|
Extract
from Draft BoI decision on Flow Statistics
|
Attachment 9
|
|
Extract from Draft BoI
decision on movement of river gravel
|
Attachment 10
|
|
Update on water user
agreements and legal report
|
Attachment 11
|
|
HBRIC Ltd Letter and Scope
of Due Diligence
|
Attachment 12
|
|
HBRIC
Ltd Letter and Scope of Due Diligence
|
Attachment 12
|
|
HBRC
2014-15 Annual Plan - Part 1 Introduction
|
Attachment 2
|
Contents
Chairman and Chief Executive’s Comments........................................ 1
Financial Changes to
the Long Term Plan............................................. 6
Financial Overview............................................................... 6
Rates Comparisons............................................................. 10
Financial Comparatives....................................................... 15
Amendments to the Long
Term Plan (LTP) 2012-22............................ 20
Non Financial Changes
to the LTP...................................................... 21
Your Councillors............................................................................... 22
|
HBRC
2014-15 Annual Plan - Part 1 Introduction
|
Attachment 2
|
Chairman
and Chief Executive’s Comments


Fenton
Wilson
Liz
Lambert
Chairman
Interim
Chief Executive
We’re now approaching the final three-year phase of the Long
Term Plan developed in 2012 and we’re comfortable with the progress being
made, delivering against key initiatives set out for this decade.
As
we move into the 2014-15 Annual Plan, Hawke’s Bay Regional Council has
started a strategic planning process for the 2015 – 2025 Long Term Plan,
to which councillors, numerous sector groups, community groups and individuals
will no doubt contribute.
Let’s
be clear, HBRC is in the business of:
· Natural resource knowledge and management;
· Natural hazard assessment and management;
· Regional strategic planning (including provision of statutory
plans such as the regional policy statement); and
· The provision and assessment of regional scale infrastructure and
services, notably flood risk assets, regional logistics facilities such as
Napier Port, and water storage.
In this Annual
Plan, we identify areas that differ significantly from those laid out in the
current Long Term Plan or previous Annual Plan.
Please take a
moment to read this introduction and the parts of this Annual Plan which relate
to you.
Year
Three of the Long Term Plan
We are progressing in a number of areas based on our
Long Term Plan or LTP, which include, but are not limited to:
· Catchment based planning – The Tukituki Catchment Plan Change sits alongside the
Ruataniwha Water Storage (RWS) scheme and is our best option to improve summer
flows and water quality, enhance water security for users and provide for
sustainable economic development. We want to maintain or enhance aquatic
habitats, maintain safe contact recreation and reduce the effects of algae and
slime for recreational users. Following the Government’s
Environmental Protection Authority process, guidance on policies and new limits
will be finalised by June 2014.
· Science-informed land management - A pilot project working with farmers in the Papanui
sub-catchment of the Tukituki has been established with positive community
buy-in. An ideal outcome of this project will be the use of advice,
information, nutrient management plans, riparian planting, etc, to reduce
nutrients entering the catchment. If successful, this pilot programme
will be extended to other water use areas.
· Ruataniwha Water Storage (RWS) – The RWS is a key part of the Tukituki Catchment Proposal
that is designed to provide greater environmental protection for fresh water in
the catchment, and provide opportunities for economic growth. The RWS has
gained resource consent approvals from the Environmental Protection Authority,
however the workability of these consents is still being determined at the time
of this plan being finalised. If the consents are not workable and the scheme
is not built, HBRC will need to closely manage the subsequent reductions for
existing water takes.
· Air Quality/
HeatSmart
-
2014 is a phase-out year for non-compliant fires installed before 1996 in urban
areas. As anticipated, the demand for clean heat and insulation support
has increased and the programme continues to perform above the targets set to
meet national emission standards by 2020.
· Passenger Transport
– The urban passenger bus service continues to grow in popularity and
reflects the significant investment made by HBRC on behalf of the communities
of Napier and Hastings. Total passenger trips reached another record high of
789,277 in 2013; an increase of 8.7% on 2012. During
2013 more than 3,000 bikes were carried free-of-charge on the goBay network.
· Biodiversity – The
Biodiversity Strategy is developing under the guidance of a Steering Group
which includes representatives from the broader community. An Accord is
being drafted to allow agencies, businesses and individuals to ‘sign
up’ and commit to the strategy’s outcomes. The detail of an
entity to deliver the Strategy into the future is also under design. HBRC
expects to conclude the Strategy in mid 2015.
· Regional Parks Network Plan – The move to recognise HBRC open spaces as Regional Parks
was adopted by Council in November 2013. This plan also recognises a
consistent management approach for Hawke’s Bay Trails.
· Napier Leasehold Land – HBRC has negotiated a financial agreement with the
Accident Compensation Corporation (ACC) which transfers rental income
associated with the leasehold land it owns in Napier to ACC for a period of 50
years. In exchange, HBRC received an upfront cash payment while retaining
ownership of the properties. There is no change for the lessees or to the
lease conditions under this arrangement. The initiative was outlined in
HBRC’s LTP 2012-22 and is part of Council’s long term strategy to
free up capital that will allow us to invest in significant infrastructure
projects that create jobs and benefit the Hawke’s Bay natural
environment.
There
are some areas under this Annual Plan where HBRC is altering our programme
to accommodate changes in factors since our Long Term Plan decisions.
These changes are summarised as:
· Hill Country Afforestation – HBRC is assessing high UMF (Unique Manuka Factor) Manuka
as a soil conservation method on steep, erodible land and has planted 140 ha in
Tūtira Regional Park. The growth and performance of this new option
is being closely monitored.
· Ngaruroro Water Storage - The feasibility stage for Ngaruroro Water Storage
investigations will commence in 2014-15, having focused resources on completion
of the Ruataniwha Water Storage process.
· Hydraulic Fracturing
– The Parliamentary Commissioner for the Environment has released her
second report on hydraulic fracturing. In response to her recommendations HBRC
is proposing to make financial provision to consult with the public and prepare a Plan Change addressing oil
and gas development, including the management of fracking.
· Identification of Outstanding Freshwater Bodies – The National Policy Statement (2011) for Freshwater
Management requires the protection of Outstanding Freshwater Bodies. This is
detailed in the Implementation Plan adopted in September 2012. A collaborative
process is has been proposed.
No
other ‘right debate’ changes are planned other than what we set out
and adopted in the 2012-22 Long Term Plan.
Rating
Council’s rating
programme funds the expenditure for its Groups of Activities set out in Part 2
of this Plan. Due to the continuing recessionary climate in 2013-14, a 4%
total rate rise forecast in the Long Term Plan was cut back to 2.8%.
For the 2014-15 year
Council reduced expenditure by $174,000 from what was indicated in the Long
Term Plan by cutting overheads and external costs. However, to maintain
the delivery of our current services – and bearing in mind lower than
expected market interest rate returns which offset rating charges – a
rate increase of 5.8% has been set for the 2014-15 year.
In
dollar terms the total annual rates are expected to rise:
· Between
$5 - $11 per property in urban areas, depending on the mix of rates on
those properties;
· Between
$12 - $15 per rural property with a capital value under $500,000, and
over $100 per property with a capital value over $3,000,000 depending on the mix
of rates on those properties.
Napier Gisborne Railway – Proposal
HBRC’s
ongoing investment strategy is to improve financial, economic and environmental
benefits for the whole region by investing in sound regional infrastructure
assets.
One potential infrastructure investment is the
re-establishment of the Napier-Gisborne rail line as a viable alternative to
the transport of freight by road. HBRC, in conjunction with private sector
partners, has considered investing in the operation of a rail business carrying
freight on the line. A critical component of any such investment is the
agreement by KiwiRail and the Government to reopen the rail line and for them
to fully fund its return and that of associated infrastructure in a good
‘fit for purpose’ condition.
The
proposal from the Napier Gisborne Rail Establishment Group (NGR) aimed to:
· Establish
and operate a rail freight service between Napier and Gisborne on the existing
rail line once it was returned to full operational status by the Government and
KiwiRail;
· Lease
locomotives and the line from KiwiRail, purchase appropriate rolling stock from
KiwiRail, or elsewhere, to operate the service;
· Carry
freight, largely logs, fruit and vegetable produce;
· Anticipate
financial losses in the first three years of operation, returning to profit in
year 4 and generating significant returns to shareholders as log volumes
increased – anticipated in year 6, and
· See
HBRC become a 51% shareholder in the venture, with businesses and investors in
Hawke’s Bay and Gisborne District holding the remaining 49% of shares in
the operating company set up for this purpose.
The
proposal has claimed to benefit Hawke’s Bay with social, economic, and
employment gains; improve transport infrastructure with price competitiveness
and efficiency over road and rail land transport modes; safety and cost
benefits through reduced heavy traffic on SH2 between Gisborne and Napier;
increase volumes of exports through Napier Port; and secure an alternative
transport route to road in the event of a disaster.
The
NGR Group has estimated that investor funding to finance capital and operating
budgets of $10.7million will comprise:
Purchase
of rolling stock, plant, equipment etc $
5.3m
Working
capital $
2.4m
Disaster
Contingency Reserve $
3.0m
----------
Total Investor Funds Required $10.7m
A 51% shareholding investment from HBRC would be
approximately $5.46m of the Total Investor Funds required over the 2014-15 to
2018-19 financial years. An initial investment of $3.9million would be
required from HBRC for the 2014-15 year.
HBRC
investment in the NGR is conditional on:
· The
Government and/or KiwiRail fully funding the return of the rail line and
associated infrastructure to a “good fit for purpose” operating
condition;
· Leases
of the line and locomotives from KiwiRail on terms satisfactory to NGR
· Suitable
offtake agreements being concluded between NGR and customers for the freight of
logs, fruit and vegetable produce over the period up to and beyond 2020 to
ensure the long term viability of the service;
· NGR’s
business case being tested and accepted as satisfactory, and
· The
return to HBRC over the long-term is to cover Council’s cost of funding.
HBRC
investor funds would initially be sourced from investment reserves, but
ultimately would require refinancing from HBRC’s borrowing programme.
In
excess of 100 submissions were received on the Napier/Gisborne Railway proposal
and, while 70% were supportive of Council’s continued
involvement/investment in a Napier to Gisborne rail link, 15% were
opposed to any future Council involvement with the remaining 15% of submitters
recommending that Council investigate alternative uses for the rail corridor,
specifically tourism related uses.
In
response to these submissions Council resolved to retain in principle, the
investing in the restoration of the Napier/Gisborne rail line, and indicated it
would consider a revised proposal and business case from the NGR establishment
group, such a business case would be subject to independent peer review before
Council considered investment in the line. Council further resolved that it
would be prepared to participate in a feasibility study on the best use of the
Napier/Gisborne rail corridor going forward.
Investments Proposed in the LTP 2012-22
The
Hawke’s Bay Regional Council determined in the LTP that investment
capital would be used for long term investment, mainly in infrastructure assets
to further build the region’s economic base, enhance the performance of
the regional supply chain, or specifically increase production in rural-based
industries where it is believed Hawke’s Bay has its greatest economic
potential.
These
investments will also deliver environmental benefits and, in the medium term,
will provide HBRC with a reasonable rate of return on funds invested. The
investment opportunities set out in the LTP are:
Investments managed through the Hawke’s Bay Regional
Investment Company (HBRIC Ltd)
Ruataniwha Water Scheme (RWS)
Should the
required conditions precedent be met, it is expected that HBRC will maintain
its proposed equity stake at up to $80 million, as stated in HBRC’s Long
Term Plan. Following the receipt of a recommendation from HBRIC Ltd on 26
March 2014 and public input via a Special Consultative Process during May and
early June 2014, HBRC will decide whether or not to commit to this investment.
[this will be updated prior to going to print].
The investment
is subject to a sustainable investment and funding model being approved by HBRC
and the uptake to purchase water by the farming community being at a level that
ensures a viable business case.
If these
criteria are met this plan provides for an advance of $22.2m to HBRIC Ltd in
the 2014-15 financial year for investment in the RWS. The funding will be
sourced from HBRC’s reserves held for investment. This plan also
assumes that there would be additional dividend cash flows received from HBRIC
Ltd to cover the interest that would have been received by HBRC if current
investments in bank deposits were maintained.
Ngaruroro Water Scheme (NWS)
The LTP proposed to invest
$27m in an equity stake in NWS, however, the development of this scheme to a
full feasibility stage has been delayed in order to ensure that the emphasis in
planning is focussed on RWS. It is proposed that in the 2014-15 year an initial
on-farm economic assessment of the storage option be completed prior to
committing to a full feasibility study, also potentially programmed to commence
in the 2014-15 year.
Whakatu Road/ Rail Hub
The proposal
for further investment in the supply chain – at an appropriate time
– helps to secure the future of Napier Port as it increasingly competes
with others drawing cargo from the central and southern North Island. However,
the timing of this proposal has been reassessed and HBRC is not considering
contributing capital to this project in 2014-15.
Investments Managed by HBRC
Hill
Country Afforestation
The LTP
proposed to fund the establishment of forestry blocks on erodible hill country
land. This investment requires a risk management approach covering carbon
price, carbon trading mechanisms and a robust operational plan. At the
time of writing this plan, the carbon price is approximately $3 per tonne, in
comparison to the $20 per tonne that drove the viable business case forward
during the development of the 2012-2025 LTP. Accordingly, it is not
proposed to proceed with this investment during the 2014-15 Annual Plan
period.
HBRC will
continue to evaluate forestry plantings in subsequent years. However the
decision to proceed will be conditional upon strengthening carbon prices or the
availability of alternative funding sources. HBRC plans to proceed with
this investment as soon as practicable as it considers this project to be an
important means to achieve environmental benefits.
The
investments proposed above, specifically the RWS, will provide medium to long
term significant growth and value which will, over the period of the LTP,
substantially increase the value of both the HBRIC Ltd and HBRC balance sheets.
Funding Strategy for Investments as
Outlined in the LTP 2012-22
At the start of the 2014-15 Annual Plan period, we estimate that
HBRC has available funds of $72m to fund proposed investments. This has
been achieved by HBRC’s strategy to sell-down low-performing investment
assets, specifically our investment in Napier leasehold land, thus freeing up
funding for investments in projects that will provide financial and economic
gain for the region.
In July 2011
HBRC approved significant discounts on the purchase price of leasehold property
for lessees who wished to freehold. This initiative was strongly
supported by lessees and resulted in 378 lessees taking the opportunity to
freehold at the discounted prices. HBRC has received $27.4m from these
sales.
As forecast in
the LTP, the cash flows generated from the remaining portfolio of Napier
leasehold properties have been sold to the Accident Compensation Corporation
and a sum of $37m has been realised for investment. The LTP also proposed that
HBRC’s investment in leasehold property in Wellington be sold, however
this is on hold given the high level of return being achieved on this
investment.
Other Changes
It is not
possible to do justice to all of HBRC’s work in this brief introduction
– we continue to carry out important operational activities to ensure
that public services, infrastructure, and regulation are delivered efficiently
and effectively. Changes to these operational activities can be found in Part
2 of this Plan, while Part 3 of this Plan identifies changes to our
charges for resource management activities.
Last Words
We continue to
focus on our relationships in the region and with our national partners –
at a one-to-one through to a collaborative and strategic level – and
encourage your ongoing interaction with HBRC through face-to-face contact,
phone calls, meetings, our newsletters, website and social media channels.


Liz Lambert, Interim Chief
Executive
Fenton Wilson, Chairman
|
HBRC
2014-15 Annual Plan - Part 1 Introduction
|
Attachment 2
|
Financial
Overview
Annual Plan in Brief
What we will do in 2014-15
The 2014-15
Annual Plan has been prepared using the 2012-22 LTP as its base.
Details of the
HBRC’s work programmes are contained within the “Groups of
Activities” Part 2 of this Plan.
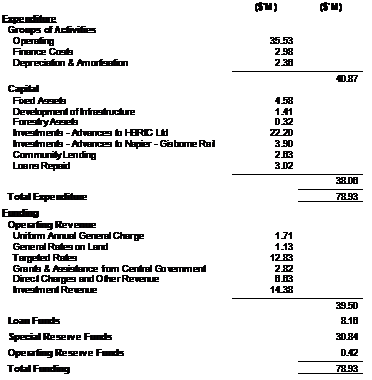
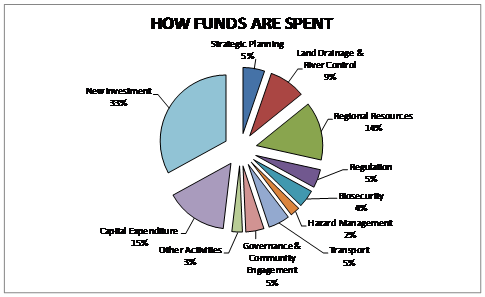
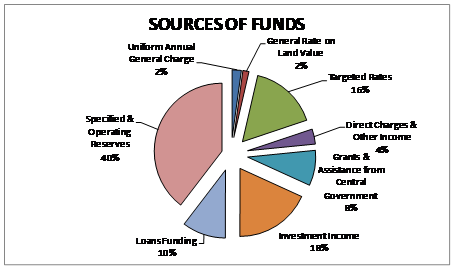
HBRC intends
to spend $78.93 million in 2014-15. This expenditure consists of:
Annual Plan
Highlights
This Plan
forecasts a $423,000 deficit compared with a $127,000 surplus estimated in the
LTP for the 2014-15 financial year. This includes carried forward items
from the 2013-14 year of $400,000.
The total
2014-15 increase in rates of 3.9%, as proposed in the LTP, is now proposed to
be 5.9%.
This increase
consists of:
· 5.6% increase as a necessity to restore rates to LTP levels after
a 1.3% reduction in the increase of rates in the 2013-14 year.
· 0.1% increase for the proposed targeted rates for the Opoho flood
and drainage scheme (3 ratepayers).
· 0.2% increase for extra economic development of Wairoa primary
sector opportunities and Oil and Gas Multi Stakeholder group initiatives.
There have
been some significant changes to revenue assumptions from those used in the LTP
which have affected HBRC income streams. Briefly, these are:
· Interest - the LTP
assumed an interest rate of 5.75% on investment income for the 2014-15
year. Due to the slow increase in the Official Cash Rate (OCR) HBRC has
revised this figure to 5.1%. This drop in interest rates combined with
large investment balances has seen a sizable drop in interest revenue.
· Returns on investments – the LTP assumed returns on investment activities for the
Ruataniwha Water Scheme (RWS), Ngaruroro Water Scheme (NWS), Whakatu Road/ Rail
Hub and Hill Country Afforestation. There have been some changes to the
timing and level of returns in these investments.
· Napier leasehold free-holding and rentals - HBRC approved the free-holding to lessees of Napier leasehold
land at a discount to provide funds for other investments. This programme
of sell down exceeded LTP expectations and there have also been an increased
number of freeholdings even after the discount expired. This has had the
effect of there being fewer Napier leasehold properties owned by HBRC than
estimated in the LTP.
· Wellington leasehold land - The LTP also assumed the sale of the Wellington leasehold land
owned by HBRC. This has not yet taken place due to the good returns
received from these investments compared to market interest rates.
· Forestry Income - The LTP
proposed to fund the establishment of forestry blocks on erodible hill country
land and assumed a carbon price of $20 per tonne to justify a viable
business. Carbon prices are now much lower than expected and HBRC has
resolved not to proceed with the forestry investment during 2014-15.
· Subvention payments - The
LTP assumed a number of targeted assistance grants would be paid over the first
three years of the LTP. There were a number of delays in finalising the
projects that qualified for targeted assistance. Accordingly the majority
of the proposed grants will be paid out during the 2013-14 financial
year. This will give rise to a substantial increase in the subvention
payments during 2014-15 which were offset by a substantial decrease in 2013-14.
· Dividends - The dividends
received from Napier Port via HBRIC have been increased by the payment of a
special dividend to cover reduced returns on other investments.
· Napier - Gisborne
Rail – HBRC has proposed to invest $3.9 million in the
Napier-Gisborne Rail project with a proposed return reflecting Council’s
cost of funding. This project was not included in the LTP.
Other
highlights include:
· The LTP allowed for HBRC to provide the Bovine TB Vector Control
programmes on behalf of the Animal Health Board; however from 1 July 2013 the Animal
Health Board will be undertaking these programmes themselves.
· HBRC agreed to proceed with the remedial work on the Dalton Street
building. There was $1 million provided for in the LTP for this project but
after detailed analysis this cost estimate increased to $2 million. Work was
completed in the 2013-14 year and was funded from a combination of internal and
external loans. The legal proceedings against the contractors are ongoing
with compensation used to reduce those borrowings.
· The Clean Heat Scheme has been a huge success with good
participation from the public. The LTP assumed that homeowners would take
up the clean heat loans rather than the clean heat grants. This has
turned out to be the opposite, which means that HBRC has borrowed less to fund
these loans than initially anticipated.
Analysis of
Total Expenditure and Funding
Assets and Liabilities
HBRC has a
strong balance sheet with assets greatly exceeding liabilities.
As at 30 June
2015 infrastructure assets are projected to total $160 million however, because
of the nature of these assets (e.g. stopbanks), there are restrictions on their
use and saleability.
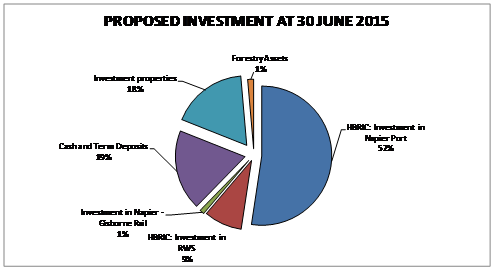
HRBC also
holds significant investments estimated to be $359 million at 30 June
2015. Included in these investments is HBRC’s investment in HBRIC
Ltd, made up of:
· Napier Port ($187.9 million)
· Ruataniwha Water Scheme ($31.6 million)
HBRC also has:
· Cash balances on deposit awaiting payment to HBRIC Ltd for
HBRC’s investment initiatives – the amount estimated to be held on
deposit for these purposes is $41 million at 30 June 2015.
· $51 million of Napier Leasehold endowment land and $12 million of
Wellington Leasehold property.
· $3.9 million proposed to be invested in the Napier –
Gisborne Rail project.
· $4.9 million of Forestry investments.
The chart
below shows analysis of the investments projected to total $359 million at
30 June 2015.
HBRC has a
policy of raising loans to fund certain types of capital expenditure such as
the construction of river control and flood protection assets. These
loans are taken out on behalf of certain river control and flood protection
scheme ratepayers and will be fully repaid by them during the period covered by
the term of the loan.
Loan funding
achieves intergenerational equity by ensuring that a portion of the cost of the
major projects is paid for by the beneficiaries of the service over the year to
which the benefit applies.
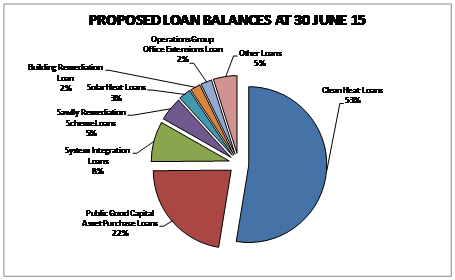
In this plan
the HBRC proposes to borrow up to $8.2 million in the 2014-15 financial year.
Of that sum, $4.5 million will fund advances to homeowners who require
assistance to insulate and provide clean heat to their homes, $0.6 million to
fund advances to homeowners who want to establish solar water heating in their
homes; $1.7 million for public good capital projects; $0.6 million for
Operations Group and Wairoa office extensions; and $0.7 million for computer
system integration. These amounts include $2.3 million of loans included
in the 2013-14 Annual Plan that were not drawn down and have been carried
forward to the 2014-15 year.
The Annual
Plan estimate is that at 30 June 2015 external loans outstanding will be
$24.9 million. An analysis of these loans is shown in the chart
below.
Additional liability related to funding of HBRC investments
The cash flows
for a period of 50 years ending 30 June 2063 generated from the portfolio of
Napier leasehold properties (after the free-holding initiative to lessees) were
sold to secure a lump sum payment from the Accident Compensation Corporation
(ACC) of $37 million which was included in the financial assets to be used to
fund investment activity.
·
|
HBRC
2014-15 Annual Plan - Part 1 Introduction
|
Attachment 2
|
Rates
Comparison

|
HBRC
2014-15 Annual Plan - Part 1 Introduction
|
Attachment 2
|
Comparison of Rural Rates in Three Districts
|
Comparison of Rural Rates on Specific Properties in Three
Districts
|
|
Description of rates
|
Rating Basis
|
Central
Hawke’s Bay
|
Hastings
|
Wairoa
|
|
|
2013-14
|
2014-15
|
2013-14
|
2014-15
|
2013-14
|
2014-15
|
|
Details for comparison
|
|
Capital Value ($)
|
CV
|
2,025,000
|
2,025,000
|
2,889,000
|
2,890,000
|
470,000
|
470,000
|
|
Land Value ($)
|
LV
|
1,570,000
|
1,570,000
|
2,305,000
|
2,310.000
|
370,000
|
370,000
|
|
Area (Hectares)
|
Area
|
276.3567
|
276.3567
|
610.8591
|
610.8591
|
32.9742
|
32.9742
|
|
|
|
|
|
|
|
|
|
Rates ($)
|
|
|
|
|
|
|
|
|
General Rate
|
LV
|
119.95
|
137.69
|
163.66
|
193.81
|
28.30
|
31.38
|
|
UAGC Fixed Amount
|
Fixed
|
25.54
|
28.41
|
25.54
|
28.41
|
25.54
|
28.41
|
|
General Funded Rates ($)
|
|
145.49
|
166.10
|
189.20
|
222.22
|
53.84
|
59.79
|
|
|
|
|
|
|
|
|
|
HPFCS F2 Indirect
|
CV
|
|
|
78.29
|
82.36
|
|
|
|
Central Stream/Drains
|
CV
|
19.01
|
18.32
|
24.55
|
25.40
|
|
|
|
Plant Pest
|
Area
|
121.23
|
126.07
|
267.98
|
278.67
|
14.47
|
15.04
|
|
Animal Pest Rate
|
Area
|
399.22
|
413.90
|
882.45
|
914.88
|
47.63
|
49.39
|
|
Bovine TB
|
Area
|
158.40
|
163.96
|
350.14
|
362.42
|
18.90
|
19.56
|
|
Wairoa River
|
CV
|
|
|
|
|
46.63
|
48.93
|
|
Upper Tukituki River
|
LV
|
97.61
|
102.52
|
|
|
|
|
|
Economic Development
|
Fixed
|
16.64
|
17.53
|
16.64
|
17.53
|
13.00
|
14.00
|
|
Emergency Management
|
Fixed
|
14.63
|
14.84
|
14.63
|
14.84
|
14.63
|
14.84
|
|
Targeted Rate ($)
|
|
826.74
|
857.14
|
1634.68
|
1696.10
|
155.26
|
161.76
|
|
|
|
|
|
|
|
|
|
Total Rates ($)
|
|
972.23
|
1023.24
|
1823.88
|
1918.32
|
209.10
|
221.55
|
|
|
|
|
|
|
|
|
|
Dollar Increase
|
|
|
51.01
|
|
94.44
|
|
12.45
|
|
Percentage Increase
|
|
|
5.25%
|
|
5.18%
|
|
5.95%
|
Comparison of Rates on Specific Urban Properties
|
Comparison of Rates on Specific Urban Properties
|
|
Description of rates
|
Rating Basis
|
Napier
Hill
|
Napier
South
|
Flaxmere
|
Havelock
North
|
|
2013-14
|
2014-15
|
2013-14
|
2014-15
|
2013-14
|
2014-15
|
2013-14
|
2014-15
|
|
Details for comparison
|
|
Capital Value ($)
|
CV
|
680,000
|
680,000
|
225,000
|
225,000
|
175,000
|
170,000
|
660,000
|
660,000
|
|
Land Value ($)
|
LV
|
220,000
|
220,000
|
147,000
|
147,000
|
67,000
|
64,000
|
255,000
|
255,000
|
|
Area (Hectares)
|
Area
|
0.0745
|
0.0745
|
0.0668
|
0.0668
|
0.0607
|
0.0607
|
0.0777
|
0.0777
|
|
|
General Rate
|
LV
|
15.73
|
18.15
|
10.51
|
12.13
|
4.76
|
5.37
|
18.11
|
21.39
|
|
UAGC Fixed Amount
|
Fixed
|
25.54
|
28.41
|
25.54
|
28.41
|
25.54
|
28.41
|
25.54
|
28.41
|
|
General Funded Rates ($)
|
|
41.27
|
46.56
|
36.05
|
40.54
|
30.30
|
33.78
|
43.65
|
49.80
|
|
HPFCS F1Direct
|
CV
|
|
|
24.38
|
26.17
|
19.36
|
19.87
|
|
|
|
HPFCS F2 Indirect
|
CV
|
18.90
|
19.31
|
5.98
|
6.39
|
4.74
|
4.85
|
17.90
|
18.81
|
|
HPFCS Drainage
|
LV
|
|
|
39.20
|
41.17
|
23.21
|
23.46
|
|
|
|
Public Transport
|
LV
|
57.31
|
57.90
|
38.29
|
38.69
|
17.33
|
17.14
|
66.97
|
68.28
|
|
Central Stream/Drains
|
CV
|
5.92
|
5.95
|
1.87
|
1.97
|
1.49
|
1.49
|
5.61
|
5.80
|
|
Karamu Maintenance
|
Fixed
|
|
|
|
|
|
|
10.00
|
10.55
|
|
Karamu Enhancement
|
Fixed
|
|
|
|
|
|
|
9.39
|
9.86
|
|
Clean Heat/Healthy Homes
|
LV
|
19.51
|
18.90
|
13.04
|
12.63
|
5.79
|
5.59
|
22.02
|
22.28
|
|
Economic Development
|
Fixed
|
16.64
|
17.53
|
16.64
|
17.53
|
16.64
|
17.53
|
16.64
|
17.53
|
|
Emergency Management
|
Fixed
|
14.63
|
14.84
|
14.63
|
14.84
|
14.63
|
14.84
|
14.63
|
14.84
|
|
Targeted Rates ($)
|
|
132.91
|
134.43
|
154.03
|
159.39
|
103.19
|
104.77
|
163.16
|
167.95
|
|
|
|
|
|
|
|
|
|
|
|
Total Rates ($)
|
|
174.18
|
180.99
|
190.08
|
199.93
|
133.49
|
138.55
|
206.81
|
217.75
|
|
|
|
|
|
|
|
|
|
|
|
Dollar Increase
|
|
|
6.81
|
|
9.85
|
|
5.06
|
|
10.94
|
|
Percentage Increase 1
|
|
|
3.91%
|
|
5.18%
|
|
3.79%
|
|
5.29%
|
Comparison of Rates on Specific Urban Properties
|
Comparison of Rates on Specific Urban Properties
|
|
Description of rates
|
Rating Basis
|
Taradale
|
Hastings
|
Wairoa
|
Central
HB
|
|
2013-14
|
2014-15
|
2013-14
|
2014-15
|
2013-14
|
2014-15
|
2013-14
|
2014-15
|
|
Details for comparison
|
|
Capital Value ($)
|
CV
|
415,000
|
415,000
|
390,000
|
390,000
|
230,000
|
230,000
|
300,000
|
300,000
|
|
Land Value ($)
|
LV
|
220,000
|
220,000
|
160,000
|
160,000
|
63,000
|
63,000
|
120,000
|
120,000
|
|
Area (Hectares)
|
Area
|
0.1105
|
0.1105
|
0.1012
|
0.1012
|
0.1213
|
0.1213
|
0.1495
|
0.1495
|
|
|
General Rate
|
LV
|
15.75
|
18.15
|
11.36
|
13.42
|
4.83
|
5.34
|
9.18
|
10.52
|
|
UAGC Fixed Amount
|
Fixed
|
25.54
|
28.41
|
25.54
|
28.41
|
25.54
|
28.41
|
25.54
|
28.41
|
|
General Funded Rates ($)
|
|
41.29
|
46.56
|
36.90
|
41.83
|
30.37
|
33.75
|
34.72
|
38.93
|
|
HPFCS F1Direct
|
CV
|
47.06
|
48.26
|
43.13
|
45.59
|
|
|
|
|
|
HPFCS F2 Indirect
|
CV
|
11.54
|
11.79
|
10.56
|
11.11
|
|
|
|
|
|
HPFCS Drainage
|
LV
|
|
|
59.45
|
58.57
|
|
|
|
|
|
Public Transport
|
LV
|
57.31
|
57.90
|
41.39
|
42.84
|
|
|
|
|
|
Central Stream/Drains
|
CV
|
3.61
|
3.63
|
3.31
|
3.42
|
|
|
2.67
|
2.72
|
|
Wairoa Rivers/Streams
|
CV
|
|
|
|
|
22.77
|
23.94
|
|
|
|
U.T.T.F.C.S.
|
LV
|
|
|
|
|
|
|
7.45
|
7.83
|
|
Clean Heat/Healthy Homes
|
LV
|
19.14
|
18.90
|
13.82
|
13.98
|
|
|
|
|
|
Economic Development
|
Fixed
|
16.64
|
17.53
|
16.64
|
17.53
|
13.00
|
14.00
|
16.64
|
17.53
|
|
Emergency Management
|
Fixed
|
14.63
|
14.84
|
14.63
|
14.84
|
14.63
|
14.84
|
14.63
|
14.84
|
|
Targeted Rates ($)
|
|
169.93
|
172.85
|
202.93
|
207.88
|
50.40
|
52.78
|
41.39
|
42.92
|
|
|
|
|
|
|
|
|
|
|
|
Total Rates ($)
|
|
211.22
|
219.41
|
239.83
|
249.71
|
80.77
|
86.53
|
76.11
|
81.85
|
|
|
|
|
|
|
|
|
|
|
|
Dollar Increase
|
|
|
8.19
|
|
9.88
|
|
5.76
|
|
5.74
|
|
Percentage Increase 1
|
|
|
3.88%
|
|
4.12%
|
|
7.13%
|
|
7.54%
|
Comparison of Rates on Specific Commercial Properties
|
Comparison of Rates on Specific Commercial Properties
|
|
Description of rates
|
Rating Basis
|
Napier
Hotel
|
Emerson
St Napier
|
Hastings
Shops
|
Hastings
Motel
|
Waipukurau
Office
|
Wairoa
Shops
|
|
2013-14
|
2014-15
|
2013-14
|
2014-15
|
2013-14
|
2014-15
|
2013-14
|
2014-15
|
2013-14
|
2014-15
|
2013-14
|
2014-15
|
|
Details for Comparison
|
|
Capital Value ($)
|
CV
|
3,250,000
|
3,250,000
|
1,475,000
|
1,475,000
|
1,000,000
|
970,000
|
910,000
|
910,000
|
205,000
|
205,000
|
255,000
|
255,000
|
|
Land Value ($)
|
LV
|
1,875,000
|
1,875,000
|
420,000
|
420,000
|
385,000
|
385,000
|
670,000
|
670,000
|
40,000
|
40,000
|
50,000
|
50,000
|
|
Area (Hectares)
|
Area
|
0.3025
|
0.3025
|
0.0506
|
0.0506
|
0.1097
|
0.1097
|
0.3254
|
0.3254
|
0.0717
|
0.0717
|
0.2022
|
0.2022
|
|
|
|
|
|
|
|
|
|
|
|
|
|
|
|
|
General Rate
|
LV
|
134.06
|
154.69
|
30.03
|
34.65
|
27.33
|
32.30
|
47.57
|
56.21
|
3.06
|
3.51
|
3.82
|
4.24
|
|
UAGC Fixed Amount
|
Fixed
|
25.54
|
28.41
|
25.54
|
28.41
|
25.54
|
28.41
|
25.54
|
28.41
|
25.54
|
28.41
|
25.54
|
28.41
|
|
|
|
|
|
|
|
|
|
|
|
|
|
|
|
|
General Funded Rates
|
|
159.60
|
183.10
|
55.57
|
63.06
|
52.87
|
60.71
|
73.11
|
84.62
|
28.60
|
31.92
|
29.36
|
32.65
|
|
|
|
|
|
|
|
|
|
|
|
|
|
|
|
HPFCS F1Direct
|
CV
|
|
|
167.27
|
171.54
|
110.60
|
113.39
|
100.65
|
106.38
|
|
|
|
|
|
HPFCS F2 Indirect
|
CV
|
90.35
|
92.30
|
41.00
|
41.89
|
27.10
|
27.65
|
24.66
|
25.94
|
|
|
|
|
|
HPFCS Drainage
|
LV
|
|
|
|
|
133.36
|
141.10
|
232.09
|
245.55
|
|
|
|
|
|
Public Transport
|
LV
|
488.44
|
493.50
|
109.41
|
110.54
|
99.60
|
103.10
|
173.33
|
179.43
|
|
|
|
|
|
Central Stream/Drains
|
CV
|
27.63
|
28.44
|
12.84
|
12.90
|
8.50
|
8.53
|
7.74
|
8.00
|
1.80
|
1.86
|
|
|
|
Clean Heat/Healthy Homes
|
LV
|
166.31
|
161.06
|
36.54
|
36.07
|
33.26
|
33.64
|
57.89
|
58.56
|
|
|
|
|
|
Economic Development
|
CV
|
411.77
|
425.10
|
186.88
|
192.93
|
125.90
|
127.55
|
114.57
|
119.67
|
27.76
|
27.74
|
41.72
|
40.60
|
|
Upper Tukituki Scheme
|
LV
|
|
|
|
|
|
|
|
|
2.48
|
2.61
|
|
|
|
Wairoa River Scheme
|
CV
|
|
|
|
|
|
|
|
|
|
|
25.25
|
26.55
|
|
Emergency Management
|
Fixed
|
14.63
|
14.84
|
14.63
|
14.84
|
14.63
|
14.84
|
14.63
|
14.84
|
14.63
|
14.84
|
14.63
|
14.84
|
|
Targeted Rates ($)
|
|
1199.13
|
1215.24
|
568.57
|
580.71
|
552.95
|
569.80
|
725.56
|
758.37
|
46.67
|
47.05
|
81.60
|
81.99
|
|
|
|
|
|
|
|
|
|
|
|
|
|
|
|
Total Rates ($)
|
|
1358.73
|
1398.34
|
624.14
|
643.77
|
605.82
|
630.51
|
798.67
|
842.99
|
75.27
|
78.97
|
110.96
|
114.64
|
|
|
|
|
|
|
|
|
|
|
|
|
|
|
|
Dollar Increase
|
|
|
39.61
|
|
19.63
|
|
24.69
|
|
44.32
|
|
3.70
|
|
3.68
|
|
Percentage Increase 2
|
|
|
2.92%
|
|
3.15%
|
|
4.08%
|
|
5.55%
|
|
4.92%
|
|
3.32%
|
|
HBRC
2014-15 Annual Plan - Part 1 Introduction
|
Attachment 2
|
Financial Comparatives between Year 3 of the Long Term Plan
(LTP) 2012-22 and Annual Plan 2014-15
Explanatory
Notes of Changes between Year 3 of the LTP 2012-22 and Annual Plan 2014-15
Significant variations
between the 2012-22 LTP and the 2014-15 Annual Plan are outlined below.
Prospective
Comprehensive Income Statement (Part 3, Pg 16)
Revenue from
activities (Note 1, Part 3, Pg 20)
The LTP
assumed that the Bovine TB Regional Vector Control Programmes for the Animal
Health Board (AHB) would continue to be delivered by HBRC Biosecurity staff
undertaking the work. Subsequent to the compilation of the LTP a decision was
made by the AHB that they would assume responsibility for running the Bovine TB
Regional Vector Control Programmes from 1 July 2013. Accordingly the
costs associated with this programme have been reduced from Hawke’s Bay
Regional Council (HBRC) expenditure along with the revenue received from the
AHB in relation to this service.
Revenue from
rates (Note 2, Part 3, Pg 21)
Overall, rates
(excluding GST) proposed for the first 3 years of the LTP, up to 30 June 2015
are $15,665,000 against $15,563,000 proposed in the LTP. This is an
increase of 0.66% from the LTP rating level. This includes the increases
in targeted rates for the Makara and Opoho schemes:
· Makara Scheme: In May 2012
it was identified that there was a sinkhole in the dam protecting the Makara
Valley. In order to reinstate the level of protection provided by the dam it
was proposed to repair the dam at an estimated cost of $1,200,000. This was to
be funded through use of the HBRC’s regional disaster reserve, scheme
disaster reserves, scheme depreciation reserves and an external loan of
$220,000. In order to fund this external loan and increased maintenance a
rate increase of approximately $52,000 was proposed for the 2013-14 year. This
has been continued in the 2014-15 year with the effect of increasing the
targeted rates for this scheme from $32,416 in the LTP to $86,237.
· Opoho Scheme: Its
management had previously been administered through direct billing for actual
work. To give certainty of the amount to be charged to the land owners it
is proposed to introduce a flood and drainage scheme into the targeted rate
programme in the 2014-15 Annual Plan. This has the effect of increasing
the targeted rates by $18,328. This scheme affects three landowners.
(refer to Amendments to Long Term Plan (LTP) 2012-22, Part 1, Pg 19).
Revenue from
grants (Part 3, Pg 16)
Grants income
is forecast to be $494,000 less in the Annual Plan than in the LTP. The
major change is in the calculation of funding from the New Zealand Transport
Association (NZTA) for the Regional Land Transport Strategy projects.
Other revenue (Note 3, Part 3, Pg 21)
There are a
number of revenue streams under “Other Revenue”. The
movements in each are shown below.
Dividends (+$963,000)
The LTP
forecast to receive $6.6 million in dividends from the Hawke’s Bay
Regional Investment Company Limited (HBRIC Ltd) for the 2014-15 year.
This dividend level has been increased to $7.56 million as a result of
discussions between HBRIC and its major subsidiary, Napier Port. This
revised level includes $700,000 to part fund the cost of capital proposed for
the RWS.
Interest (-$3,213,000)
Interest Rate
Changes
The economic
data available to HBRC when compiling the LTP indicated that the Official Cash
Rate (OCR) would increase to 4.5% by June 2015. This justified an
interest rate of 5.75% on HBRC deposits to be used for the 2014-15 financial
year.
Current
economic data shows that the OCR remained at 2.5% and is only estimated to
increase to 3.5% by June 2015. Therefore the interest rate for the
2014-15 year has been revised to the lower level of 5.1%.
At the commencement
of the 2014-15 Annual Plan year HBRC will still have a high level of cash
deposits on hand for investment ($70 million) and will also have deposits
representing special purpose reserves ($18 million). The effect of the adjustment on interest rates results in
approximately $580,000 in reduced interest income.
Returns on
Investment
For the 2014-15 year the LTP 2012-22, estimated returns on funds
invested at:
· Ruataniwha Water Scheme (RWS) ($638,000);
· Ngaruroro Water Scheme (NWS) ($352,000);
· Whakatu Road/ Rail Hub ($1,727,000);
· Forestry Investments ($812,000).
The proposed
Annual Plan 2014/14 shows the following adjustments:
· RWS – HBRC has resolved to not require a return on funds
invested during the feasibility stage. This plan does show a payment from
HBRIC for RWS funding costs and this is by way of dividends.
· NWS – the implementation of this scheme has been deferred
while feasibility studies are prepared.
· Whakatu Road/Rail Hub – this scheme has been discarded
because its major backers, the Napier Port has decided not to go ahead and
therefore HBRC will not be asked to contribute.
· HBRC has a number of forestry investments including forests at
Central Hawke’s Bay, Mahia, Waihapua and Tutira. The LTP assumed a
return of 7.5% on HBRC’s investment in these forests. As
HBRC’s cost to funds has decreased due to decreasing interest rates, the
return on forests has been revised to 5%, a reduction of $130,000 from the LTP.
Leasehold rentals (+$266,000)
The LTP
provided for the sell down of Napier leasehold properties in order to provide
cash for other investments. This programme exceeded expectations and the
LTP sell down estimate of $15 million has increased to a sell down of $27
million. Accordingly, the rental revenue from Napier leaseholds reflects the
reduced number of remaining properties and is less than shown in the LTP.
Offsetting
this is that the LTP proposed the sale of the Wellington leasehold
properties. These funds have not been required and so the rental from
these properties has continued.
Forestry income (-$211,000)
Hill Country
Afforestation - the proposal in the LTP to fund the establishment of forestry
blocks on erodible hill country land assumed a carbon price of $20 per tonne to
justify a viable business. As the carbon price at the time of writing
this Plan is around $3 per tonne, HBRC resolved not to proceed with the
forestry investment on hill country erodible land during 2014-15.
Subvention payments (+$224,000)
The LTP
assumed a number of targeted assistance grants would be paid during the 2012/13
financial year. There were a number of delays in finalising the projects
that requested targeted assistance and most of these grants were paid out
during the 2013-14 financial year. This will result in a substantial
increase in the subvention payments during 2014-15.
Napier – Gisborne Railway Returns (+$117,000)
As
mentioned in the Chairman and Chief Executive comments, it has been proposed
that HBRC invest in the Napier – Gisborne Railway. An
initial investment of $3.9million would be required from HBRC for the 2014-15
year with a return that is reflective of HBRC’s funding costs.
Fair value
gains on investments (Note 7, Part 3, Pg 25)
The LTP
forecasts $2.5 million of fair value gains on investment property.
However, due to an increase in the sell down of leasehold land the value of the
investment portfolio has decreased and therefore the fair value gains have
reduced by $715,000 in the 2014-15 Annual Plan.
Expenditure
from activities (Note 1, Part 3, Pg 20)
There is a
reduction of $396,000 on expenditure in activities. These are mainly due to the
following areas:
· The LTP allowed for HBRC to provide the Bovine TB Vector Control
programmes on behalf of the Animal Health Board, however from 1 July 2013
the Animal Health Board will be directly undertaking these programmes.
Expenditure allowed for in the LTP of $620,000 for these programmes are no
longer included in the Annual Plan.
·
Regional income collection expenditure has reduced from the LTP level of $3.4
million to $2.0 million. This is due to a reduction of $350,000 in the
costs associated with Hill Country Afforestation which has been deferred.
A $770,000 reduction in the amount required to pay the Accident Compensation
Corporation for the Napier leasehold cash flow sell down due to selling more
properties before the deal took place. A reduction of $300,000 for
reduced rate collection costs and disaster insurance premiums.
· There were substantial unspent expenses of $1,425,000 that were
carried forward from 2013-14 to 2014-15 for projects yet to be completed.
These costs have been added to the expenditure on activities.
Finance
Costs (Note 1, Part 3, Pg 20)
Included in
the LTP finance costs are not only the interest on borrowings, but also the
payment/fees associated with the transfer of Napier leasehold cash flows to the
Accident Compensation Corporation. Since the HBRC’s programme of
freeholding to lessees has exceeded expectations, the value of remaining cash
flows to be sold on was substantially reduced and therefore the payments/fees
have also substantially reduced.
Property,
plant and equipment (Note 5, Part 3, Pg 24)
Expenditure on
property, plant and equipment including intangible assets are proposed to be
$2,742,000 more in the Annual Plan than in the LTP. The major reason for
this is that intangible assets include $1,666,000 for the feasibility costs for
the NWS project. In the LTP these costs had been incorporated in the
advances to HBRIC Ltd but HBRC is proposing to treat these feasibility costs in
the same way as the RWS and keep them as a HBRC project until such time that
these are sold to HBRIC Ltd. Other intangible assets were increased by
$180,000 for systems integration projects for regulatory software.
Motor Vehicles
and Plant have increased by $219,000 due to $140,000 excavator required by HBRC
Works Group and timing on fleet replacements have changed since the LTP.
These have been offset by a $100,000 increase in expected proceeds for
disposals. There were also capital expenditure carry forwards from the 2013-14
year of $621,000 for the Operations Group and Wairoa Office improvements and
$10,000 for science technical equipment.
Forestry
assets (Part 3, Page 16)
Expenditure on
forestry assets are proposed to be $3.2 million less in the Annual Plan than in
the LTP. This is because of the postponement of the Hill Country planting
project which is no longer viable due to the low carbon credit price.
Solar and
Clean Heat – net lending from reserves (Part 3, Page 16)
The LTP
proposed to lend $3.5 million in relation to solar and clean heat advances
under the Healthy Homes initiatives. Due to the continual deferral of the
solar scheme and the higher than forecast take up of clean heat grants rather
than loans these advances are now proposed to be $2.5 million in the Annual
Plan.
Advances to
HBRIC Ltd (Part 3, Page 16)
The LTP
proposed to advance funds of $33.2 million to HBRIC Ltd in the 2014-15, however
the Annual Plan has reduced this by $11.0 million to an advance of $22.2
million. The reasons for this change are:
· Investment in the RWS
– The LTP provided for a $12.0 million advance to HBRIC Ltd for
investment in the RWS. This has now been revised to $22.2 million due to
the timing of required funds being earlier than the LTP assumptions.
· Investment in the NWS
– The LTP provided for a $4.2 million advance to HBRIC Ltd for the
NWS. This Plan now assumes that HBRC will perform the feasibility process
and $1.7 million has been proposed for this in the Plan. Therefore the
$4.2 million will not be required by HBRIC Ltd in the 2014-15 year.
· Investment in the Whakatu Road and Rail Hub – The LTP had provided for a $17.0 million advance to HBRIC
Ltd for the Whakatu Road and Rail Hub. Funding is no longer required for
this project in the 2014-15 year.
Advances to
Napier – Gisborne Railway (Part 3, Page 16)
This is a new
proposal and so not included in the LTP. A projected $3.9 million has
been allocated for this venture in the 2014-15 year.
Reserve and
public debt funding (Part 3, Page 16)
The Annual
Plan shows reserve funding of $9.2 million less than that set out in the
LTP. This refers, for the most part, to reduced advances to HBRIC Ltd,
Forestry Assets and Solar Heat.
Public debt
funding has increased from $5.3 million in the LTP to $8.2 million in the
Annual Plan an increase of $2.9 million. This is due to $2.3 million
carried forward from the 2013-14 year for loans that have yet to be drawn down,
an increase in System Integration loans of $0.2 million and an increase in Heat
Smart loans of $1.7 million offset by a $1.3 million reduction in funding for
Solar Heat.
Changes to
prospective cash flows (Part 3, Page 19)
The
Prospective Cash Flow Statements show that the overall net change in cash and
cash equivalents has decreased from ($33.9) million as estimated in the LTP, to
($26.0) million in the Annual Plan. This results in a forecast year end
(30 June 2015) cash and cash equivalents balance of $52.8 million. This
closing balance represents the cash on hand for operating and investment
activities and is a combination of financial assets and cash and cash
equivalents in the balance sheet.
Net cash flows
from operating activities is forecast to be $2.3 million less in the Annual
Plan than forecast in the LTP mainly due to the carry forward of expenses for
the Te Mata Park Visitor Centre and Wairoa Community Centre which are offset by
loan funding as well as lower income (refer to comments on the Prospective
Comprehensive Income Statement).
Net cash
outflows from investing activities are forecast to increase by
$7.2 million due to less capital expenditure on investments and HBRIC
advances (refer to comments on Capital Expenditure).
Changes to significant forecasting assumptions
The following
material changes have been made to the significant forecasting assumptions
incorporated in the LTP:
Interest Rates
The interest
rate on investment income in the LTP was assumed at 5.75%. In the 2014-15
Annual Plan the interest rate used for deposits is 5.1% which reflects the
changing circumstances in the financial markets which has seen the Official Cash
Rate (OCR) remain at lower levels than forecast in the LTP.
Cost Adjustors
The LTP
provided for cost adjusters to reflect increases in costs, specifically in
external expenditure of 6.5% cumulative for the 2013-14 and 2014-15
years. In the Annual Plan external expenditure has not been increased by
the full amount to reflect the effects of inflation on these costs.
Investments
· The LTP assumed investment in forestry planting on erodible hill
country. However, as the carbon market price has dropped to unworkable levels,
HBRC has resolved that this initiative be deferred until there is improvement
in the carbon price.
· The LTP set out continual investment in the NWS, however, HBRC has
resolved that its resources needed to be devoted to the RWS and work on the NWS
was deferred until the 2014-15 year
Insurance of
infrastructure assets
· HBRC resolved in January 2013 to rescind the notice of intention
to withdraw from the Local Authority Protection Programme (LAPP). Therefore
LAPP will continue to cover 40% of the damage caused by natural disasters to
infrastructure assets.
· HBRC holds funds in a Regional Disaster Reserve which had a
balance of $3.3m at 28 February 2014. The LTP assumed that this reserve would
not be drawn on during the 10 year LTP period. However, HBRC resolved to
contribute $768,370 from this fund to assist in the remediation works required
in the Makara Flood and Drainage scheme which will be completed before the end
of the 2013-14 financial year.
|
HBRC
2014-15 Annual Plan - Part 1 Introduction
|
Attachment 2
|
Amendments
to Long Term Plan (LTP) 2012-22
There is one
amendment proposed to the LTP 2012-22.
Revenue and
financing policies
Section 102 of the Local Government Act 2002 (funding and
financial policies) states that all policies in that section and included in a
Council’s LTP can only be changed as an amendment to any LTP. The
Hawke’s Bay Regional Council proposes an amendment to our previously
adopted Revenue and Financing policy of the LTP 2012-22.
As adopted in the LTP 2012-22
|
|
|
Allocation of Expenditure
|
Funding Tools
|
|
Public
|
Private
|
Public
|
Private
|
|
Other Schemes
|
Opoho
|
-
|
-
|
-
|
-
|
As proposed in the Annual Plan 2014-15
|
|
|
Allocation of Expenditure
|
Funding Tools
|
|
Public
|
Private
|
Public
|
Private
|
|
Other Schemes
|
Opoho
|
10%
|
90%
|
Investment Income
|
Differential Rate
|
Explanation of changes
The Revenue and Financing Policy is proposed to be amended in
respect of the funding mechanisms for a new Opoho flood and drainage scheme
under the “Other Schemes” sub activity within the Land Drainage and
River Control activity group.
The new Opoho scheme is proposed to have a targeted rate for
2014-15 of $18,328 which funds 90% of the expenses in this scheme. The
other 10% is proposed to be funded through investment income.
Historically the three rate payers that make up this scheme were
billed directly for any flood and drainage work that was completed by
HBRC. To provide these rate payers with more certainty around the amount
that would be charged it is proposed to introduce a new flood and drainage
scheme with a targeted rate attached in the 2014-15 Annual Plan.
Funding
Tools
The funding tools have changed from 100% private funding through
fees/charges to 90% private funding through a targeted rate and 10% public
funding through investment income representing the portion of public good
gained from the work.
Audit
Requirement
Section 103 of the Local Government Act 2002 (revenue and
financing policy) states that if a local authority amends its revenue and
financing policy thereafter only significant amendments are required to be
audited. Given the small number of rate payers and the relatively small
amount involved audit is not required.
|
HBRC
2014-15 Annual Plan - Part 1 Introduction
|
Attachment 2
|
Non
financial changes from the LTP
This section highlights the significant issues identified in the
Long-Term Plan 2012-22. There are no proposed additions to the list of
issues in the 2014-15 Annual Plan. These issues are derived from the
Strategic Plan (2011). HBRC is focusing on and developing these key
strategic approaches in order to achieve the strategic goals of Resilient
Ecosystems, Resilient Economy and Resilient Communities.
Strategic Goals
|
Strategic goal
|
Resilient
Ecosystems
|
Resilient
Economy
|
Resilient
Communities
|
|
Focus Areas
|
Land
|
Water
Quality
|
Water
Allocation
|
Water
security
|
Natural
Hazards and infrastructure
|
People
and Communities
|
|
Strategic Outcome
|
Viable
and resilient farming systems are being achieved through sustainable land use
|
There
is proactive integrated management of land and water.
|
Water
supply and ecosystem needs are optimised for sustainable growth.
|
Water
supply and demand for sustainable growth are optimised.
|
People
and businesses feel safe and are willing to invest in Hawke’s Bay.
|
Comprehensive,
relevant and quality services continue to be delivered by HBRC to enable a
connected and healthy community.
|
|
Strategic Implementation
|
- Hill Country Afforestation Proposal
- Improving the Focus of the Regional Landcare
Scheme
- Biodiversity Strategy
- Papanui Catchment Pilot Study
- Water User Groups
|
Ruataniwha Water Storage
Ngaruroro Water Storage
Heretaunga Plains Flood Control Scheme: Level of Service
Regional Economic Development Strategy
Port of Napier Investment
|
Heat Smart Programme
Public Transport
GMO-Free Hawke’s Bay
Civil Defence & Emergency Management: Funding and Targeted
Rates
Webcasting of Council and Committee Meetings
Solar Hot Water Scheme
Hydraulic Fracturing
|
Enabling
the Strategic Goals
|
Enablers
|
Statutory Planning
|
Investment
|
Strategic Alliances
|
Fit for Purpose Organisation
|
|
Strategic Outcomes
|
Policies
and plans are ahead of trends
|
Investment
is enabling the regional economy to prosper sustainably.
|
Mutual
relationships over the long term help achieve the sustainable development of
Hawke’s Bay
|
HBRC
is a responsive organisation that meets changing needs.
|
|
Strategic
Implementation
|
- Catchment
Based Plan Changes
- Regional Natural Hazards Plan
|
Investment Strategy
Realisation of value from HBRC Investments in leasehold
properties in Napier and Wellington
|
- Strategic Alliances
- Research Alliances
- Transfer of Tutira Properties
- Regional Community Facilities Projects:
Grants
|
Organisational Efficiency
Shared services
|
|
HBRC
2014-15 Annual Plan - Part 1 Introduction
|
Attachment 2
|
|

|
Fenton
Wilson, Wairoa - Chairman
Fenton has represented the Wairoa
constituency since 2009. He is Chairman of the Wairoa Community
Development Trust and also serves on the Smedley Station Advisory Board.
141 Maromauku Road, Wairoa 4196 | 06 835 9200
027 4984 483 | chairman@hbrc.govt.nz
|
|

|
Alan
Dick, QSO, Napier
Alan represents the Napier constituency,
having been elected to Council in 2004. Alan has a Business Degree (MBA) and
is a Fellow of the New Zealand Institute of Management.
3
Newbury Place, Taradale 4112 | 06 844 4645
027 224 0012 | alizdick@xtra.co.nz
|
|

|
Dave
Pipe, Napier
Dave is a newly elected Councillor with a
background in community involvement, having served five terms on Napier City
Council. Dave was also on the HB Environmental Awards Committee for ten
years, five as its Chair. He is a former trustee of Pukemokimoki Marae Trust
and is founding Chair of Napier Community House Trust, the
Manager/Coordinator for St Mary’s Parish Taradale, and a qualified
Independent Civil Celebrant.
25 Vigor Brown Street, Napier 4110 | 06 835 3380
027 247 9979 | davepipe2012@gmail.com
|
|

|
Christine
Scott, Napier - Deputy Chairman
Christine has represented the Napier
constituency since 2001. Christine has served on a number of community trusts
and chaired the Waiapu Diocesan Finance advisory group. She is currently a
director of Anglican Care (Waiapu) Ltd.
43
Napier Terrace, Napier 4110 | 06 835 6950
0274 469 367 | chscott@inspire.net.nz
|
|

|
Peter
Beaven, Ngaruroro
Peter Beaven is a newly elected
Councillor who, for the past twenty years, has worked in various roles in
horticulture. Peter graduated from Victoria University with LLB(Hons), is on
the Board of Pipfruit NZ and current Chairman of the World Apple and Pears
Association.
35A
McHardy Street, Havelock North 4130
06 877 7823 | 027 2355 322 | pjbeaven@icloud.com
|
|

|
Debbie
Hewitt, Central Hawke’s Bay
Waipukurau based,
Debbie is a newly elected representative. Debbie has a Masters degree in
Agribusiness Management and previous governance roles include three
terms as grower-elected director of Horticulture New Zealand; chair of the
Horticulture Industry Vision 10/2020 Taskforce; chair of the Ruataniwha Water
Storage Stakeholder group; and director of Infracon Ltd.
227 Porangahau Road, Waipukurau 4200 | 06 858
7265 027 405 2882 | debbiehewitt@xtra.co.nz
|
|

|
Rex
Graham, Hastings
Rex is a newly elected Councillor, a
Company Director involved in horticulture management and investments in New
Zealand and China. Rex is chairman of the U-Turn Charitable Trust, Deputy
Chair of the HB Regional Sports Park Trust, a Trustee of Te Aranga Marae and
a Director of Te Aranga Ltd.
232 St Georges Road North, Hastings 4172 | 06 877
4122
021 424 972 | rex@freshnz.co.nz
|
|

|
Rick
Barker, Hastings
Rick was elected in October 2013. He was previously a Member of
Parliament for 18 years and is currently acting on behalf of the Minister for
Treaty of Waitangi Negotiations as a Chief Crown Negotiator for two
settlements in Taranaki. Rick completed a Masters Degree in Public Policy in
2012.
409 Burnett Street, Hastings 4156 | 06 878 0010
027 444 2555 | rickjbarker@gmail.com
|
|

|
Tom
Belford, Hastings
Tom is a newly elected representative. His professional
expertise is in marketing and communications and he is editor and publisher
of BayBuzz magazine. Tom is a co-founder of Transparent Hawke’s Bay and
A Better Hawke’s Bay. He has served on various groups advising
our local councils on water and economic development matters. He holds a
master’s degree in political philosophy from Georgetown University.
40
Raratu Road, Havelock North 4295 | 06 874 7937
027 3070 315 | tom@baybuzz.co.nz
|
|
HBRC 2014-15 Annual Plan -
Part 2 Activivities
|
Attachment 3
|
Contents
Page
Introduction......................................................................................... 1
Strategic Planning................................................................................. 2
Land Drainage and
River Control........................................................... 9
Regional Resources............................................................................. 17
Regulation.......................................................................................... 31
Biosecurity.......................................................................................... 37
Emergency Management.................................................................... 42
Transport............................................................................................ 51
Governance and
Community Engagement........................................... 57
|
HBRC
2014-15 Annual Plan - Part 2 Activivities
|
Attachment 3
|
Introduction
This plan
outlines activities the Hawke’s Bay Regional Council (HBRC) intends to
carry out over the next year. The following groups of activities work toward meeting the current and future needs of communities for good
quality local infrastructure, local public services, and performance of
regulatory functions in a way that is most cost-effective for households and
businesses in the region.
The
Structure of the Annual Plan
For the
purpose of this Annual Plan, HBRC has arranged its activities into eight
groups:
· Strategic Planning
· Land Drainage and River Control
· Regional Resources
· Regulation
· Biosecurity
· Emergency Management
· Transport
· Governance and Community Engagement.
The section on each of the eight core groups provides:
· An Introduction
· How the activity contributes to meeting Council’s objectives
· Any Significant Negative Impacts arising from its implementation
· Estimated expenses for each activity and how it will be funded. It
is important to note that funding sources and the reason it was selected, is
covered in detail in the Long Term Plan 2012-22.
· An analysis of the forecast expenditure and income for the 2014-15
Annual Plan and for the same year in the Long Term Plan 2012-22 (LTP). The
2013-14 Annual Plan budgets and actual figures for 2012-13 are also provided
for comparative purposes.
Sub-groups within each group provide:
· The rationale for HBRC involvement and the level of service that
it expects deliver to the community
· Current performance and Performance targets for the year

|
HBRC
2014-15 Annual Plan - Part 2 Activivities
|
Attachment 3
|
Introduction
These
activities pull together Hawke’s Bay Regional Council’s (HBRC)
strategic thinking initiatives, economic development, investments and resource
management policy development. Together with State of the Environment reports,
these provide information for further planning decisions.
Links to
Regional Community Objectives
Strategic
Planning initiatives and projects are undertaken in order to meet the needs of
the regional community for good quality performance of regulatory functions.
They help focus conversations on what the future might look like in order to
ensure that any regulatory response contributes toward the achievement of this
future.
This group of
activities contributes to Council’s objectives for the regional community
in the following ways.
· An environment that is appreciated, protected and sustained for
future generations –HBRC is
managing the region’s natural and physical resources to ensure they are
used efficiently and effectively; and the State of the Environment (SOE) project will inform the community
of environmental change and the effectiveness of HBRC programmes.
· A strong prosperous and thriving economy – by funding and undertaking activities which support
economic development based on the region’s natural resources; maximising
the sustainable input of natural and physical resources into economic
activities; and enabling sustainable
development through environmental information that can be used to report on
activity effects.
· Strong regional leadership and sense of belonging – by providing a mechanism to co-ordinate regional initiatives
through the Regional Economic Development Strategy and Strategic Plan; engaging
the community in making decisions about the future of their region, and
promoting integrated strategy and planning processes.
· Communities that value and promote their unique culture and
heritage - by helping inform
communities of future issues and on the current state of the region.
· Supportive, caring and inclusive communities - by providing the community with information that enables
informed decisions to be made.
· A lifetime of good health and wellbeing – by providing a planning framework to promote the
sustainable management of the region’s natural and physical resources;
and by providing the community with information that enables informed decisions
to be made (e.g. the contaminated sites database).
· Safe and accessible recreational facilities – by providing information to enable safe recreational
activities, e.g. recreational water quality programme.
Significant
Negative Impacts
HBRC’s
involvement in strategic thinking and planning helps to ensure that inevitable
change in our communities is positive and not merely random or reactive.
Strategic Planning often involves striking a balance between competing
interests to ensure that the natural and physical resources we have now are
maintained and enhanced for our grandchildren and their grandchildren. Some
planning decisions must be made under the Resource Management Act [RMA], and to
create and implement those RMA plans can be lengthy and involve significant
costs.
|
HBRC
2014-15 Annual Plan - Part 2 Activivities
|
Attachment 3
|
Expenditure
and Funding
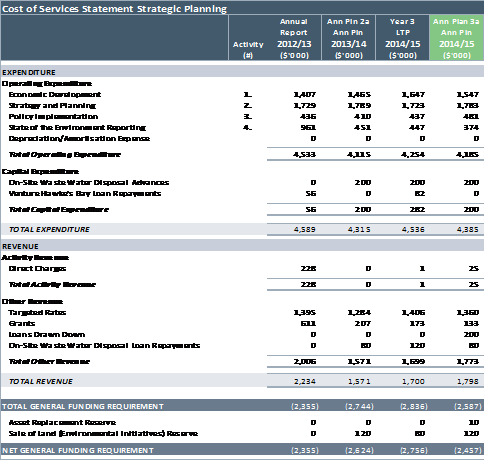
Net Funding Requirement: Strategic Planning
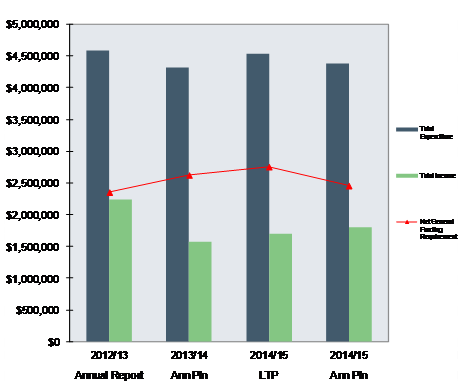
|
HBRC
2014-15 Annual Plan - Part 2 Activivities
|
Attachment 3
|
Activity 1
– Economic Development
|
Service Levels and Performance Targets
Activity
1 – Economic Development
|
|
Level
of Service Statement
|
Level
of Service Measure
|
Current
Performance
|
Performance
Targets
2014-15
|
Required
Actions to Achieve
Performance
Targets
|
|
Regional Economic Development Strategy mission statement: “To make Hawke’s Bay the best
location in which to visit, work, invest, live and grow”
|
Comprehensive visitor strategy in place within an overall
regional marketing plan
|
3 year funding agreement in place for Hawke’s Bay Tourism
Ltd with approved performance targets and reporting requirements
|
2014-2015
Continue quarterly reporting to Council on key performance
indicators
|
Maintain funding of Hawke’s Bay Tourism Ltd for 2014-15
and review as part of 2015-25 Long Term Plan
|
|
Long term Regional Economic Development Strategy
|
Last reviewed 2010-11
|
2014-2015
Annually review and progress the regional economic development
strategy
|
Review and refresh annually the Regional Economic Development
Strategy, and participate fully in Business Hawke’s Bay operations
|
|
Investment for research and development and business development
|
In 2011-12 a total of $2.7 million of grants came into the
region via Ministry of Science and Innovation
Underway in partnership with Ministry of Science and Innovation
(Regional Partner Network)
|
2014-15
At least $800,000 per annum achieved for Research and
Development investment
|
Implement Regional Business Partner Network programme in
partnership with Chamber of Commerce locally, New Zealand Trade and
Enterprise and Ministry of Science and Innovation nationally
|
|
Sustainable regional growth
|
Key strategies
and actions contained in Regional Economic Development Strategy
|
2014-15
Initiate sustainable primary production programmes:
· Maori Agribusiness
· Wairoa primary sector opportunities
Continue to engage on Oil and Gas exploration / development with
stakeholders
|
Develop and implement collaborative programmes
|
Activity 2 – Strategy and Planning
|
Service Levels and Performance Targets
Activity
2 –Strategy and Planning
|
|
Level
of Service Statement
|
Level
of Service Measure
|
Current
Performance
|
Performance
Targets
2014-15
|
Required
Actions to Achieve
Performance
Targets
|
|
HBRC
will help the community prepare for the future
|
Number
of Embracing Futures Thinking events held
|
Embracing
Futures Thinking
Breakfasts held over last three years
|
Each
year
Host at least 1 Embracing
Futures Thinking (Strategic Planning) event as part of Long Term Plan
development
|
Project manage
event
|
|
Trends
review completed
|
Social,
technological, Economic, Environmental and political trend report completed
in 2009 and summarised in HB2050: Land River Us report
|
2014-15
Refresh the
Trends and Environmental Scan analysis
|
Engage
consultants to undertake trend and environmental scans
|
|
Agreement
reached on Spatial Planning Framework
|
Individual
strategies are in place that would support spatial planning e.g. Heretaunga
Plains Urban Development Strategy, Regional Land Transport Strategy
|
2014-15
Reach
agreement on regional and lower North Island spatial planning framework
(On hold pending outcome of Local Government reorganisation processes under
way in Hawke’s Bay and Wellington)
|
Engage with Lower
North Island Regional Councils and other agencies such as New Zealand
Transport Agency (on hold)
|
|
HBRC
will integrate land and water and biodiversity management to deliver
environmental, economic, social and cultural outcomes
|
Action
plans and monitoring prepared for:
- Land and Water
Management Strategy
- National Policy
Statement for Freshwater Management
|
To
date, two Land and Water symposiums have been held
|
Each
year
Prepare report on
implementation of National Policy Statement for Freshwater Management
Stocktake of Land and Water Management
Strategy undertaken in March 2014, consider as part of Long Term Plan
development
|
Report on NPSFM
implementation Plan progress through the Annual Report
|
|
Regional
Biodiversity Strategy completed
|
No
current biodiversity strategy in place
|
2014-15: Prepare
final Regional Biodiversity Strategy and prepare programme of work relevant
to HBRC for inclusion in the next Long Term Plan
|
Project manage
the preparation of a Regional Biodiversity Strategy in conjunction with key
stakeholders
|
|
HBRC
will establish and maintain clear and appropriate policy in a responsive and
timely manner that will enable sustainable management of the region’s
natural and physical resources
|
Status of
Resource Management Plans and Policy Statements.
No more than 2
years elapse from notification of a plan change to decisions on submissions
being issued
|
Plan changes in process
RPS
Change 5: Land and Freshwater Management
Plan
Change 6: Tukituki Catchment
Policy under development in following catchments
Taharua
and Mohaka
Heretaunga
Zone (Clive/Karamu, Ngaruroro, Tutaekuri, Ahuriri, Heretaunga Plains aquifer)
|
2014-15
- Appeals
on Change 5 (Land and Freshwater Management) are resolved
- Plan change for
Taharua /Upper Mohaka catchment publicly notified Dec 2014
- Initiate
community engagement on oil and gas exploration policy development
2015-16
Plan change for outstanding freshwater
bodies publicly notified July 2016
2016-17
Plan change for Heretaunga Zone publicly
notified December 2016
|
Project manage
the development of policy for inclusion in the Regional Resource Management
Plan and Regional Policy Statement including:
· Coordinate and
integrate all the necessary inputs into the planning processes
· Coordinate and
undertake the required stakeholder community engagement before notification
|
|
Regional
Natural Hazards Strategy and Implementation Plan prepared
|
2014-15
Plan
change for Natural Hazards publicly notified July 2015
|
| Regional
Coastal Environment Plan |
At all times
there is a regional plan in force for the HB coastal marine area
New Zealand
Coastal Policy Statement (NZCPS) put into action in accordance with statutory
requirements
Plan Change 1- Geographical Coverage of Regional
Resource Management Plan:
Appeals
resolved, awaiting Minister of Conservation approval
|
2014-15
Start
review of coastal hazard zones for coastline between Tangoio and Clifton,
as part of preparation of a hazard management strategy for that coastline
(see Project 322)
- Develop
plan change(s) to give effect to 2010 NZCPS
|
Project manage the development of policy in the Regional Coastal
Environment Plan that gives effect to the 2010 NZCPS including:
· Coordinate and
integrate the necessary expert and legal advice inputs into planning
processes
· Coordinate and
undertake the required stakeholder community engagement prior to notification
|
|
HBRC
2014-15 Annual Plan - Part 2 Activivities
|
Attachment 3
|
Activity 3 – Policy Implementation
|
Service Levels and Performance Targets
Activity
3 –Policy Implementation
|
|
Level
of Service Statement
|
Level
of Service Measure
|
Current
Performance
|
Performance
Targets
2014-15
|
Required
Actions to Achieve
Performance
Targets
|
|
HBRC
will promote integrated management and benefits of collaboration by
proactively communicating its policies and responsibilities through dialogue
and submissions on district plans, consent applications and central
government initiatives
|
Lodging
of submissions on district plans, district planning applications and central
government initiatives where there are relevant regional council policies
|
A
report on statutory advocacy activities:
Prepared
and considered at HBRC’s Environmental Management Committee meetings
and Maori Committee meetings
|
2012-22
Submissions made
on district plans, district planning applications and central government
initiatives reported to HBRC’s Environment and Services Committee
Staff of HBRC and
territorial local authorities to meet at least twice a year to discuss
integration issues and steps to improve the regional and district plan are
identified and acted upon
|
Continue to
receive, review and report on consent applications and plan development
activities
Facilitate the
Hawke’s Bay Planners’ group
|
|
HBRC
will help communities without sewers improve the management of domestic
wastewater
|
Number
of interest free loans approved
|
One
loan provided to Hastings District Council for the Waipatiki system has been
repaid in full
|
Provide a fund to
help the territorial authority-led upgrading of community wastewater systems
in communities without sewers ($200,000pa contributions capped
at $1,000,000)
Non-regulatory
initiatives developed and implemented to complement regional plan policy
development that implements National Policy Statements and/or National
Environmental Standards
|
Continue to
provide an interest-free loan scheme to assist territorial authorities’
upgrade wastewater services in communities without sewers
Continue to
consider a broad range of interventions to achieve the objectives of
nationally driven regulations and standards
|
|
HBRC
will investigate and manage contaminated sites to ensure public health and
safety and environmental protection
|
Maintain
a database of potentially and confirmed contaminated sites
|
Upgrading
of database to enable both public and territorial authority access
|
2012-22
To administer and
maintain the database, including checking record details, site visits to GPS
areas of contamination, transfers to Territorial Local Authorities (TLAs) as
per agreed protocol and advising landowners of the contaminated sites status
of their property
|
Review
database
Verification
of sites listed on database
Transfer
protocols with TLAs
|
|
HBRC 2014-15 Annual Plan - Part 2
Activivities
|
Attachment 3
|
Activity 4 – State of the Environment Reporting
|
Service Levels and Performance Targets
Activity
4 –State of the Environment Reporting
|
|
Level
of Service Statement
|
Level
of Service Measure
|
Current
Performance
|
Performance
Targets
2014-15
|
Required
Actions to Achieve Performance Targets
|
|
HBRC will monitor and provide accurate information to the
community so that it understands the State of the Environment (SOE) for
Hawke’s Bay
|
Data quality as assessed against HBRC’s quality assurance
system
Amount of State of the Environment monitoring data available
through HBRC’s website
|
HBRC’s quality assurance system is based on nationally
recognised standards and guidelines. The Quality Management System
that guides activities in the Environmental Science Sections was accredited
in December 2012 in terms of ISO9001:2008
Some data for limited sites is available on HBRC’s
website:
· Recreational water quality
· Groundwater quality
· Groundwater levels
· River flows
· Rainfall
· Air quality
|
2012-22
Maintain the current level of SOE data on HBRC’s website
Continue to make information from the following monitoring sites
available through HBRC’s website:
· All telemetered river flow sites
· All telemetered rainfall sites
· All telemetered climate stations
· All data collected, processed, analysed and stored in accordance
with ISO requirements
· Maintain ISO accreditation
|
- Maintain quality assurance
system requirements to maintain ISO accreditation
- Regular auditing of the
quality assurance system
- Take corrective action as
identified by internal and external audits
- Respond to “Areas of
concern” and “Opportunities for improvement” identified by
internal and external audits
- Maintain monthly SoE reports
on website
|
|
State of the Environment Monitoring Report
|
Five Yearly State of the Environment Report June 2009
|
2012-22
Annual Update State of the Environment Reports available by June
each year
2014-15
Five yearly State of the Environment Monitoring Report available
by December 2014
|
Prepare annual update and five yearly reports
|
|
HBRC
2014-15 Annual Plan - Part 2 Activivities
|
Attachment 3
|
Introduction
Land drainage
and river control activities focus on the management of the region’s
rivers, streams and drainage network to reduce the effects of flooding in areas
where there is significant risk to people and property. Much of this work
relates to the maintenance of the flood control and drainage schemes which have
been developed over many years, and now have a replacement value of more than
$140 million.
Land drainage and river control covers the inter-related
programmes of:
· Flood protection and drainage schemes
· Investigations and enquiries
· Sundry works.
The empowering
legislation for this function of HBRC is the Soil Conservation and Rivers
Control Act 1941, the Local Government Act 2002 and the Civil Defence Emergency
Act 2002.
Links to
Regional Community Objectives
This group of
activities contributes to Council’s objective to meet the current and future needs of communities for good quality
local infrastructure in a way that is most cost-effective for households and businesses in the following ways.
· An environment that is appreciated, protected and sustained for
future generations – by
management and enhancement of the waterways with an holistic management
philosophy and implementation of an environmental strategy and compliance with
an environmental code of practice.
· A strong, prosperous and thriving economy – by reducing the risk of flooding to the community and
productive land.
· A lifetime of good health and wellbeing – by minimising the risk of flooding of homes and
productive land, and providing safe waterway environments.
· Safe and accessible recreational facilities – by providing for public access to HBRC managed waterway
environments for recreation and enjoyment and enhancing amenity values where
appropriate.
Significant
Negative Impacts
The
construction of flood protection and drainage systems has resulted in
significant changes to the natural hydrology of their associated catchments,
including a reduction in areas frequently flooded, diversion and straightening
of waterway reaches, removal of streamside vegetation, and the use of
structures to control flows and erosion.
These changes
and the ongoing methods used to maintain the schemes have resulted in adverse
effects on river and stream ecology and habitats, as well as affecting the social
and cultural values of the waterways. HBRC has initiated an enhancement
programme, including alternative management of riparian areas, which will
promote improvements in water quality and aquatic and terrestrial habitats in
efforts to repair and remediate those negative impacts.
|
HBRC
2014-15 Annual Plan - Part 2 Activivities
|
Attachment 3
|
Expenditure and Funding
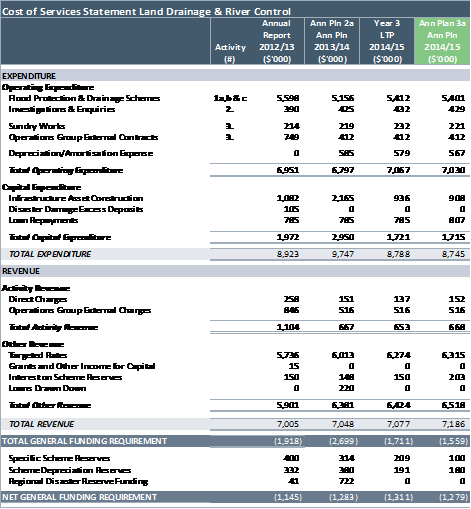
Net Funding
Requirement: Land Drainage & River Control
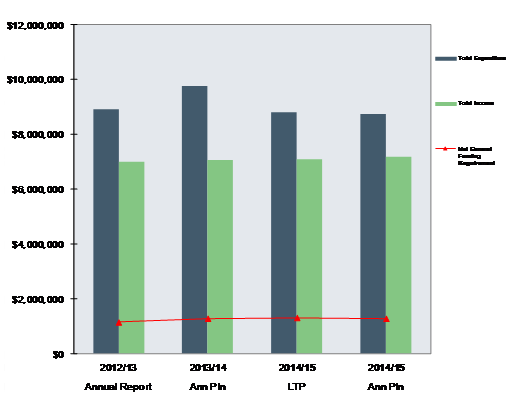
Activity 1a, b, c – Flood Protection and Drainage Schemes
|
Service Levels and Performance Targets
Activity
1a – Flood Protection & Drainage Schemes: Heretaunga Plains
Scheme
|
|
Level
of Service Statement
|
Level
of Service Measure
|
Current
Performance
|
Performance
Targets
2014-15
|
Required
Actions to Achieve
Performance
Targets
|
|
HBRC
will maintain an effective flood control network that provides protection
from frequent river flooding to communities and productive land within the
Heretaunga Plains Scheme
The level of protection in technical
terms is to convey a flood discharge with a 1% probability of being exceeded
in any one year (1%AEP) safely to the sea
|
A
full assessment of the capacity and integrity of flood control works is
completed every twelve years by a chartered professional engineer with
interim audits undertaken annually
|
Full
initial assessments have been made for the following rivers:
Tutaekuri 2009-10
Ngaruroro 2010-11
Lower Tukituki 2011-12
|
2013-15
Review of the
current level of service (LOS) provided by the Heretaunga Plains Scheme to
determine whether they are still appropriate or should be increased.
Take into account potential impact of climate change in this review.
|
Ongoing
Ongoing
maintenance and gravel extraction to maintain the channel capacity and
integrity of the flood protection assets
Monitoring of
flood events in accordance with the Flood Manual
Annual asset
audit by a chartered professional engineer, and full assessment of each of
the major rivers every twelve years
Ongoing sawfly
damage monitoring and alternative species planting
|
|
The
level of service will be reported as:
Kilometres and
percentage of floodway that provide the design level of service
|
Audits
in past years indicate the following levels of service:
Tutaekuri: 100%
(23.6km of river channel)
Ngaruroro:
100% (39km of river channel)
Lower Tukituki:
100%(10.2km of river channel)
|
2012-22
Tutaekuri,
Ngaruroro & Lower Tukituki Audits: No change
|
|
HBRC
will maintain an effective drainage network that provides protection from
frequent flooding from smaller watercourses to communities and productive
land within the Heretaunga Plains Scheme
|
A
full assessment of the capacity and integrity of the drainage network within
each drainage catchment is completed every twelve years by a chartered
professional engineer with interim audits undertaken annually
|
The
historic level of service based on rainfall runoff is no longer considered
appropriate given modern design techniques
New
measures will be developed as part of the level of service review to be
completed over the next three years
|
2013-14
and 2014-15
Review the
current level of service provided by the scheme and determine new level of
service measures and targets
|
Ongoing
Monitoring,
operation and maintenance
Annual asset
audit by a chartered professional engineer
|
|
HBRC will protect and enhance the
scheme’s riparian land and associated waterways administered by the
Regional Council for public enjoyment and increased biodiversity
|
The
level of service will be reported as the length of scheme riparian land
enhanced. (Each side of a waterway measured separately and includes new
planting and inter-planting)
|
Completed
to date:
Tutaekuri (left
bank): 6km
Tukituki (left
bank): 3.4km
(right
bank): 3.4km
Ngaruroro (left
bank): 4.5 km
|
Ongoing
0.5km of riparian
land enhanced a year (on average)
|
2013-20
Develop Rivers
Environmental Concept Plans
Ongoing
Implement
annual programme from Environmental Strategy
|
|
Service Levels and Performance Targets
Activity
1b – Flood Protection & Drainage Schemes: Upper Tukituki
Scheme
|
|
Level
of Service Statement
|
Level
of Service Measure
|
Current
Performance
|
Performance
Targets
2014-15
|
Required
Actions to Achieve
Performance
Targets
|
|
HBRC
will maintain an effective flood control network that provides protection
from frequent river flooding to communities and productive land within the
Upper Tukituki Scheme
The
level of protection in technical terms is to convey a flood discharge with a
1% probability of being exceeded in any one year (1%AEP) safely to the sea
|
A
full assessment of the capacity and integrity of flood control works is
completed every twelve years by a chartered professional engineer with
interim audits undertaken annually
|
Full
initial assessments have been made for each of the rivers in the flowing
years:
Upper
Tukituki 2009-12
Waipawa
2011-12
|
Full Scheme Reviews
Upper
Tukituki: Start Date 2013/14; completion date 2014/15. Take into
account potential impact of climate change in this review.
|
Routine
2013-22
Ongoing
maintenance and gravel extraction to maintain the channel capacity and
integrity of the flood protection assets
Monitoring of
flood events in accordance with the Flood Manual
Annual asset
audit by a chartered professional engineer, and full assessment of each of
the major rivers every twelve years
Ongoing sawfly
damage monitoring
Investigate
options for increasing gravel extraction from Upper Tukituki Scheme Rivers.
Review Scheme
classification to determine whether it remains fit for purpose.
|
|
The
level of service will be reported as:
Kilometres and
percentage of floodway that provide the design level of service
|
Past
audits indicate the following levels of service:
Upper Tukituki:
34.4km, 95%
Waipawa: 26.5km,
95%
|
2015-16
River View Edge
Risk: Review of the current level of service provided by the Scheme to
determine whether they are still appropriate or should be increased
|
|
HBRC
will protect and enhance its scheme riparian land and associated waterways
for public enjoyment and increased biodiversity
|
The
length of Scheme riparian land enhanced by inter-planting with alternative
native and exotic species (each side of a waterway measured separately)
|
Completed
to date:
Waipawa (Left
Bank): 1.5km
Tukituki River
(Right Bank): 2km
|
Ongoing
0.5km of riparian
land enhanced a year (on average)
|
2013-19
Implement annual
programme from Environmental Strategy
|
|
Service Levels and Performance Targets
Activity
1c – Flood Protection & Drainage Schemes: Other Schemes
|
|
Level
of Service Statement
|
Level
of Service Measure
|
Current
Performance
|
Performance
Targets
2014-15
|
Required
Actions to Achieve
Performance
Targets
|
|
HBRC
will maintain an effective flood control and drainage network that provides
protection from frequent flooding to communities and productive land within
designated Scheme areas. These schemes include:
Makara Flood
Control
Paeroa Drainage
Porangahau Flood
Control
Ohuia –
Whakaki Drainage
Esk River
Whirinaki
Drainage
Maraetotara
Te Ngarue
Kopuawhara Flood
Control
Poukawa Drainage
Kairakau
(proposed)
Waimarama
(proposed)
|
A
full assessment of the capacity and integrity of flood control works is
completed every twelve years by a chartered professional engineer with
interim audits undertaken annually
The
level of service will be reported as:
Percentage of
assets that provide the design level of service
|
Estimated
at 95%
|
2013-15
Kairakau and
Waimarama Flood Protection Schemes accepted by community and operation phase
begun
No change to
other schemes
|
Ongoing
Ongoing
maintenance to preserve channel capacity and integrity of flood protection
and drainage assets
Monitoring of
flood events in accordance with the Flood Manual
Consult with
Waimarama community regarding the possibility of establishing a flood control
scheme to fund improved management of the waterways and flood channels
flowing through the community
|
|
HBRC
2014-15 Annual Plan - Part 2 Activivities
|
Attachment 3
|
Activity 2 – Investigations and Enquiries
|
Service Levels and Performance Targets
Activity
2 –Investigations and Enquiries
|
|
Level
of Service Statement
|
Level
of Service Measure
|
Current
Performance
|
Performance
Targets
2014-15
|
Required
Actions to Achieve
Performance
Targets
|
|
HBRC will be available to provide expert
advice on drainage, flooding, and coastal erosion issues
|
All queries are dealt with by appropriate
qualified and experienced staff
|
HBRC employs two chartered professional
engineers with experience in flood management, river control and coastal
issues
|
Ongoing
HBRC retains two chartered professional
engineers with experience in flood management, river control and coastal
issues on staff
|
Ongoing
Staff retention
Recruitment of graduates and promotion of
local government careers to ensure staffing capacity for the future
|
|
HBRC will provide up to a 30% subsidy for
river control and flood protection where the criteria set out in the Regional
Council’s guidelines for technical and financial assistance are met
|
Value of subsidies provided annually
|
Subsidies valued at $42,000
|
Ongoing
$42,000 plus inflation of subsidy money is provided each year at
a subsidy rate of 30%
|
Ongoing
Continue
to promote the HBRC subsidy programme
|
|
HBRC will provide a consultancy service
for drainage, flooding, and coastal erosion issues according to individual
project agreements on a full cost recovery basis
|
Cost recovery
Satisfaction with Service
|
Costs are recovered
Not specifically measured
|
Ongoing
Full costs of any consultation work are recovered
Major clients are satisfied with service provided
|
Ongoing
Effectively and efficiently complete consultancy projects
|
|
HBRC
2014-15 Annual Plan - Part 2 Activivities
|
Attachment 3
|
Activity 3 – Total Sundry Works
|
Service Levels and Performance Targets
Activity
3–Sundry Works
|
|
Level
of Service Statement
|
Level
of Service Measure
|
Current
Performance
|
Performance
Targets
2014-15
|
Required
Actions to Achieve
Performance
Targets
|
|
HBRC will ensure that the beach at
Westshore has erosion checked to 1986 erosion line
(The 1986 line was the extent
of erosion before beach renourishment began. This line is identified on a
series of posts along the foreshore)
|
The comparison of annual beach cross
section surveys to the 1986 erosion line
|
The erosion remains seaward of the 1986
line
|
Ongoing
Erosion does not extend landward of the 1986 line
|
Ongoing
Renourishment is completed annually with the quantity of
material assessed from pre-contract beach cross section surveys
|
|
HBRC will maintain river mouths so that
they do not flood private land above a specified contour subject to suitable
river, sea and weather conditions that will allow a safe and successful
opening to be made
|
Incidences of flooding of private land
above levels as specified in the River Opening Protocol
|
No incidences
|
Ongoing
Private
land above a specified contour is not flooded as a result of a river mouth
being closed
|
Ongoing
River
mouths and lagoon outlets are inspected regularly and opened when required,
and when river, sea and weather conditions allow
|
|
HBRC
2014-15 Annual Plan - Part 2 Activivities
|
Attachment 3
|
Introduction
Regional
Resources covers the region’s public shared resources (air, water, coast,
soil and gravel), its land resource (in private ownership) and Hawke’s
Bay Regional Council (HBRC) owned property managed as a regional resource.
These
activities include the gathering of information to improve sustainable
management and efficient use for enhanced economic and environmental
performance.
Links to
Regional Community Objectives
This group of
activities contributes to Council’s community objectives in the following
ways.
· An environment that is appreciated, protected and sustained for
future generations –by
understanding that the region’s natural and physical resources are being
managed to ensure they are used efficiently and sustainably; identifying and
promoting sustainable land management practices;
improving air quality; sustainably managing rivers and the gravel resource; and
providing opportunities for access to open space areas.
· A strong, prosperous and thriving economy – by maximising the
sustainable use of natural and physical resources for economic activity, which
will make Hawke’s Bay a more attractive place
to live, work and establish commercial and industrial enterprises.
· Communities that value and promote their unique culture and
heritage – by protecting sites of
cultural significance with open space areas and, where appropriate, identifying
and valuing them for public education and interest.
· Supportive, caring and inclusive communities – by enabling community-led water user groups to develop
ways to efficiently use the region’s water allocations, through actions
such as audited self management.
· Safe and accessible recreational facilities –by providing access to the coast and safe off road
pathway/cycleway opportunities for recreational enjoyment.
· A lifetime of good health and wellbeing – by protecting the natural
environment particularly fresh and coastal swimming water quality. By improving air quality to reduce respiratory disease and
the related cost of health services and lower absenteeism from school and work,
caused by exacerbated respiratory symptoms from higher than acceptable levels
of PM10 (particulate matter or fine particles in dust and smoke); By
providing open space areas and cycleways to encourage good health and
wellbeing.
Significant
Negative Impacts
There are no
significant negative impacts relating to the collection of information about
regional resources, unless the information raises
more questions than answers and results in delays in decision-making.
With sustainable land
management, the Ministry for Primary Industries (MPI) also has a role to meet
New Zealand’s Kyoto Protocol obligations. Therefore landowners may be confused by having two agencies engaging
with them on the same issues and it is important that HBRC and MPI work together
to avoid duplication.
|
HBRC
2014-15 Annual Plan - Part 2 Activivities
|
Attachment 3
|
Expenditure and Funding

Net Funding
Requirement: Regional Resources
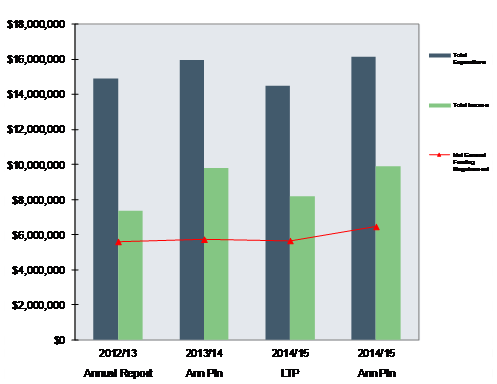
|
HBRC
2014-15 Annual Plan - Part 2 Activivities
|
Attachment 3
|
Activity 1 – Land Management
|
Service Levels and Performance Targets
Activity
1–Land Management
|
|
Level
of Service Statement
|
Level
of Service Measure
|
Current
Performance
|
Performance
Targets
2014-15
|
Required
Actions to Achieve
Performance
Targets
|
|
Viable
and resilient farming systems are being achieved through sustainable land use
|
Annually
reporting on research project outputs and how they have contributed to
sustainable land management outcomes
|
Research
and extension projects are currently active including the following:
Creating a
climate for success – Huatokitoki community project. (MPI, HBRC,
Hatuma, Landcorp, Beef and Lamb, Massey, Landcare)
Wairoa sediment
reduction initiative. (MPI, HBRC)
Alternative
grassland species (Landcare, MPI, HBRC, Beef and Lamb)
|
Ongoing
Continue a
programme of research and extension to investigate and field trial issues
relevant to sustainable land management in Hawke’s Bay
Actively seek
collaboration with primary product organisations undertaking research
relevant to HB
|
Ongoing
Finalise the
development of a research strategy in collaboration with Primary Sector
industry groups and commence its implementation
Initiate at least
one new research or research extension initiative annually
|
|
Outputs
achieved through HBRC Regional Landcare Scheme
|
Sample
of approx outputs from Regional Landcare Scheme since its inception in 1995
Total HBRC
investment: $7.13M
Number of poplar
and willow poles planted for soil erosion: 440,000
Clients: 744
Projects: 2450
|
Ongoing
Regional Landcare
Scheme (RLS) reviewed outcomes to be implemented by June 2014
Report in the
operation plan how RLS activity directly contributes to sustainable land
management
Annual output
targets delivered from the RLS investment to be established and implemented
as part of the annual operating plan
|
Ongoing
Utilise RLS
funding in accordance with priorities and processes established
Annual operating
plan to be developed and presented to Council before the start of each
financial year
|
|
The
operational plan will show the focus of Regional Landcare Scheme activity and
alignment with the Regional Afforestation programme and the intensification
of land use
|
Regional Landcare Scheme subsidies
are assessed on the basis of region wide criteria
|
A portion of
Regional Landcare Scheme subsidy will be targeted, and the level of subsidy
varied, to encourage initiatives that more effectively respond to
environmental change
|
|
Service Levels and Performance Targets
Activity
1–Land Management
|
|
Level
of Service Statement
|
Level
of Service Measure
|
Current
Performance
|
Performance
Targets
2014-15
|
Required
Actions to Achieve
Performance
Targets
|
|
HBRC
will increase its knowledge of the region’s land, soil and terrestrial
habitats so it is aware of any current and likely future issues that may
arise
This
knowledge will allow for a timely and effective response that enables land
sustainability for future generations
|
Regional
baseline hill country erosion monitoring
|
Baseline hill country erosion survey
|
2013-14
Erosion
monitoring repeated (about every 5 years but contingent on any major regional
storm event)
|
Erosion/sediment model for the Tukituki
catchment to be commissioned with the option of extending into other
catchments in the future
|
|
Integrated catchment management including staged computer
modelling & monitoring of the:
Mohaka
Heretaunga/Ahuriri
catchments
Tukituki
|
Currently
Land and water monitoring of the Taharua and upper Mohaka Rivers
Computer modelling of the entire Mohaka catchment is underway
Heretaunga/Ahuriri
(TANK) catchments are next in line to be investigated
Tukituki model
(TRIM) developed
|
2013-15
Catchment
models developed for Taharua and the entire Mohaka catchment
Catchment
model for TANK catchments developed
Refinement
and upgrades of Tukituki TRIM model
|
Development
of TANK catchments model or models
Update
TRIM into new modelling software
Scenarios
run using Taharua/Mohaka catchment model
|
|
Hawke’s
Bay’s land resource is maintained for future generations
|
Area
of erosion prone land with tree cover
Baseline
erosion monitoring
|
Much of Hawke’s
Bay’s pastoral hill country needs more vegetative cover to minimise
erosion and improve productivity
|
Proposed Regional Afforestation Scheme was withdrawn by Council
due to low carbon price
Investigate potential for High UMF manuka plantings
|
Report
on data gathered from high UMF Manuka plantation on Tutira Regional Park
|
|
HBRC
2014-15 Annual Plan - Part 2 Activivities
|
Attachment 3
|
Activity 2 – Air Management
|
Service Levels and Performance Targets
Activity
2–Air Management
|
|
Level
of Service Statement
|
Level
of Service Measure
|
Current
Performance
|
Performance
Targets
2014-15
|
Required
Actions to Achieve
Performance
Targets
|
|
HBRC
will have adequate knowledge about the level of air pollutants that may
impact on public health and aesthetic values so that it can manage air
quality for human health needs and aesthetic values
|
State of the Environment monitoring programme for:
Air
quality
Climate
|
Regional Air Quality Monitoring Strategy revised in 2011.
-4 yearly surveillance monitoring of NES contaminants other than
PM10 completed in 2013
|
2013-22
Monitoring
undertaken in accordance with the Regional Air Quality Monitoring Strategy
2013-22
Report
on breaches of the National Environmental Standards in accordance with the
standard
|
Monitor PM10 concentrations[1] continuously in the Napier,
Hastings and Awatoto airsheds. Data collected should comply with
performance targets:
(less
than 5% of data missing) and
75%
valid data (less than 25% of measured and archived values unaffected by
calibration and instrument fault events)
Winter
time Mobile PM10 monitoring campaign
Source
apportionment monitoring in the region’s airsheds as needed to
identify pollution sources
Undertake
the 3-yearly review of the Air Quality Monitoring Strategy
|
|
HBRC
will provide financial assistance for those who qualify for insulation and
clean heat support
|
Number of clean heat systems installed under financial
assistance programme
|
Following a slow start, the number of clean heat installations
is now meeting agreed targets
|
2013-22
- Provide
loan assistance to homeowners region wide for home insulation and clean
heat under HBRC’s financial assistance programme
|
Develop
and implement a communications strategy to promote the programme
|
|
Hawke’s Bay’s air
is suitable to breathe
|
Compliance with National Environmental Standard (NES) for Air
Quality
|
In 2013, Napier airshed exceeded the standard 5 times, Hastings
airshed exceeded the standard 16 times and Awatoto exceeded it once.
|
Napier
Airshed meets NES: No more than 1 exceedance by 2016
Hastings
Airshed meets NES: No more than 3 exceedances by 2016 and no more that 1
exceedance by 2020
|
Annual
reporting against NES for Air Quality
|
|
HBRC
2014-15 Annual Plan - Part 2 Activivities
|
Attachment 3
|
Activity 3 – Water Management
|
Service Levels and Performance Targets
Activity
3–Water Management
|
|
Level
of Service Statement
|
Level
of Service Measure
|
Current
Performance
|
Performance
Targets
2014-15
|
Required
Actions to Achieve
Performance
Targets
|
|
HBRC
will increase its knowledge of the region’s water resources in terms of
quantity, quality and habitats so that a policy framework can be developed to
sustainably manage the water and land resources within Hawke’s Bay
|
State
of the Environment monitoring programme for:
Climate
River flows
Groundwater
levels
Surface water
quality
Groundwater water
quality
Aquatic
ecosystems
|
State of the
Environment monitoring network review:
· Climate - 2008
· River flows -
2009
· Groundwater
levels - 2008
· Surface water
quality - 2009
· Groundwater water
quality - 2008
· Aquatic
ecosystems - 2009
Gaps were
identified in climate and rainfall
|
2013-15
Establish one
climate station a year in response to identified requirement
Monitoring
undertaken in accordance with State of the Environment monitoring strategy
(reviewed in 2013/14 to reflect national reporting and regional
consistency)
Upgrade rainfall
sites as required to maintain level of service
|
Annual Monitoring
Performance Reports
Achieve Quality
Management System targets
|
|
Knowledge
available to inform environmental flow and allocatable volume review of the
following river catchments and groundwater basins:
Tukituki
River; Ngaruroro River; Karamu Stream; Tutaekuri River; Ruataniwha Plains ;
Heretaunga Plains
|
Information used
to determine minimum flows needs updating to ensure habitat protection.
Single factor assessments to determine environmental flows are no longer
appropriate
Groundwater
allocation regime proposed for Ruataniwha
Minimum flows
required to maintain identified values, including aquatic habitat, proposed
for Tukituki
Groundwater use
estimated for Ruataniwha basin
Draft groundwater
use report prepared for Karamu Stream catchment
|
2013-15
Groundwater abstraction
and allocation report prepared for Heretaunga Plains
Environmental
flow, and allocation reports prepared for the:
· Karamu Stream,
Tutaekuri River, Ngaruroro River and inflows to the Ahuriri Estuary
Coupled
surface-groundwater model built and running scenarios for Heretaunga
|
Undertake
Catchment Sensitivity Analysis
Increase
IFIM surveys
Increase
gauging
Groundwater/surface
water interaction gauging
Determine
methodology for in-stream assessment
Groundwater
model development for Heretaunga
|
|
Knowledge
available to inform review of water quality objectives and setting limits
|
Water quality
objectives and guidelines are contained in the Regional Resource Management
Plan
Water quality
limits required to maintain identified values, including aquatic habitat,
established for Plan Change 6 (Tukituki River catchment)
|
2013-15
Review of water
quality guidelines and objectives completed and reported
Water quality
requirements identified for recognised values, including aquatic habitat,
established for Heretaunga Plan Change catchments (Tutaekuri and Ngaruroro
Rivers, Ahuriri and Karamu Streams) and the Mohaka Plan Change catchment
|
Undertake
catchment sensitivity analysis
Review existing
plan guidelines
|
|
Knowledge
available to manage nutrient inputs to rivers
|
The effects of
nutrient inputs is known but information is needed on their source and
quantity.
Nutrient sources,
loads and fates determined for the Tukituki River catchment
|
2013-15
Report on
Nutrient limits: Ngaruroro River, Tutaekuri River, Karamu Stream
|
Develop
monitoring programmes for selected catchments
Undertake
catchment load analysis and limits based on regional and community values
|
|
HBRC
will encourage efficient and effective water use to maximise the benefits of
the water allocated
|
Number
of active water user groups
Implementation
of water efficiency tools by Water User Groups
|
Water User
Groups:
· Three formally
established and facilitated
· One potential
group under development
Ngaruroro,
Ruataniwha and Twyford Water User Groups engaged in efficiency projects i.e.
rationing and rostering and tree and vine calculator
Knowledge
transfer through meetings, Council presentations, and one on one assistance
|
2013-22
Continue to
establish and facilitate Water User Groups on a catchment priority basis
In conjunction
with Water User Groups, investigate and apply for research grants relating to
water use and resource allocation efficiency
Continue to transfer
latest water efficiency and allocation information to Water User Groups
|
Establish and
facilitate Water User Groups
Investigate and
apply for water efficiency and allocation research grants
Water User Group
facilitators to:
· keep up to date with
latest water related information from science and other council departments
and forward onto water user groups
· Ensure meetings
are held to transfer knowledge
|
|
|
Number
of consent holders with water meters operating using telemetry or web/text
systems
|
Water Information
Unit Established
Water metering
web/text water use web page developed
749
consents using web entry system
507
consents reporting water use via telemetry
|
2014-2019
Cumulative total
of 1200 consents using telemetry or a web entry system
|
Coordinate the
implementation of water metering across Hawke’s Bay
Establish and
maintain web entry and telemetry systems that encourage consent holders to
accurately report their water
Carry out
communication with the Hawke’s Bay irrigators to ensure a high level of
understanding of water metering requirements
Continue roll out
of verification programme of water meters in accordance with government
regulations
|
|
Hawke’s
Bay’s water resource is available for future generations
|
Allocation
limits and water quality limits
Implementation
of National Policy Statement for Freshwater Management
|
Regional Resource
Management Plan contains limits for some catchments. Limits in catchments
under resource pressure are currently being reviewed. Some catchments
are over allocated and some parts of the region have degraded water quality
and habitats
|
Refer
to other performance targets listed within this table
|
Annual Reporting
against National Policy Statement for Freshwater Management and Implementation
Plan
|
Activity 4
– Coastal Management
|
Service Levels and Performance Targets
Activity
4–Coastal Management
|
|
Level
of Service Statement
|
Level
of Service Measure
|
Current
Performance
|
Performance
Targets
2014-15
|
Required
Actions to Achieve Performance Targets
|
|
HBRC
will measure water quality at key recreation sites and make the results
available to ensure public health and safety
|
Recreational
water quality monitoring programme and website management
|
Weekly sampling
undertaken at 30 recreational water sites, information available on website
within 2 days of results being available
Faecal source
tracking at bathing sites that regularly exceed guidelines
|
Ongoing
Weekly monitoring
of key recreational sites as per recreational water quality monitoring plan
Recreational
water information available on website and social network site within 2 days
of results being available
Identification of
pollution sources for sites that regularly exceed guidelines
|
Undertaken
recreational
water quality monitoring in accordance with monitoring plan and national
guidelines
Regular
monitoring of key recreational sites
Undertake faecal
source tracking when sites exceed guideline values, communication with Land
Management, TLA and Public Health teams when results are obtained
|
|
HBRC will
continue to monitor, research and investigate coastal processes to inform
coastal planning including climate change and coastal hazards
|
Annual coastal
monitoring and investigation programme including:
Beach profiling
Storm monitoring
Sediment
transport and processes investigation and modelling
Hazard prediction
including tsunami, inundation, erosion, storm surge
|
Coastal
monitoring has been undertaken for at least 11 years
A research and
investigation programme was implemented in 2004
|
Ongoing
Annual monitoring
and investigation programme completed and reported each year
|
Prepare,
implement and report on coastal monitoring and investigation programme
|
|
HBRC will provide long term, relevant and
specific information on Hawke’s Bay’s coastal ecosystems, so that
it and the community can remain engaged with, and informed of, the current
state and potential threats to the health of coastal environments
|
Identify
the state and health of selected regional beaches, reefs and estuaries
Identify
the state and health of near-shore coastal waters and coastal sediments
Maintain
an operative and relevant Coastal Monitoring Strategy
|
Monitoring
undertaken according to the Coastal Monitoring Strategy (2006)
Annual reporting
on the state of regional estuaries and sandy beaches
6-weekly
monitoring of near-shore coastal water quality
|
Ongoing
Monitoring
undertaken in accordance with State of the Environment Monitoring Strategy
(2006) and reported on annually
2014-15
Five-year State
of the Environment report compiled
|
Implement and
report on monitoring as specified in the Coastal Monitoring Strategy (2006)
Comprehensive
State of the Environment reports compiled every five years
|
|
HBRC will increase its knowledge of
coastal ecosystems through targeted research and investigations so that it is
better able to understand and respond to the effects of activities on the
coastal environment
|
Undertaking
specific investigation and/or research, and reporting on these outcomes where
appropriate
|
Clive/Karamu
–Waitangi estuary and Ahuriri estuary/Taipo stream identified as
sites of special interest
|
Targeted
investigations into coastal receiving environments receiving stormwater
discharges
Saline transition
zones in Wairoa, Waitangi, Ahuriri and Mohaka estuaries will be investigated
(weather dependent)
|
Develop a work
programme to assess the effects of stormwater on coastal ecosystems
Describe the
seasonal movement of the saline wedge at a variety of HB rivers/estuaries
|
|
HBRC
2014-15 Annual Plan - Part 2 Activivities
|
Attachment 3
|
Activity 5 – Gravel Management
|
Service Levels and Performance Targets
Activity
5–Gravel Management
|
|
Level
of Service Statement
|
Level
of Service Measure
|
Current
Performance
|
Performance
Targets
2014-15
|
Required
Actions to Achieve
Performance
Targets
|
|
HBRC
will monitor and manage river-bed sediment to ensure flood protection schemes
work as expected
|
River
surveys (3-6 yearly) show all scheme rivers have sufficient capacity
|
Refer
to Heretaunga Plains Scheme and Upper Tukituki Scheme sections
|
Ongoing
No
decline in river flood capacity
|
Ongoing
Undertake gravel monitoring, assessment and extraction
programmes as desired in Regional Resource Management Plan
|
|
The
average riverbed level where gravel extracted is managed within +/- 200mm of
the design grade line
|
Average
riverbed within design grade range
|
Ongoing
Average
riverbed within design grade range
|
Ongoing
Undertake
river surveys every 3-6 years
|
|
No
incidences of erosion or flooding as a result of undesirable gravel levels
|
No
incidences
|
Ongoing
No incidences
|
Ongoing
Progress
a review of gravel issues
|
|
River-bed
gravel is equitably allocated to gravel extractors
|
The
gravel allocation process complies with the Regional Resource Management Plan
|
No
compliance issues
|
Ongoing
No
compliance issues with gravel extraction
|
Ongoing
Undertake gravel allocation process as proposed in the Regional
Resource Management Plan
|
|
River gravel
management activities have no significant adverse effects on river ecology
and water quality
|
No
reported incidences of adverse impacts following gravel extraction or beach
raking activities
|
No
reported incidences
|
Ongoing
No
reported incidences of adverse impacts following gravel extraction or beach
raking activities
|
Ongoing
Undertake
gravel management activities in compliance with Regional Resource
Management Plan, Ecological Management Plans and River Environment Code of
Practice
|
|
Knowledge
necessary for sustainable management of riverbed gravel is improved
|
Completion
of investigation and research work recommended in riverbed gravel scoping
study
|
Scoping
study completed in 2010. Investigation and research programme
|
Ongoing
Annual Programme of work completed
|
Ongoing
Undertake
investigations and research programmes
|
|
HBRC
2014-15 Annual Plan - Part 2 Activivities
|
Attachment 3
|
Activity 6 – Open Spaces
|
Service Levels and Performance Targets
Activity
6–Open Spaces
|
|
Level
of Service Statement
|
Level
of Service Measure
|
Current
Performance
|
Performance
Targets
2014-15
|
Required
Actions to Achieve
Performance
Targets
|
|
HBRC
will provide public access to, and manage existing Council owned parks and
wetlands for multi-purpose benefits
|
Levels
of service associated with all open space areas are set out in current
management plans
|
Current
management plans/ operation and maintenance contracts for:
Tutira
Country Park: expires 2014
Tukituki
wetland: expires 2014
Pakowhai
Country Park
HBRC
maintained cycleways
Management plans currently under review:
Pekapeka
wetland: expired 2010.
Waitangi
wetlands: expired 2012
|
Ongoing
Maintain a
current Open Space Vision and Management Plan and, where appropriate, further
development programmes for all open space areas and facilities
Implement
management plans to deliver levels of service established
|
Develop
management plans/ operation and maintenance contracts as required
Maintain
and develop areas in accordance with management plans
|
|
HBRC
will actively look for opportunities to provide the public with opportunities
to enjoy open space available within the region with opportunities assessed
against the HBRC Open Space policy and evaluation criteria
|
Open
space policy and evaluation criteria
Note $745,000 remaining in HBRC open
space and community facilities to provide for opportunities
|
Community
facility and open space policy and evaluation criteria in place
|
Ongoing
Continue to
assess affordable open space opportunities in accordance with the open space
vision
Action any
opportunities approved by Council
2014-15
Investigate
open space development opportunities with the region’s territorial
authorities that align with visitor facilities and attractions and
meet policy and evaluation criteria
|
Establish levels
of service and management plans for all additional open space facilities
Open Space
network plan completed and adopted by Council. Development
opportunities being considered as part of individual regional park reviews
In response to
submission on 2013/14 Annual Plan, Council agreed to contribute up to $100k
to Central Hawke’s Bay pathway development
|
Introduction
Regulation
activities cover HBRC’s regulatory functions for resource use, building
dams and safe navigation of the region’s navigable waters.
The empowering
legislation for HBRC functions includes the Resource Management Act 1991, the
Local Government Act 2002, the Soil Conservation and Rivers Control Act 1941, the
Building Act 2004, the Foreshore and Seabed Act 2004, the Hazardous Substances
and New Organisms Act 1996, and the Maritime Transport
Amendment Act 2013.
Link to
Community Objectives
This group of
activities contributes to Council’s objectives for the regional community
in the following ways:
· An environment that is appreciated, protected and sustained for
future generations – by
enforcing rules and issuing resource consents which enable access and use of
natural and physical resources, based on sustainable management principles.
· A strong, prosperous and thriving economy – by permitting sustainable use of the natural and physical
resources through permitted activities within the rules and administering
resource consents.
· Safe and accessible recreational facilities – by considering recreation where appropriate when
assessing resource consents.
· A lifetime of good health and wellbeing – by protecting the natural environment, particularly fresh
water quality for drinking; fresh and coastal water quality for ecological
support and recreational purposes; and air quality.
Significant
Negative Impacts
The functions
of the Resource Management Act for this group of activities seek to balance the
requirement to safeguard the environment while providing for the social,
economic and cultural needs of the wider community.
In some
instances, decisions made on individual resource consents can enable economic
and social growth, while on other occasions it can limit such benefits.
The costs to
HBRC and individuals of implementing the RMA can be significant, if not kept to
actual and reasonable levels.
Expenditure
and Funding
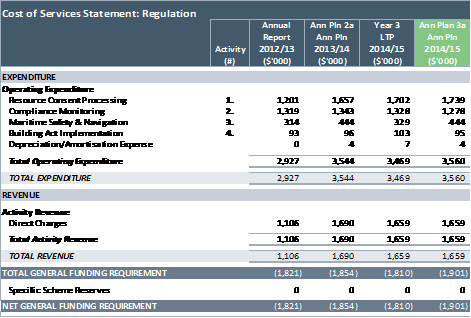
Net Funding Requirement: Regulation
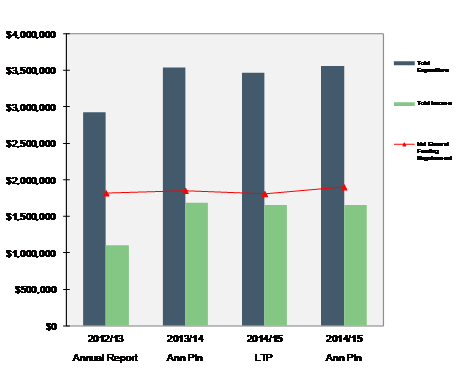
|
HBRC
2014-15 Annual Plan - Part 2 Activivities
|
Attachment 3
|
Activity 1 – Resource Consent Processing
|
Service Levels and Performance Targets
Activity
1–Resource Consent Processing
|
|
Level
of Service Statement
|
Level
of Service Measure
|
Current
Performance
|
Performance
Targets
2014-15
|
Required
Actions to Achieve
Performance
Targets
|
|
HBRC
will ensure that accurate information about resource consent requirements and
processes is readily available
|
Application
and submission guides are available in electronic and hard copy form
|
Currently
meeting all performance targets
|
2012-22
No
verified reports of inaccurate information being given in relation to
resource consent requirements
2012-22
Electronic
application and submission forms, application and submission guides are
available through HBRC’s website
|
Maintain
up-to-date application forms and information packs
|
|
HBRC
will process resource consent applications in a timely manner
|
100%
of resource consents processed within statutory timeframes set down in the
Resource Management Act 1991
|
100% of non-notified resource consents, 100%
of limited notified resource consents and 100% of notified resource consents
processed within statutory timeframes in the 2013/2014 financial year
|
2012-22
100%
of resource consents processed within statutory timeframes
|
Continued
tracking of Resource Management Act timeframes
Ensure
professional competency of staff to provide regulatory services
High
performance ratings achieved in the biennial Ministry for the Environment
Survey on Resource Management Act performance of Local Authorities
Maintain
clear communication with resource consent holders and applicants over
timelines, information requirements and consenting processes
|
Activity 2
– Compliance Monitoring
|
Service Levels and Performance Targets
Activity
2–Compliance Monitoring
|
|
Level
of Service Statement
|
Level
of Service Measure
|
Current
Performance
|
Performance
Targets
2014-15
|
Required
Actions to Achieve
Performance
Targets
|
|
HBRC will check that consent holders comply with the resource
consent conditions imposed to protect the environment
|
Number of consents monitored in accordance with the adopted
compliance monitoring strategy
|
91% of programmed inspections/reports completed in 2012/13
At the end of the 2012/13 year there were 4 consents that were
graded significant non compliance that were more than six months old and not
resolved
|
2012-22
90% of programmed inspections/reports completed each year
95% of monitored consents achieve an overall grading of full
compliance
|
Maintain an up-to-date compliance monitoring strategy which
reflects the level of risk to the environment
Annual Work programmes
|
|
HBRC will provide a 24 hr/7 day a week pollution response
service for reporting environmental problems
|
Duty management/Pollution Management response system
|
24 hour Duty management/Pollution Management response system in
place
|
2012-22
24 hour duty Management/pollution management response system
maintained
|
Appropriate appointments of staff to operate systems
|
Activity 3
– Maritime Safety & Navigation
|
Service Levels and Performance Targets
Activity
3–Maritime safety and Navigation
|
|
Level
of Service Statement
|
Level
of Service Measure
|
Current
Performance
|
Performance
Targets
2014-15
|
Required
Actions to Achieve
Performance
Targets
|
|
HBRC will provide local navigation safety
control of shipping and small craft movements and provide navigation aids to
ensure the region’s navigable waters are safe for people to use
|
The Navigation Safety Bylaws and Port and
Harbour Safety Management System
|
Bylaws
came into force on January 15th 2012. A number of incidents concerning
safety and compliance now require that parts of the bylaws must be reviewed
in 2014
A
Maritime New Zealand accredited Harbour Safety Management System for the
Napier Pilotage Area is valid until 2017
Engage
with commercial and recreational users to improve relationships
|
2012-22
Bylaws
to be reviewed in 2016
Maintain
a Maritime New Zealand accredited Harbour Safety Management System for the
Napier Pilotage Area
Marine
accidents and incidents are investigated and acted upon using education and
enforcement as appropriate
Region
wide risk assessment and review of current work programme with forward
looking recommendations by 1 July 2014
Review
community education effectiveness by 1 July 2014
Complete
installation of navigation aids at Pourerere
|
Hawke’s
Bay Regional Council provides an appropriately qualified and experienced
Harbourmaster
Review
human resources required to effectively carry out the Harbourmaster role
Maintain
Harbour Safety Management System. Monitor and enforce Navigation Safety
Bylaws
Review
resources required to enable effective enforcement of bylaws
|
Activity 4
– Building Act Implementation
|
Service Levels and Performance Targets
Activity
4–Building Act Implementation
|
|
Level
of Service Statement
|
Level
of Service Measure
|
Current
Performance
|
Performance
Targets
2014-15
|
Required
Actions to Achieve
Performance
Targets
|
|
Process
Building Act consent applications within timeframes
|
Contract
with Waikato Regional Council to process dam consents on behalf of HBRC
|
Contract
in place
|
2012-22
Maintain
contract with Waikato Regional Council, for the processing of dam building
consents
|
Maintain
contract
Review
Council’s preparedness for Building Act implementation
|
|
Maintain an
accurate Dam Register and help dam owners prepare dam safety assurance
programmes in accordance with Building Act timeframes
|
All
known dams have been recorded on the Dam Register, and dam owners informed of
Building Act requirements
|
All
known dam owners informed of Building Act requirements and timeframes
|
2012-22
100%
of dams comply with regulation requirements that come into force in July 2014
|
Maintain staff levels
and increase their knowledge of Building Act requirements
|
|
HBRC
will investigate illegally built dams and will ensure that they are removed
or made compliant
|
An
illegally built dam is made compliant or removed within six months of
identification
|
Any
illegally built dam is made compliant or removed within six months of
identification
|
2012-22
100%
of dams comply with regulations
|
Maintain
staff levels and increase their knowledge of Building Act requirements
|
|
HBRC
2014-15 Annual Plan - Part 2 Activivities
|
Attachment 3
|
Introduction
Animal and
plant pest control is carried out in accordance with HBRC’s Regional Pest
Management Strategy and the Biosecurity Act 1993.
Biosecurity
covers the inter-related programmes of:
· Regional animal pest control
· Regional plant pest control
· Contribution to TBfree NZ vector management and control programme
in HB.
· Development of regional pest management strategies and
contribution to national strategy issues.
Links to
Community Objectives
This group of
activities contributes to Council’s objectives for the regional community
in the following ways.
· An environment that is appreciated, protected and sustained for
future generations – by
providing an environment for restoring native biodiversity and ensuring that it
is maintained for future generations to enjoy.
· A strong, prosperous and thriving economy – by reducing the economic impact that pests have on
agricultural and horticultural production, and minimising the impact that the
presence of pests may have on economic growth.
· A lifetime of good health and wellbeing – by reducing the presence of pests that impact on human
health, and increasing Hawke’s Bay’s biodiversity for public
enjoyment.
Significant
Negative Impacts
Because Animal
pest control is undertaken using a range of methods including poisons and
traps, and Plant pest control can involve the use of agrichemicals there is the
potential for a number of non-target animal and plant species to be killed.
To offset
these potential negative impacts, HBRC ensures staff and contractors follow
good industry practice for biosecurity activities. Also, significant
biodiversity enhancement from pest control activities includes improved native
birdlife and revegetation of native flora. Increased regional economic returns
can also be expected to accrue through increased production and reduced pest
control costs when key pests are well managed.
If adequate
pest control is not carried out, pests can have significant adverse effects on lifestyles,
quality of living and primary productivity.
|
HBRC
2014-15 Annual Plan - Part 2 Activivities
|
Attachment 3
|
Expenditure
and Funding
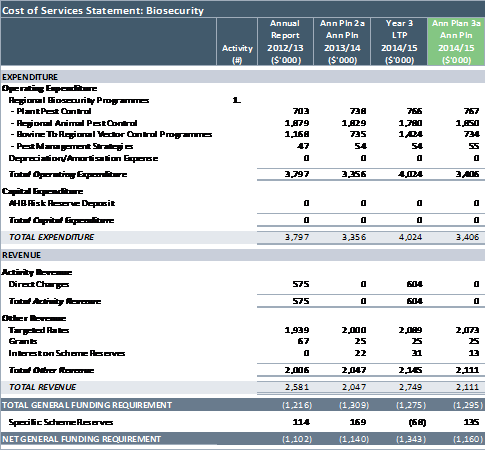
Net Funding Requirement: Biosecurity
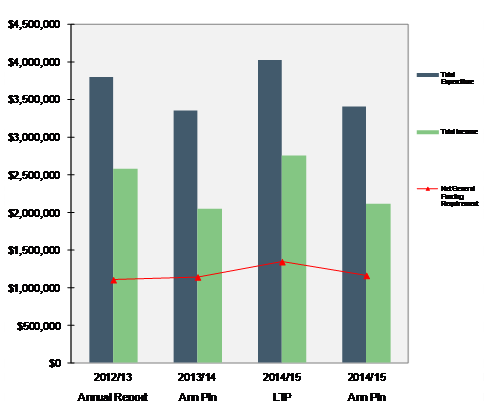
|
HBRC
2014-15 Annual Plan - Part 2 Activivities
|
Attachment 3
|
Activity 1 – Regional Biosecurity Programmes
|
Service Levels and Performance Targets
Activity
1–Regional Biosecurity Programme
|
|
Level
of Service Statement
|
Level
of Service Measure
|
Current
Performance
|
Performance
Targets
2014-15
|
Required
Actions to Achieve Performance Targets
|
|
HBRC
will provide effective pest management programmes that improve regional
biodiversity and economic prosperity
|
Regional Animal
Pest Control and Bovine Tb Vector Control Programmes
Hectares
of rateable land kept at low possum numbers. Low possum numbers means no more
than five possums caught per 100 traps set out at night
|
June 2012 Possum Control Area (PCA) programme: 467,000 ha
2012:
Animal Health Board programme over rateable land: 500,000 ha
Total: 967,000 ha
Monitoring
shows majority of areas under PCAs have trap catches less than 3%
|
By
2016 all rateable land will be reduced to low possum numbers (total rateable
land in Hawke’s Bay = 1,000,000 ha)
Rateable
land in transition from the Animal Health Board programme:
2014-15:
30,000 ha
2015-16:
40,000 ha
Rateable
land in Possum Control Area (PCA) Programme:
June 2014:
534,000 ha
Of
the PCAs monitored, less than 10% of the monitoring lines exceed 5% trap
catch
|
Ongoing
Transfer all
rateable land under Animal Health Board (AHB) vector control to the PCA
programme when AHB vector control stops
Ensure areas
under the PCA programme are maintained with low possum numbers by education,
encouragement and where necessary, compliance
Provide an
effective region wide possum control product subsidy scheme so materials are
readily available to occupiers undertaking their own control
Undertake possum
control along boundaries where there is a risk of re-infestation
Prepare an annual
trend and education monitoring programme for the following financial year
before 30 May
Where enforcement
action is required staff will issue “Notices of Direction” and
encourage land occupiers to comply with that Notice
Undertake
monitoring to confirm the compliance of no less than 10% of the area under
the PCA programme in any one year
|
|
The
number of active rook nests treated annually across the region
|
Current
performance 2012
North
of SH5 - 95 active nests treated
South
of SH5 - 686 active nests treated
|
Ongoing
Monitoring
indicates a downward trend in active rook nest numbers in both areas (North
and South of SH5)
|
Ongoing
Annually treat
every active nest in all known rookeries within Hawke’s Bay
Ground
control rooks where operational conditions permit
|
|
Response
time to rabbit complaints/enquiries
|
An
initial response is given within 5 working days of receipt of each rabbit
related complaint/enquiry
|
Ongoing
An
initial response is given within 5 working days of receipt of each rabbit
related complaint/enquiry
|
Maintain regional
rabbit night count and Rabbit Haemorrhagic Disease (RHD) monitoring programme
Provide advice
and education to occupiers where they wish to reduce rabbit or hare impacts
on their property
Record and
respond to property owner complaints where rabbits are damaging neighbouring
properties.
Management plans
for properties above McLean Scale 4; identify the cost benefits of
undertaking control measures necessary for effective long term management on
that property and any risks of not undertaking control to reduce numbers
below McLean Scale 4
|
|
Responsiveness
to properties identified with rabbit populations over McLean Scale 4
|
Management
Plans prepared within 4 months of identification
|
Ongoing
A
management plan is prepared within four months for each property identified
with rabbit numbers above McLean Scale 4
|
|
Plant Pest Control
Routine
plant pest inspections of areas infested with plants controlled under HBRC
Regional Pest Management Strategy
|
All
known infestations of ‘service delivery’ Total Control plant pest
sites visited annually and plants controlled
All
known infestations of ‘occupier responsibility’ visited annually
Land
around all known infestations of total control plants inspected at least
every 3 years
All
areas of high potential risk visited annually and checked for possible new
plant pest incursions
|
Ongoing
All
known infestations of ‘occupier responsibility’ Total Control
plant pest sites are visited annually
All
known ‘service delivery’ Total Control plant pest sites are
visited annually and plants controlled.
All
Privet sites identified through complaints controlled within 6 months of complaint
The
land around all known infestations of Total Control plants is inspected at
least every 3 years
All
areas of high potential risk are visited annually and checked for possible
new plant pest incursions
|
Ongoing
Undertake at
least annual control on all ‘service delivery’ Total Control
plant pests to prevent their seeding
Undertake
monitoring to measure ‘service delivery’ Total Control plant
pests
Record outputs
for key ‘service delivery’ plant pests (Privet and Pinus
Contorta)
Record
all total control plant visit numbers
|
HBRC
will develop and implement regional pest management strategies that improve
biodiversity and economic prosperity
Pest
Management Strategies |
Maintain a
current Regional Pest Management Strategy
Current
strategy in place until 2017
|
2013-2015
Review the current Regional Pest Management Strategy (RPMS) and
complete new Plan by 2015
|
Review
of current Regional Pest Management Strategy to be completed during 2014/15
|
|
Undertake
research and investigation to quantify and/or increase the economic,
biodiversity or animal/human health benefits of pest control
|
At
least one new initiative undertaken annually
|
Ongoing
Undertake at least one research/investigation initiative
annually
|
Ongoing
Buy
new releases of biological control agents where appropriate
Implement
research/investigation to help deliver or quantify the effectiveness of the
biosecurity programme
|
|
HBRC
2014-15 Annual Plan - Part 2 Activivities
|
Attachment 3
|
Introduction
Emergency
Management covers a range of activities to meet Civil Defence and natural
hazard management responsibilities. These activities aim to: identify potential
hazards to the community and the means of reducing their impact; prepare the
community for potential civil defence emergencies; and assist with the response
to and recovery from any emergencies that occur.
HBRC
administers both the Hawke’s Bay Civil Defence Emergency Management Group
and the Coordinating Executive Group, both of which have responsibilities for
the implementation of the Hawke’s Bay Group Civil Defence Emergency
Management Plan.
The relevant
legislation for this function of HBRC is the Civil Defence Emergency Management
Act 2002 and the Resource Management Act 1991.
Links to
Regional Community Objectives
This group of
activities contributes to Council’s objectives for the regional community
in the following ways.
· An environment that is appreciated, protected and sustained for
future generations – by
providing sound advice on rainfall and water flows during flood conditions and
hazard information for land use planning purposes.
· A strong, prosperous and thriving economy – by enhancing community resilience through the promotion
of community response plans and business continuity planning.
· Strong regional leadership and a sense of belonging – by co-ordinating groups of organisations, and ensuring
their understanding of and collaborative contribution to community resilience
and emergency response and recovery activities.
· Supportive, caring and inclusive communities – by providing advice that enables individuals to make
sound decisions on the risk they are willing to live with and assisting with
their effectiveness to respond and recover from a disaster.
· A lifetime of good health and wellbeing – by providing flood warning and forecasting and
information on how to reduce hazards to encourage community resilience and
preparedness.
Significant
Negative Impacts
There are no
significant negative impacts on the environment as a result of the
activity. As a result of research to date, there are now restrictions on
development in some areas to avoid hazards, such as coastal erosion, flooding
and earthquakes, which have impacts on the cultural and social aspects of the
community. However the positive impacts on long term health, safety and
economic sustainability are considered to outweigh the potential negative
social impacts.
|
HBRC
2014-15 Annual Plan - Part 2 Activivities
|
Attachment 3
|
Expenditure and Funding
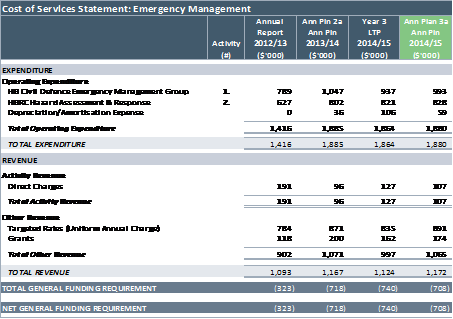
Net Funding Requirement: Emergency Management
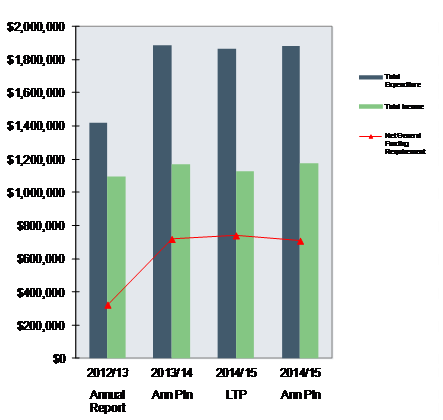
|
HBRC
2014-15 Annual Plan - Part 2 Activivities
|
Attachment 3
|
Activity
1 – HB Civil Defence Emergency Management Group
|
Service Levels and Performance Targets
Activity
1– HB Civil Defence Emergency Management Group
|
|
Level
of Service Statement
|
Level
of Service Measure
|
Current
Performance
|
Performance
Targets
2014-15
|
Required
Actions to Achieve
Performance
Targets
|
|
HBRC will reduce the impact of long term natural and man-made
hazards to life and property, eliminating these risks if practicable, and if
not seek the reduction of their impact
|
Assessment of natural and manmade hazards will be completed for
at risk areas in Hawke’s Bay
|
As part of the Hawke’s Bay Civil Defence Emergency Management
(HBCDEM) Plan:
A
hazardscape, (or landscape of hazards) assessment has been completed
Priorities
to reduce the impact of hazards are identified
A
work programme to identify and reduce the impact of hazards is approved
Hawke’s Bay Joint Hazard Strategy for Local Authority
Land-use Planning completed
|
2012-22
Advocate
to Territorial Authorities for the consideration and inclusion of hazard
information as part of their land use planning functions
In
conjunction with TLAs, provide public advice on the impacts of hazards
Complete
changes to the Resource Management Act 1991 statutory plans
that reflect the integrated approach of the Joint Hazard Strategy
|
Review
and implement the Hawke’s Bay Civil Defence Emergency Management Plan
Advocate
coordination between the HBRC works programme and the readiness priorities in
the HBCDEM Plan
Become
involved in TLA planning processes under the RMA
Provide
public advice through a range of media (internet/public forums)
|
|
Number
of hazards research projects commissioned each year
|
At
least one new research project commissioned each year, for example, tsunami
inundation modelling and fault line mapping for Wairoa completed 20 October
2011
|
2012-22
At least one new
research project commissioned each year
|
Commission
research every year based on HBRC Hazard Research Plan and priorities set out
in the Hawke’s Bay Civil Defence Emergency
Management Plan
|
|
Percentage
of surveyed residents that are aware of hazard risks and can identify
earthquake, flooding, and tsunami as major hazards in Hawke’s Bay
|
Survey
2008 asked residents to identify hazard risk to their livelihood:
94% identified
earthquake
60% identified
flooding/heavy rainfall
34% identified
tsunami
|
2012-22
Awareness of
earthquake, flooding/heavy rainfall and tsunami hazard risks show an increase
over time
Specific target
is: more than 50% of residents can identify tsunami as one of the
region’s major hazards by 2018
As measured in a
3 year survey
|
Prepare and
implement a communications plan to target hazards to highlight in a promotion
Promote hazard
awareness through public displays such as tsunami and 1931 earthquake
displays and produce hazard education material
Community Survey
every three years
|
|
Satisfaction
of Territorial Authorities and professionals involved in land use planning
decision making with the quality, format and relevance of hazard information
supplied
|
Hazard
Research Bibliographic Database available online and several research
projects commissioned and completed including tsunami, faultline and flood
modelling
Territorial
Authorities surveyed 2011 - 83% said information was relevant and the quality
of information was rated high
|
2012-22
All Territorial
Authorities and planning professionals are satisfied with the quality, format
and relevance of hazard information supplied/available as assessed by an
evaluation and feedback form every three years
|
Continue work to
identify sources of hazards and ensure this information is collected, sorted,
recorded, and stored in a relevant manner
Actively
encourage best practice on hazard avoidance/mitigation by ensuring
territorial authorities and professionals involved in land use planning
decision making are informed of relevant hazards and risks
|
|
HBRC will maintain and where appropriate increase the readiness
of Hawke’s Bay Civil Defence Emergency Management (HBCDEM) and the
community to respond to a civil defence emergency
|
HBRC response to a Civil Defence emergency is coordinated,
appropriate, effective and efficient
|
A region-wide exercise is held every three years with all HBCDEM
Group agencies
|
2012-22
Complete
HBCDEM Group Training Directive
Maintain
three yearly exercise programmes
Corrective
Actions that the HBCDEM group has responsibility for are implemented in
accordance with the Corrective Action Plan
|
Review
and implement HBCDEM Plan. Exercise programme maintained and exercise reports
completed with Corrective Action Plans
Support
the operation and engagement of the Training Advisory Group
Support
Territorial Authorities in completing Community Response Plans for specific
communities
|
|
The level of support provided to the HBCDEM Group in directing
and co-ordinating personnel and resources for response and recovery
operations
|
Adopted HBCDEM Group Plan is in place
|
2012-22
An
active Welfare Advisory Group which meets at least 4 times a year
|
Review
of HBCDEM Plan
Maintain
and support the HBCDEM Joint Committee and Chief Executives Group
Maintain
and support the HB Welfare Advisory Group
|
|
The percentage of surveyed residents prepared to cope for at
least three days on their own
|
Civil
Defence Emergency Management (CDEM) Group website is maintained with
information on preparedness
Current
advertising programme
90%
surveyed residents said they had enough food stored for three days and had
some way of cooking without electricity
Over
55% had enough water stored not including water in hot water cylinders
|
2012-22
90%
residents have enough food stored for three days and had some way of cooking
without electricity
75%
have enough water stored
As
measured by three yearly survey
|
Maintain
and develop information and materials that support the Group Website, regular
radio advertising and other promotional opportunities in accordance with
communications strategy
Support
the National “Get ready, Get thru” programme and national
“Get Ready” week
Maintain
Interagency Communication Group who develop and implement a programme of
public CDEM education
Survey
the community every three years
|
|
HBRC will ensure that appropriate levels of response
capabilities are in place and maintained across the Hawke’s Bay Civil
Defence Emergency Management (HBCDEM) Group
|
Established Emergency Management Plans including training and
procedures
|
HBCDEM
Group Plan and Standard Operating Procedures are implemented
Established
Group Emergency Operations Centre with supported training programme
|
2012-22
Maintain
Plans and Standard Operating Procedures and ensure Group Emergency
Coordination Centres can be ready for operation within six hours of event
Effectively
and efficiently manage any emergency events from initial warning until a safe
situation returns
|
Ensure
Plans and procedures confirm agency roles and responsibilities for good
co-ordination
Maintain
two Group Emergency Coordination Centres (Hastings and Napier) which are
ready for operation, with supporting Group Standard Operating Procedures
Conduct
training for staff assigned to Group emergency management roles
|
|
Maintain the CDEM
Group’s emergency management and civil defence capacity with the
capability of effectively responding to an emergency event
|
Established
Emergency Management Team and training programme in place
|
2012-22
Maintain
established teams, training programmes, Emergency Operations Centre, Manuals,
in accordance with HBCDEM Group Plan
|
HBRC
staff have been assigned emergency management roles and are having training
annually
Effectively
and efficiently manage any emergency event from initial warning until a safe
situation returns
|
|
HBRC will ensure the recovery from emergencies is managed
in accordance with the scale of the event
|
Facilitate and maintain Lifelines Group who have effective input
into Civil Defence Emergency Management (CDEM) Group plans
Dedicated CDEM Group Recovery Manager appointed
A relevant CDEM Group Recovery Plan is adopted and maintained
|
The
Lifelines Group currently has lost momentum
The
CDEM Group has no appointed Recovery Manager or specific Recovery Plan
|
2012 – 2022
Partner
Territorial Authorities have appointed local recovery managers
|
Provide
strategic guidance for Group Recovery Plan as part of the review of the CDEM
Group Plan
Review
and support Lifelines Group
|
|
|
|
|
|
|
|
|
|
HBRC
2014-15 Annual Plan - Part 2 Activivities
|
Attachment 3
|
Activity 2 – Hazard Assessment & Hawke’s Bay
Regional Council Response
|
Service Levels and Performance Targets
Activity
2– Hazard Assessment & Hawke’s Bay Regional Council Response
|
|
Level
of Service Statement
|
Level
of Service Measure
|
Current
Performance
|
Performance
Targets
2014-15
|
Required
Actions to Achieve
Performance
Targets
|
|
HBRC
will ensure it has an emergency response capability that can provide regional
hazard assessments and warning systems to the Civil Defence Emergency
Management (CDEM) Group and to manage Council assets
|
Effectiveness
of response capacity and capability
|
HBRC
maintains an emergency management and civil defence capacity capable of
responding effectively to an emergency event
|
Ongoing
Maintain
established Teams, training programmes, Emergency Operations Centre, Manuals
and Business Continuance Plan
|
Annual training
and management of teams.
Annual
maintenance of Emergency Operations Centre Manuals and Business Continuity
Plans
|
|
24
hour duty management system is in place
|
24
hour Duty Management warning and response system with capacity to scale up
for emergency response is in place
|
Ongoing
Operate
an effective 24-hour Duty Management Service and respond to urgent public
enquiries and complaints in a timely professional manner
|
Maintain log of
duty calls along with record of warning and watches of severe weather or
other hazardous events managed
|
|
HBRC
provide reliable warning of flooding from the region’s major rivers to
at risk communities in the Wairoa, Tutaekuri, Ngaruroro and Tukituki areas
|
Percentage
of time that priority telemetered rainfall and river level sites are
operational throughout the year
Priority sites:
98%
Overall: 92%
|
Priority
sites were operational for 2011-12:
Priority sites:
97.9%
Overall: 97.8%
|
Percentage
of time that priority telemetered rainfall and river level sites are operational
throughout the year:
2012-19: 98% average for all key
sites
|
Regular checking
and maintenance of all rainfall and level recorder stations
Repair of all key
sites damaged during storms within four weeks
Programme to
double the number of priority sites to increase operation reliability over 10
year period
|
|
A flood
forecasting system is available on the web to advise the community on likely
rainfall and flooding
|
Percentage
of the region at risk of flooding from large rivers, covered by a flood
forecasting model
|
60%
of the region’s floodplains are covered with a flood forecasting model
|
Percentage
of the region covered by a flood forecasting model
2014-15: 70%
2021-22: 100%
|
Continue to
develop and upgrade flood forecast models of flood plain areas
|
|
Computer
models reflect what happens during a flood event and give up to two hours
highly reliable forecasting, up to 12 hours moderately reliable forecasting
and 48 hours total forecast
|
Ongoing
No decrease in
model performance
|
Continue to
survey rivers to update models every six years
Calibrate models
to significant storm events
|
|
Information
available on HBRC’s website during storm events
|
Web
information is updated every three hours during significant (greater than
five Year) storm events
|
Ongoing
No change
|
Programme for web
information during storm events maintained
|
|
Peak
flood forecast river flows agree within 25% of the actual flows
|
25%
|
Ongoing
No decrease in
performance.
|
Calibration of
models to significant storm events.
|
|
HBRC
will continue to improve its knowledge and understanding of flood risks from
the areas exposed to severe weather events and the effects of runoff onto low
lying land and into the network of drains, streams and rivers of the region
|
Percentage
of area mapped for flood hazard, including the impact of climate change
|
Up
to date flood hazard information is available for 96.9% of high risk
community areas, and 20% of the lower risk community areas
|
2014-15:
100%
To update flood
hazard information for high risk communities
2021-22:
100%
Up to date flood
hazard information available for lower risk communities
|
Identification of
high flood risk areas
Programme of
collection and distribution of flood hazard information for high and low risk
areas
|
|
HBRC
will to respond to oil spills within the Hawke’s Bay Coastal Marine
boundary and maintain a Tier 2 oil spill response plan which identifies
priority areas in HB for protection in the event of a major spill
|
Current
Tier 2 Oil Spill Plan is in place and training is being implemented
|
Current
Tier 2 Oil Spill Response Plan is in place and a programme of appropriate
training and exercises in accordance with the provisions of the plan and the
requirements of the Maritime
Transport Act 1994 has
been undertaken over previous years
|
Operative Marine
Oil Spill Plan is maintained, along with trained personnel
|
Annual training
and management of teams
Annual
maintenance plan
|
|
HBRC
2014-15 Annual Plan - Part 2 Activivities
|
Attachment 3
|
Introduction
Transport
covers planning, provision of passenger transport, and coordination and
provision of road safety initiatives across Hawke’s Bay.
The driving
force is the Regional Land Transport Strategy and the Regional Land Transport
Programme, which the Regional Transport Committee is required to prepare.
The Land
Transport Act 1998 and the Land Transport Management Act 2003 and its Amendment
Act 2008, require HBRC to consider the transport needs of disadvantaged people.
In September 2011, HBRC adopted a Regional Public Transport Plan to address
this and guide it in providing a passenger transport system that provides good
quality local public services for the people of Hastings and Napier.
HBRC operates
a Total Mobility Scheme that provides a subsidised taxi service for people with
serious mobility constraints by way of taxi vouchers.
Links to
Regional Community Objectives
This group of
activities contributes to Council’s objectives for the regional community
in the following ways.
· An environment that is appreciated, protected and sustained for
future generations – by
taking into account demand for future public bus services and environmental
considerations in transport planning with the Hastings District Council and
Napier City Council.
· A strong, prosperous and thriving economy – by providing reliable and secure public transport
infrastructure.
· Transport, infrastructure and services that are safe, effective
and integrated – by providing
public transport services; integration with other modes of transport (for
example walking and cycling); and road safety programmes.
· Strong regional leadership and a sense of belonging – by providing increased opportunities for social
interaction; travel options for the workforce; and more access to essential
services and amenities.
· Safe and accessible recreational facilities – by increased
opportunities for social interaction and travel options for the workforce;
greater access to essential services and amenities; and ensuring integration with walking and cycling opportunities.
· A lifetime of good health and wellbeing – by reducing traffic congestion and providing an
environmentally sustainable choice of transport.
Significant
Negative Impacts
There are no
anticipated significant negative impacts from this group of activities which
seek to provide an integrated, safe and efficient transport network.
Expenditure
and Funding
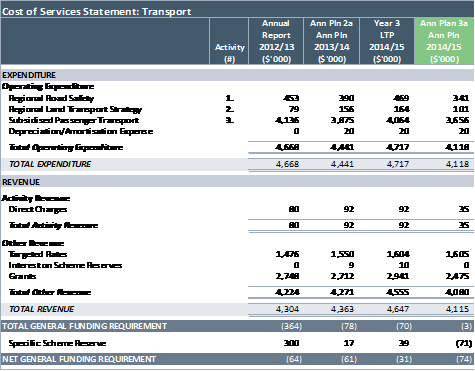
Net Funding Requirement: Transport
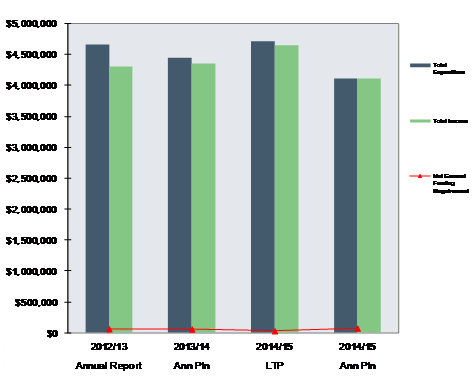
|
HBRC
2014-15 Annual Plan - Part 2 Activivities
|
Attachment 3
|
Activity 1 – Regional Road Safety
|
Service Levels and Performance Targets
Activity
1– Regional Road Safety
|
|
Level
of Service Statement
|
Level
of Service Measure
|
Current
Performance
|
Performance
Targets
2014-15
|
Required
Actions to Achieve
Performance
Targets
|
|
HBRC will engage, co-ordinate and implement sustainable regional
road safety initiatives so that Hawke’s Bay roads and pathways are safe
and accessible, and that the emotional and financial costs of road traffic
crashes are reduced
|
Effectively implement Regional Safety Action Plans with the
relevant objectives of the Regional Land Transport Strategy; Safer Journeys
2020; and the New Zealand Injury Prevention Strategy
|
Quarterly
reviewed and updated Regional Safety Action Plans (RSAP) for Wairoa, Napier,
Hastings, and Central Hawke’s Bay
RSAPs
co-ordinated road safety initiatives involving engineering, enforcement and
education. Key stakeholders include:
· Territorial
authorities
· NZ
Police
· Hawke’s
Bay District Health Board
· Accident
Compensation Corporation
· New
Zealand Transport Agency
· Community
groups responsible for the allocation, monitoring and contract management of
New Zealand Transport Agency funding
|
2013-22
Regional
Safety Action Plans for Wairoa, Napier, Hastings, and Central Hawke’s
Bay will be reviewed quarterly with a focus on key issues to be addressed
Road
safety programmes are implemented to reduce the incidence and severity of
road traffic crashes and to align with the key outcomes and issues in the
RoadSafe Strategic Plan
|
Hold
quarterly review meetings with Territorial Authorities and key road safety
partners to ensure Regional Safety Action Plans are relevant and up to date
Undertake
a six monthly review of the RoadSafe Strategic Plan to ensure all goals,
outcomes and objectives are relevant and take into account key road safety
issues identified in the Safer Journeys Report, Communities at Risk Register
and the New Zealand Transport Agency briefing notes
|
|
HBRC
2014-15 Annual Plan - Part 2 Activivities
|
Attachment 3
|
Activity 2 – Regional Land Transport Strategy
|
Service Levels and Performance Targets
Activity
2– Regional Land Transport Strategy
|
|
Level
of Service Statement
|
Level
of Service Measure
|
Current
Performance
|
Performance
Targets
2014-15
|
Required
Actions to Achieve
Performance
Targets
|
|
Through
the region’s transport strategy HBRC will promote improved integration
of all transport modes, land use and efficient movement of freight
|
Approved
Regional Land Transport Strategy in place
|
Adopted
in June 2012
|
2014-15
Implement
and report on current RLTS as required by statute
2015
RLTS
to be replaced by Regional Land Transport Plan (includes Strategy and
Programme) completed by July 2015 following public consultation
|
Freight
movement in and out of Hawke’s Bay and efficient movement of traffic is
addressed through implementation of key strategic projects
Monitor
and report on achievements from the RLTS to the Regional Transport Committee
Begin
RLTS and RLTP review process in early 2014 for, as part of development of
Regional Land Transport Plan for public consultation
|
|
Three
yearly Regional Land Transport Programme approved
|
This
document was incorporated into the Regional Land Transport Strategy and
adopted in June 2012
|
2013-15
Implement
and report on Regional Land Transport Programme 2012-15 as required by
statute
2015-18
Regional
Land Transport Plan submitted to New Zealand Transport Agency by July 2015,
following public consultation
|
Monitor
the Regional (R) funds spending to ensure it is spent on key projects for the
region
|
Activity 3
– Subsidised Passenger Transport
|
Service Levels and Performance Targets
Activity
3– Subsidised Passenger Transport
|
|
Level
of Service Statement
|
Level
of Service Measure
|
Current
Performance
|
Performance
Targets
2014-15
|
Required
Actions to Achieve
Performance
Targets
|
|
HBRC
will provide an accessible bus service and appropriate service infrastructure
within and between the Napier, Hastings and Havelock North urban areas that
will be expanded to meet the increasing need for public transport for the
people of Hawke’s Bay
|
In
accordance with Regional Land Transport Strategy
|
Services
are delivered on regular demand-driven basis, to ensure the needs of the
transport disadvantaged are considered
|
2013-15
Build
on the improvements made over the last 3 years and ensure current levels of
services are maintained and target any increase in funding towards improving
existing services
|
Continue
to regularly market current services and increase awareness of all services
Increase
patronage and subsequent fare recovery to make improvements viable, to
achieve bus fare recovery rates of:
2014-15:
40%
|
|
Continue
improving signage, infrastructure and information at all bus stops
|
Major
improvements have been made in Hastings and Napier; more work is yet to be
done in Napier to provide better timetable information at bus stops
|
2013-14
Implement
bus-stop service level standards (as outlined in Regional Public Transport
Plan)
2013-15
Install
four additional bus shelters each year (two in Hastings and two in Napier)
|
Work
with the Napier City and Hastings District Councils to implement the bus-stop
service level at key bus stops
Work
with Napier City and Hastings District Councils to agree on the best
locations for bus shelters each year
|
|
Where
bus routes exist, at least 90% of residences and businesses are in the
following walking distances of a bus stop:
500m:
normal conditions
600m:
low density/outer areas
|
About
85% compliance in Hastings and 60% in Napier
|
2013-15
Increase
the number of bus stops in Hastings and Napier to meet the measure in
the Regional Public Transport Plan
|
Ongoing
survey to ensure appropriate infrastructure at key bus-stops
Work
with Napier City and Hastings District Councils to meet targets
|
|
Changes
in technology to be utilised to provide a better service
|
Smartcards
were implemented in 2009 but no further technology opportunities have been
implemented
|
2014-15
Investigate
online top-ups for smartcards
|
Take
advantage of changes in ticket systems that allow for online top-ups
|
|
Fare
payment systems are to be simple to understand; reviewed regularly and
accurately record passenger trip information
|
Fare
levels will be reviewed annually
|
Fare
structure last reviewed in February 2012
|
2013-19
Fare
reviews to be undertaken annually
|
Review fares
annually
|
|
Integration
with other modes
|
Improve
integration between public transport and walking and cycling
|
Integration
made possible by the installation of bike racks on buses on major routes.
|
2013-15
Investigate
further opportunities for installation of secure bike racks at major
bus stops
|
Investigate
other initiatives around the country
Work
with Napier City and Hastings District Councils to improve integration
between public transport and walking and cycling
|
|
Continue
to provide and deliver the Total Mobility scheme in Napier, Hastings and
Waipukurau for those unable to use public transport due to serious mobility
constraints
|
Membership
is increased and service delivered in accordance with New Zealand Transport
Authority guidelines
|
2012-13
69,000
trips made using Total Mobility vouchers
|
2013-15
Increase
by at least 5% a year
|
Actively
promote the Total Mobility Scheme
Work
with government and disability agencies to better understand and try to meet
the needs of their clients
|
|
HBRC
2014-15 Annual Plan - Part 2 Activivities
|
Attachment 3
|
Introduction
Hawke’s
Bay Regional Council’s (HBRC) Governance and Community Engagement role
and responsibilities involve decision-making, keeping regional residents
informed, and ensuring that Hawke’s Bay people have a meaningful say on
the direction of their region.
This group
covers:
· Strategic Alliances - HBRC working with a range of organisations -
central government, university, private sector groups and councils - to provide
valued services and research that is targeted and efficient.
· Community Engagement and Communication - encompasses all HBRC
purposes and functions and engagement with a broad range of stakeholders in the
general community through a variety of media.
· Response to Climate Change – some of the measures that HBRC
either has in place or proposes to introduce to contribute to lowering carbon
emissions in Hawke’s Bay.
· Community Representation and Regional Leadership – Council
elections and the role of Councillors in representing their constituent
communities, plus providing opportunities for individuals and groups to
influence decision-making.
· Investment Company Support – the management and
administration support provided to the Hawke’s Bay Regional Council
Investment Company Ltd.
Links to
Regional Community Objectives
This group of
activities contributes to Council’s objectives for the regional community
in the following ways.
· Strong regional leadership and a sense of belonging, supportive,
caring and inclusive communities – by the 9 Councillors representing their constituent communities
across Hawke’s Bay; by reflecting community views on policies considered
by the Council; by managing the complexity associated with new relationships
and the associated change processes; and by reducing the carbon footprint of the region and providing
strategies to enable the community to adapt to those changes.
· An environment that is appreciated, protected and sustained for
future generations – by
working closely with primary sector associations, Treaty of Waitangi settlement
groups and government departments to provide for greater catchment/community
based management of the environment.
· A strong, prosperous and thriving economy – by actively engaging with the business community and
providing information and knowledge in regular publications; by supporting
Tourism Hawke’s Bay and participating in Business Hawke’s Bay,
through funding from the Regional Economic Development Rate; by highlighting
opportunities associated with climate change.
· Transport, infrastructure and services that are safe effective and
integrated – by working toward
energy efficient ways of travelling and doing business.
· A lifetime of good health and wellbeing – by providing resilience to changes that will occur as a
result of climate change.
· Strong regional leadership and a sense of belonging – by setting reduced emission targets to lessen
HBRC’s carbon footprint.
Significant
Negative Impacts
There are no
anticipated significant negative impacts from this group of activities.
|
HBRC
2014-15 Annual Plan - Part 2 Activivities
|
Attachment 3
|
Expenditure
and Funding
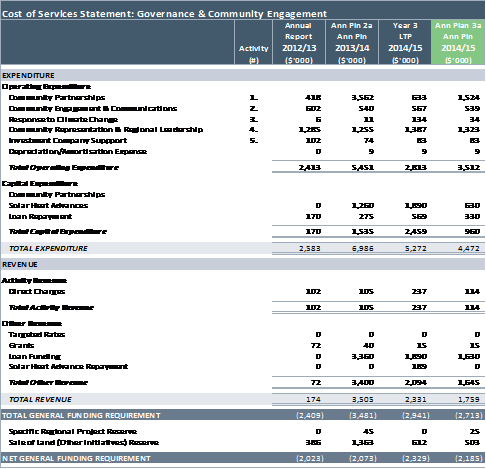
Net Funding Requirement: Governance and Community Engagement
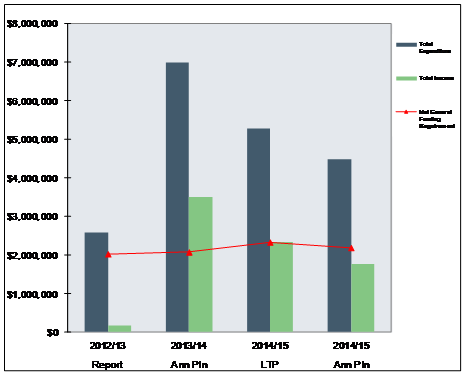
|
HBRC
2014-15 Annual Plan - Part 2 Activivities
|
Attachment 3
|
Activity 1 – Community Partnerships
|
Service Levels and Performance Targets
Activity
1– Community Partnerships
|
|
Level
of Service Statement
|
Level
of Service Measure
|
Current
Performance
|
Performance
Targets
2014-15
|
Required
Actions to Achieve
Performance
Targets
|
|
HBRC
will engage in strategic relationships that help better achieve its vision
and purposes
|
Formalisation
of strategic alliances that are sector and institutionally-based
|
HBRC
provides grant funding to a range of organisations with no formal
requirements on performance or reporting
|
2012-15
Create
a bi-annual forum of primary production sector associations
2016-22
HBRC
continues to work in partnership with strategic allies to progress strategic
goals
|
Primary
associations’ sector alliance to be formally developed and meetings
scheduled
Shared
service arrangements are identified and agreed to
|
|
HBRC
will work in partnership with treaty claimant groups to govern natural
resources and to jointly explore sustainable economic opportunities in
Hawke’s Bay
|
Regional
Planning Committee operating successfully
|
HBRC’s
Maori Standing Committee is currently consulted in relation to a range of
Council activities
|
2014-15
Regional
Planning Committee permanently established
|
Legislation
to be passed to permanently establish Hawke’s Bay Joint Regional
Planning Committee
|
|
HBRC
will contribute to support the development of Regional Public Infrastructure
projects
|
Evaluation
of Regional Public Infrastructure projects and which ones to support
|
Limited
financial assistance has been provided to a number of Infrastructure projects
|
2014/15
- $0.5M
provision for the Wairoa Community Centre upgrade
- $0.5M
provision for Te Mata Park Visitor and Educational Centre
|
Requests
received and evaluated and funding assigned to projects
|
|
HBRC
2014-15 Annual Plan - Part 2 Activivities
|
Attachment 3
|
Activity 2 – Community Engagement & Communications
|
Service Levels and Performance Targets
Activity
2– Community Engagement & Communications
|
|
Level
of Service Statement
|
Level
of Service Measure
|
Current
Performance
|
Performance
Targets
2014-15
|
Required
Actions to Achieve
Performance
Targets
|
|
HBRC
will communicate its purpose and direction to the community. The community
will know what it is being done and why
|
On-time
delivery of Annual Plan, plan change, State of the Environment and statutory
documents
|
2012-22
Long Term Plan, State of the Environment, 2012-13 Annual Report, 2013-14
Annual Plan
|
2014-15
Long
Term Plan, State of the Environment, Annual Report, Tukituki Plan change
|
Annual review of
statutory document timing and appropriate engagement tools
|
|
Councillors,
Executive Management and staff available to speak/inform on HBRC activities
|
2012-13:
As requested
|
2014-15
Measure
number of interactions
|
Convert
to blog/online dialogue as appropriate
Maintain
focus on media and face-to-face engagement
Initiate a system to count
interactions
|
|
Number
of media releases generated; uptake of digital technologies
|
2012-13: 148
HBRC releases Active use of HBRC website, social media, video and images
|
2014-15
90
Releases; Number of social media posts
|
Adopt digital tools as
appropriate, including social media, with increasing use of video
|
|
Regional
newsprint media coverage averages > 90% positive/neutral
|
2012-13:
97.0% pos/ neutral (to end 2012)
|
2014-15
Not
less than 95% average pos/neutral
|
Regular
review of Risk Management profile
Maintain Communication Plans for
key work programmes
|
|
Service Levels and Performance Targets
Activity
2– Community Engagement & Communications
|
|
Level
of Service Statement
|
Level
of Service Measure
|
Current
Performance
|
Performance
Targets
2014-15
|
Required
Actions to Achieve
Performance
Targets
|
|
HBRC
will provide opportunities for the community to be involved in its decision
making processes. Community engagement will be a key component of all major
programmes and projects
|
Number
of council meetings and workshops
|
2012-13:
Council/Committee 16+33; Public Excluded sessions seven; Workshops four
|
2014-15
Open
reporting of Council/ Committee items
|
Maintain focus on transparency and manage
Council workshop and public exclusion expectations
|
|
Clearly
flagged opportunities for input, submissions and other feedback into HBRC
documents
|
Ad hoc selection
of appropriate communication tools
Engagement process not clearly understood
by HBRC staff (and community)
|
2014-15
Refresh and
maintain annual HBRC Communications Plan
|
Adopt Structured engagement
process enabling transparency of communication tool selection, visible to
staff and the community (published)
|
|
Number
of public meetings, workshops and public events (includes awards and field
days)
|
2012-13:
six public meetings (Tukituki Choices), four Annual Plan public meetings; six
public events (other)
|
2014-15
Meetings,
workshops and events strongly considered for major projects and in
HBRC’s statutory role
|
Focus
on opportunities for community engagement and public participation
|
|
HBRC
will provide information that is relevant to the community and communities of
interest. Information will be audience appropriate
|
Delivery of updates on HBRC activities and progress
|
2012-13: 4 region newsletters, 4 ‘mini’ newsletters,
community newsletters
|
2014-15
Generate
region, community and consent holder/ catchment newsletters
|
Maintain and measure community engagement across key HBRC
programmes
Use
surveys and market research tools as appropriate
|
|
Facilitation of agreed stakeholder groups
|
2012-13:
97 strategic and stakeholder groups
|
2014-15
Audit
number of groups
|
Work effectively
with stakeholder groups
|
|
Timely delivery information to communities of interest
|
Perceived ad hoc timing/distribution of targeted communication
|
2014-15
Appropriate
‘tool’ selected according to programme needs
|
Adopt structured and
transparent timing, visible to all stakeholders and interested parties
|
|
HBRC
2014-15 Annual Plan - Part 2 Activivities
|
Attachment 3
|
Activity 3 – Response to Climate Change
|
Service Levels and Performance Targets
Activity
3– Response to Climate Change
|
|
Level
of Service Statement
|
Level
of Service Measure
|
Current
Performance
|
Performance
Targets
2014-15
|
Required
Actions to Achieve
Performance
Targets
|
|
HBRC
will increase the community’s resilience to climate change
|
HBRC’s
corporate total annual Greenhouse Gas emissions measure in carbon dioxide
equivalents (excluding Port of Napier Ltd)
|
885
tonnes carbon dioxide equivalent based on 2005-06 figures (excluding Port of
Napier Ltd)
|
2012-22
Reduce
corporate (excluding Port of Napier Ltd) carbon emissions from 2005/06 by:
· 10% by
2014
· 20% by
2020
· 30% by
2050
|
Monitor
and report on HBRC carbon emissions
Quantify
current and future carbon off-sets
|
|
Number
of sectors through which HBRC promotes / influences reduction in carbon
emissions and adaptation to climate change
|
HBRC
works with:
The
primary production sector on sustainable farming initiatives
The
urban community to reduce energy use, improve air quality and improve human
health through the ‘clean heat’ initiative and the Solar Hot
Water Scheme
|
2013
Establish
a process to monitor and report regional carbon emissions with the first
report completed by 30 June 2013
Funding
for conversion of 100 dwellings to solar hot water
2013-19
Continue
to increase HBRC’s influence in initiatives to improve regional
resilience to the impacts of climate change
Continue
to update and report regional carbon emissions at least every three years
|
Establish
a process to monitor and report on regional carbon emissions
Proactively
seek initiatives through which HBRC is able to influence or promote a
reduction in regional carbon emissions
Proactively
seek opportunities to make investments that provide a satisfactory return and
result in sustainable use of the region’s resources for HBRC’s
investment portfolio
Establish
appropriate financial procedures for the repayment of loans through voluntary
targeted rates
|
|
HBRC
2014-15 Annual Plan - Part 2 Activivities
|
Attachment 3
|
Activity
4 – Community Representation & Regional Leadership
|
Service Levels and Performance Targets
Activity
4–Community Representation & Regional Leadership
|
|
Level
of Service Statement
|
Level
of Service Measure
|
Current
Performance
|
Performance
Targets
2014-15
|
Required
Actions to Achieve
Performance
Targets
|
|
HBRC
will provide the community with a channel for representation through elected
members and Iwi to enable access and influence on decision making
|
Councillors’
attendance at monthly Council and Committee meetings achieving at least 90%
attendance of elected and appointed members
|
Attendance
rate for Regional Council meetings is 95% and for other Committees,
attendance of 90% has been achieved
|
2012-22
Attendance rate
of 90%
|
Monitoring and
recording attendance
|
|
Attendance
at Maori Committee meetings
|
The
current attendance rate for the Maori Committee is 80%
|
2012-22
Attendance rate
of 80%
|
Monitoring and recording attendance
|
|
10
Year Plan/Annual Plan consultation during April and May with the final Plan
being adopted by HBRC by 30 June
|
5
weeks for consultation has been achieved and two days for HBRC to hear
submitters to the Annual Plan, allowing for adoption of the Plan by 30 June
|
2012-22
Consultation and
submission period of at least 25 working days
|
The
scheduling of at least 25 working days for consultation during April/May
Scheduling
of up to three days in June to hear submissions
Adoption of the Plan by 30 June
|
|
Comply
with the provisions of the Local Electoral Act 2001
|
Core
provisions of that Act have been met
|
2013-14
Elections were
held on the 12 October 2013
|
|
|
HBRC
will aim to maximise Local Government effectiveness and efficiency
|
Facilitate and report on Local Government
efficiencies achieved
|
A
number of shared service initiatives covering some Local Government services
have been completed
|
2014-15
HBLASS
Ltd (the Hawke’s Bay local authority shared services company) meets the
target specified by its shareholder councils in the company’s Statement
of Intent
|
Development of business cases for further
shared services opportunities between the region’s councils
|
|
HBRC
2014-15 Annual Plan - Part 2 Activivities
|
Attachment 3
|
Activity 5 – Investment Company Support
|
Service Levels and Performance Targets
Activity
5–Investment Company Support
|
|
Level
of Service Statement
|
Level
of Service Measure
|
Current
Performance
|
Performance
Targets
2014-15
|
Required
Actions to Achieve
Performance
Targets
|
|
HBRC
will provide support services to the Investment Company and to any associated
subsidiaries of the Investment Company
|
A
number of Board meetings to be supported by HBRC staff
|
Appointed
the Transitional Board of the Investment Company.
|
2012-22
Provide
support for the Board meetings of the Investment Company and subsidiaries
Confirm the
Statement of Corporate Intent each year
|
Ensure the
company’s statutory requirements are met
Prepare Company
Board Agendas
Keep records
including Board Minutes
Ratify the
Statement of Corporate Intent submitted by the investment company
|
|
HBRC 2014-15 Annual Plan -
Part 3 Financial Information
|
Attachment 4
|
Contents Page
Summary of Significant Accounting Policies........................................ 1
Significant Forecasting Assumptions................................................... 7
Forecast Financial
Statements........................................................... 15
Comprehensive Income Statement........................... 16
Statement of Changes in Equity................................. 17
Balance Sheet........................................................... 18
Cash Flow Statement................................................ 10
Notes........................................................................ 20
Financial Metrics.............................................................................. 29
Rate Movements.............................................................................. 31
Funding Impact
Statement................................................................ 32
Explanation of Rating
Method........................................................... 38
Details of Targeted
Rates Calculated................................................. 41
Resource Management
Charges........................................................ 51
Building Act Charges......................................................................... 59
Maritime Transport
& Navigation Safety Charges.............................. 60
Charge Rates and Other
Information................................................. 61
Glossary........................................................................................... 63
|
HBRC
2014-15 Annual Plan - Part 3 Financial Information
|
Attachment 4
|
Summary of Significant Accounting Policies
The Hawke's
Bay Regional Council, formed on 1 November 1989, is a regional local authority
governed by the Local Government Act 2002.
The
prospective financial statements presented are for the 12 month period
beginning on 1 July 2014 and have been prepared in accordance with Sections 95
and 111 of the Local Government Act 2002.
HBRC has not
presented group prospective financial statements because we believe that parent
prospective financial statements are more relevant to readers. The main purpose
of prospective financial statements in an Annual Plan is to provide readers
with information about the core services that HBRC intends to provide to its
ratepayers; the expected cost of those services, and as a consequence how much
is required by way of rates to fund the intended levels of service. The level
of rates funding required is not affected by subsidiaries except to the extent
that HBRC obtains distributions from, or further invests in, those
subsidiaries. Such effects are included in the prospective financial
statements.
The principal
accounting policies applied in the preparation of these prospective financial
statements are set out below. These policies have been consistently applied to
all the years presented, unless otherwise stated.
1 Basis of Preparation
The financial
statements have been prepared in accordance with generally accepted accounting
practice in New Zealand for public benefit entities adopting New Zealand
equivalents to International Financial Reporting Standards (NZ IFRS) and
applicable New Zealand Financial Reporting Standards. The statements have been
prepared under the historic cost convention, as modified by the revaluation of
land and buildings, infrastructure assets, available-for-sale financial assets,
financial assets and liabilities at fair value through profit and loss and investment
property. HBRC’s functional currency is New Zealand dollars (NZD) and the
statements have been presented in thousands of NZD exclusive of New Zealand
Goods and Services Tax (GST). Trade accounts payable and receivable are stated
at GST inclusive amounts.
2 Inventories
Inventories
are stated at the lower of cost (using the weighted average cost method) and
net realisable value.
3 Trade Receivables
Trade
receivables are recognised initially at fair value and subsequently remeasured
each balance sheet date at amortised cost using the effective interest method
less provision for impairment.
4 Plant, Property and Equipment
i. Operational Assets
HBRC land and
buildings are shown at fair value less subsequent accumulated depreciation,
based on periodic, but at least triennial, valuations by independent,
professionally qualified valuers on the basis of market information.
Hydrological
equipment is shown at fair value less subsequent accumulated depreciation,
based on periodic, but at least triennial, valuations by suitably experienced
HBRC employees, on the basis of depreciated replacement cost.
Independent, professionally qualified valuers review all such valuations.
All other
operational assets are stated at historical cost less accumulated depreciation.
Historical cost includes expenditure that is directly attributable to the
acquisition of the items.
The costs of
assets constructed by HBRC include the cost of all materials used in
construction, direct labour on the project and an appropriate amount of
directly attributed costs. Costs cease to be capitalised as soon as the asset
is ready for productive use.
ii. Infrastructure Assets
Infrastructure
assets are tangible assets that are necessary to fulfil HBRC’s
obligations in respect of the Soil Conservation and Rivers Control Act 1941 and
the Drainage Act 1908. Such assets usually show some or all of the following
characteristics:
· They are part of a system or network that could not provide the
required level of service if one component was removed.
· They enable HBRC to fulfil its obligations to the region’s
communities in respect of flood control and drainage legislation.
· They are specialised in nature and do not have alternative uses.
· They are subject to constraints on removal.
Infrastructure
assets are shown at fair value less subsequent accumulated depreciation, based
on periodic, but at least triennial, valuations by suitably experienced HBRC
employees, on the basis of depreciated replacement cost. Independent,
professionally qualified valuers review all such valuations.
iii. Subsequent Costs
Subsequent
costs are included in the asset’s carrying amount or recognised as a separate
asset, as appropriate, only when it is probable that future economic benefits
associated with the item will flow to HBRC and the cost can be measured
reliably. All other repairs and maintenance are charged to the income statement
during the financial period in which they are incurred.
iv. Revaluation Adjustments
Increases in
carrying amounts arising from revalued assets are credited to revaluation
reserves in equity. Decreases that offset previous increases of the same asset
classes are charged against revaluation reserves in equity. All other decreases
are charged to the income statement.
Any
accumulated depreciation at the date of revaluation is eliminated against the
gross carrying amount of the asset and the net amount is restated to the
revalued amount of the asset.
v. Other Adjustments
Gains and
losses on disposals are determined by comparing proceeds with carrying amount.
These are included in the income statement. When revalued assets are sold, the
amounts included in revaluation reserves are transferred to the accumulated
balance in equity.
5 Investment
Property
Investment
property is residential and commercial land and buildings held to earn rental
income and for capital appreciation. Such property is carried at fair value,
representing open market value determined annually by independent,
professionally qualified valuers. A gain or loss in value is recorded in the
income statement for the period in which it arises.
Under the
Hawke’s Bay Endowment Land Empowering Act 2002, rental income that HBRC
is beneficially entitled to from certain endowment land in Hawke’s Bay
can only be used for the improvement, protection, management or use of Napier
Harbour or the Regional Council’s coastal marine area as defined in
section 2 (1) of the Resource Management Act 1991. Unspent funds are held in
the Coastal Marine Area Reserve Fund.
6 Forestry
Crops
Forestry crops
are measured at their fair value less estimated point-of-sale costs each
balance sheet date by independent, professionally qualified valuers. Fair value
is determined by the present value of expected net cash flows discounted by the
current market-determined pre-tax rate. A gain or loss in value is recorded in
the income statement for the period in which it arises.
7 Financial
Assets
Financial
assets are initially designated into one of the four following categories set
out below, depending on the purpose for which the financial asset was acquired.
At each balance sheet date, all financial asset designations are re-evaluated.
i. Financial Assets at Fair Value
Through Profit or Loss
Financial
assets are classified in this category if acquired principally for the purpose
of selling in the short term or are so designated by management. The category
includes derivatives and has two sub-categories: financial assets held for
trading, and those designated at fair value through the profit and loss at
inception. Assets held in this category are classified as current assets if
they are either held for trading, or are expected to be realised within 12 months
of balance sheet date.
Financial
assets in this category, including derivatives, are initially recognised at
fair value and are measured at each balance sheet date at fair value. Realised
and unrealised gains or losses in value are recorded in the income statement
for the period in which they arise.
ii. Loans and Receivables
Loans and
receivables are non-derivative financial assets with fixed or determinable
payments that are not quoted in an active market. They arise, for example, when
HBRC makes community loans. They are included in non-current assets except when
maturities are shorter than 12 months from balance sheet date.
Financial
assets in this category are initially recognised at fair value plus transaction
costs that are directly attributable to their acquisition or use. At each
balance sheet date these financial assets are measured at amortised cost using
the effective interest method. Realised and unrealised gains or losses in value
are recorded in the income statement for the period in which they arise.
iii. Held-to-Maturity Investments
Held-to-maturity
investments are non-derivative financial assets with fixed or determinable
payments and fixed maturities that management have a positive intention and
ability to hold to maturity.
Financial assets
in this category are initially recognised at fair value plus transaction costs
that are directly attributable to their acquisition or use. At each balance
sheet date these financial assets are measured at amortised cost using the
effective interest method. Realised and unrealised gains or losses in value are
recorded in the income statement for the period in which they arise.
iv. Available-For-Sale Assets
Available-for-sale
financial assets are non-derivative financial assets that are either designated
in this category or are not classified in any of the other categories. They are
included in non-current assets unless there is an intention to dispose of the
investment within 12 months of balance sheet date.
Available-for-sale
financial assets are carried at fair value using a quoted price if an active
market exists or using discounted valuation techniques if no active market
exists. Any gain or loss in value is recognised directly in equity through the
statement of changes in equity for the period in which it arises.
When an
available-for-sale financial asset is sold, the accumulated fair value
adjustments are included in the income statement.
At each
balance sheet date, an assessment is made whether there is any objective
evidence that a financial assets or group of financial assets is impaired. If
objective evidence of impairment exists for available-for-sale financial
assets, then any cumulative loss is transferred from equity to the income
statement. Such a transfer is not reversible.
8 Intangible
Assets
Intangible
assets comprise acquired computer software licences. All intangible assets with
finite lives are carried at the historical cost incurred to acquire and bring
into use the specific software less accumulated depreciation.
9 Impairment
of Non Financial Assets
Assets that
have an indefinite useful life are not subject to amortisation and are tested
for impairment at each balance sheet date. Assets that are subject to
amortisation are reviewed for impairment whenever events or changes in circumstances
indicate that the carrying amount may not be recoverable.
An impairment
loss is recognised in the income statement for the amount by which the
asset’s carrying amount exceeds its recoverable amount. The recoverable
amount is the higher of an asset’s fair value, less costs to sell and
value in use. For the purposes of assessing impairment, assets are grouped at
the lowest levels for which there are separately identifiable cash flows.
10 Depreciation
Land is not
depreciated. Depreciation on other assets is calculated using the straight-line
method to allocate their cost or revalued amounts to their residual values over
their estimated useful lives. Assets’ residual values and useful lives
are reviewed, and adjusted if appropriate, at each balance sheet date. Major
depreciation periods are:
|
Asset
Category
|
Years
|
|
Buildings
|
10
- 100
|
|
Site
Improvements
|
10
- 40
|
|
Vehicles
|
3
- 10
|
|
Plant
& Equipment
|
3
- 25
|
|
Computer
Equipment
|
4
- 10
|
|
Computer
Software & Licenses
|
3
- 5
|
|
Infrastructure
Assets
|
25
- 70
|
No
depreciation is provided for stop banks, berm edge protection, sea or river
groynes, drainage works or unsealed roads. These assets are not considered to
deteriorate over time and, therefore, will provide a constant level of service
unless subjected to a significant flood event.
11 Cash
and Cash Equivalents
Cash and cash
equivalents include cash in hand, deposits held at call with banks, other
short-term highly liquid investments with original maturities of three months
or less, and bank overdrafts. Bank overdrafts are shown within borrowings in
current liabilities in the balance sheet.
12 Borrowings
Borrowings are
recognised initially at fair value, net of transaction costs incurred.
Borrowings are subsequently stated at amortised cost. Any difference between
the proceeds (net of transaction costs) and the redemption value is recognised
in the income statement over the period of the borrowings using the effective
interest method. Borrowings are classified as current liabilities unless the
group has an unconditional right to defer settlement of the liability for at
least 12 months after the balance sheet date.
13 Income
Tax
HBRC’s
income is exempt from tax except for amounts derived from any
council-controlled organisation or port company or subsidiary port company.
14 Employee
Benefits
Short-term
employee benefits including salaries and wages, annual leave and contributions
to superannuation schemes are recognised when they accrue to employees and are
measured at undiscounted cost.
The liability
for accumulating sick leave is stated as the cost of sick leave that is
expected to be used.
Long-term
employee benefits including long service leave and retirement gratuities are
recognised at the present value of HBRC’s obligation at balance sheet
date.
15 Provisions
Provisions are
recognised when:
· HBRC has a present legal or constructive obligation as a result of
past events, and
· It is more likely than not that an outflow of resources will be
required to settle the obligation, and
· The amount has been reliably estimated.
Provisions are
not recognised for future operating losses.
16 Revenue
Recognition
Revenue
comprises the fair value for the sale of goods and services, net of GST,
rebates and discounts. Revenue is recognised as follows.
· Sales of goods are recognised when a product is sold to a
customer. A sale occurs when the goods are delivered to the customer. The
recorded revenue is the gross amount of the sales.
· Sales of services are recognised in the accounting period in which
the services are rendered, by reference to the completion of the specific
transaction assessed on the basis of the actual service provided as a
proportion of the total service provided.
· Interest income is recognised on a time proportion basis using the
effective interest method.
· Dividend income is recognised when the right to receive payment is
established.
· Government grants are recognised as income when eligibility has
been established by the grantor agency.
· Rates are recognised as income in the accounting period in which
they are set and assessed.
17 Leases
Leases in
which a significant proportion of the risks and benefits of ownership are
retained by the lessor are classified as operating leases. Payments made under
operating leases are charged to the income statement net of any incentives
received from the lessor on a straight-line basis over the period of the lease.
18 Financial
Risk Management
HBRC’s
activities expose it to a variety of financial risks including:
· Market risk, including currency risk, fair value interest rate
risk and price risk
· Credit risk
· Liquidity risk
· Cash flow interest-rate risk.
Council’s
overall risk management programme focuses on the unpredictability of financial
markets and seeks to minimise potential adverse effects on its financial
performance. HBRC uses derivative financial instruments such as foreign
exchange contracts to hedge certain exposures.
HBRC enters
into foreign currency forward exchange contracts to hedge foreign currency
transactions, when purchasing major property, plant and equipment and when
payment is denominated in foreign currency.
HBRC has no
significant concentrations of credit risk. We have policies in place to
ensure that services are provided to customers with an appropriate credit
history.
Collateral or
other security is not required for financial instruments subject to credit
risk.
19 Accounting
for Derivative Financial Instruments and Hedging Activities
Derivatives
are initially recognised at fair value on the date a derivative contract is
entered into and are subsequently remeasured at the fair value at each balance
sheet date.
Where HBRC
determines that it will hedge a transaction it documents at the inception of
the transaction the relationship between hedging instruments and hedged items,
as well as the risk management objective and strategy for undertaking various
hedge transactions.
HBRC also
documents that assessment, both at inception and on an ongoing basis, of
whether the derivatives that are used in hedging transactions are highly
effective in offsetting changes in fair values of hedged items.
i. Cash Flow Hedge
The effective
portion of changes in the fair value of derivatives that are designated and
qualify as cash flow hedges are recognised in equity. The gain or loss relating
to the ineffective portion is recognised immediately in the income statement.
HBRC accounts for hedges of foreign currency risk of a firm commitment as cash
flow hedges.
ii. Derivatives that Do Not Qualify for Hedge
Accounting
Certain
derivatives instruments do not qualify for hedge accounting and changes in the
fair value of these instruments are recognised immediately in the income
statement.
Any changes in
the fair value of interest rate swaps due to changes in interest rates are
recognised in the income statement in the period in which they occur.
20 Foreign
Currencies
Transactions
in foreign currencies are translated at the New Zealand rate of exchange ruling
at the date of the transaction. At balance sheet date foreign monetary assets
and liabilities are translated at the closing rate and exchange variations
arising from these are included in the income statement.
21 Basis
of Allocation of HBRC’s Indirect Costs
Clearly
identifiable costs are directly charged against each activity. Indirect costs
are allocated to cost centres in the first instance under a variety of methods
including:
· Floor area occupied
· The number of full time equivalent employees
· Assessed use of various services provided.
These costs
are then charged to projects on a labour standard costing basis. The allocation
unit is each working hour charged by employees at a pre-determined rate.
Variances arising from this method will be allocated on the same basis as for
costs of a fixed nature referred to above. Project costs are then summarized
for each activity and group of activities.
22 Cautionary
Note
The forecast
financial statements are prepared based on best estimates available at the time
of preparing the accounts. Actual results are likely to vary from information
presented and the variations may be material.
The purpose of
this draft plan is to consult with the community on the spending priorities
outlined within it, and may not be appropriate for any other purpose.
|
HBRC 2014-15 Annual Plan - Part 3
Financial Information
|
Attachment 4
|
Significant Forecasting Assumptions
These
significant forecasting assumptions are taken directly from the Long Term Plan
2012-22. As the LTP was completed over 2 years ago a number of these
assumptions require updating to reflect current Council policy and financial
markets. Any changes to these assumptions can be found in Part 1
of this plan under the heading “Explanatory Notes of Changes between
Year 3 of the LTP 2012-22 and Annual Plan 2014/15”.
Introduction
In preparing
the Long Term Plan for 2012-22 a number of assumptions and predictions about
the future have been made. There are always inherent risks with such
forecasting, therefore it is important that the main assumptions used in these
forecasts are identified. This section has been designed to identify these
assumptions, and explain the risks associated with such assumptions.
A number of
additional assumptions are highlighted in the significant activity section of
this plan.
HBRC
Activities and Functions
HBRC will
continue to perform our existing functions in accordance with current
legislation and current Council policies. These functions will be primarily
carried out to meet our statutory role and responsibilities and to help meet
the community outcomes as developed by the community. This plan links community
outcomes to HBRC activities within each group of activities.
General
Assumption
HBRC has not
taken into account forecast changes in population, economic activity or climate
change. It is considered that the impact of any changes in these statistics
will have a minimal or very low effect on the plan’s projections.
A significant
disaster event, particularly a flood, may have a major impact on the work
programmes set out in this Annual Plan. Following such an event, HBRC will
focus on response to community needs that arise as a result of the event and
community recovery following the event.
Interest Rates
Information
received from HBRC’s bankers, the Bank of New Zealand, in January 2012
indicated that the interest rate assumptions below for borrowing would be
appropriate for inclusion on the plan:
· The interest rate on future term borrowing between 2012 and 2022
is estimated to be between 6.50% and 7.50%. Accordingly, rates of 6.50% for
2012/13, 7.00% for 2013/14 and a rate of 7.50% for the remaining years have
been assumed in this plan.
Information
received from the Bank of New Zealand in January 2012 indicated that the
official cash rate may gradually rise from its current low level of 2.5% to
4.5% by June 2014. HBRC cash investments and term deposits accomplish an
average margin of 1.50% over the official cash rate. The following rates of
interest on deposits have been used in this plan:
· For the 2012/13 financial year – 4.15%
· For the 2013/14 financial year – 5.20%
· For the remainder of the plan until 30 June 2022 – 5.75%.
Cost
Adjusters
All
expenditure projections in the Income Statements and assets in the Balance
Sheet are stated in 2012/13 dollar values; however, for the year 2013/14 and
subsequent years of the plan, the following adjustments (Table 1) have been
made to allow for the effect of inflationary pressures on costs.
|
Table 1: Cost Adjusters
|
|
Year
|
Wages, Salaries & other Salary Related Costs
|
External Expenditure
|
Assets
|
|
Annual (%)
|
Cumulative (%)
|
Annual (%)
|
Cumulative (%)
|
Annual (%)
|
Cumulative (%)
|
|
2013/14
|
2.4
|
2.4
|
3.2
|
3.2
|
3.2
|
3.2
|
|
2014/15
|
2.4
|
4.9
|
3.2
|
6.5
|
3.1
|
6.4
|
|
2015/16
|
2.6
|
7.6
|
3.4
|
10.1
|
3.3
|
9.9
|
|
2016/17
|
2.6
|
10.4
|
3.5
|
14.0
|
3.4
|
13.6
|
|
2017/18
|
2.4
|
13.0
|
3.4
|
17.9
|
3.1
|
17.2
|
|
2018/19
|
2.3
|
15.6
|
3.3
|
21.7
|
3.1
|
20.8
|
|
2019/20
|
2.6
|
18.6
|
3.3
|
25.8
|
3.3
|
24.8
|
|
2020/21
|
2.7
|
21.8
|
3.6
|
30.3
|
3.6
|
29.3
|
|
2021/22
|
2.7
|
25.1
|
3.5
|
34.8
|
3.6
|
33.9
|
|
*These
assets include infrastructure, land, buildings, hydrological assets and
Hawke’s Bay Regional Investment Company Limited equity and are derived
using an average price change from each of the asset categories.
|
The above rates have been
taken from the Business and Economic Research Ltd (BERL) forecasts of price
level adjustors, dated September 2011.
It is not anticipated that
there will be any significant variations over the inflation provisions when
HBRC re-tenders for maintenance and other contracts during the term of the
plan.
Investments
Establish the Investment Company
The investment
company, Hawke’s Bay Regional Investment Company Limited (HBRIC Ltd) has
been established and activities commenced on 1 February 2012. Initially
governance of the HBRIC Ltd will be by a Transition Board of Directors who will
complete its establishment and move the company through early evaluations of
potential investment projects in water storage and harvesting. This board will
be replaced by a full board from 1 January 2014 which will direct the
company’s affairs thereafter.
HBRIC Ltd will
initially own HBRC’s shareholding in Port of Napier Limited and be funded
by equity wholly owned by HBRC and advances provided by it from time to time.
Future investments will be funded from a mixture of equity and advances
(provided to HBRIC Ltd at no less than HBRC’s cost of borrowing).
Investment Activities
During the course of the
Long Term Plan, investment of around $186M (constant 2012 dollars) is proposed
to be made in new and existing investments in water storage and harvesting
(Ruataniwha Plains and Ngaruroro), commercial property and logistics services
(Rail: Port Hub) through advances to HBRIC Ltd, with further investment in hill
country forestry as a wholly owned activity of HBRC being accounted for on
HBRC’s Balance Sheet.
|
Table
2: Major Proposed Investments
|
|
Proposed Investment
|
Construction Start
|
Begin
Operations
|
Expected
Rate of Return
|
|
Ruataniwha Plains
|
July 2014
|
January 2018
|
6%
|
|
Ngaruroro River
|
January 2015
|
January 2018
|
6%
|
|
Rail - Port Hub
|
July 2014
|
July 2016
|
7.5%
|
|
Forestry
|
N/A
|
July 2013
|
7%
|
Indicative timeframes for
the major proposed investments are shown in Table 2.
(Note: as a result of low carbon prices, the Hill Country
programme has been put on hold.)
While these
projects are expected to yield cash income once they start operations, they
will be accruing holding costs on funds advanced by HBRC at the interest rate
it paid for its borrowings until they are operational.
Funding Investments
These investments will funded by:
· Drawing down existing cash reserves.
· Selling interests in existing leasehold properties.
· Additional borrowings.
· Securing Central Government contributions to specific investment
projects.
Funds are
proposed to be realised from leasehold properties in Napier by:
· Selling freeholds to existing lessees at discounts ranging from
10%-17% from lessors interest up until 30 June 2012; and then,
· Selling the residual cash flows from rents paid by the remaining
leaseholders to an investor by 31 December 2012.
Funds are also
expected to be generated from the sale of the existing portfolio of HBRC-owned
Wellington leasehold properties during the 2012-2013 financial year.
Where HBRC
borrows to fund the proposed investment, it is assumed that these borrowings
will be on an interest only basis. When these investments yield a commercial
return on funds invested, loans will be renegotiated to reflect some capital
payments.
Forestry
During the
course of the LTP, HBRC will manage the following forestry assets.
|
Table
3a: Forestry Assets- Carbon Forestry Investments
|
|
Site Name
|
Area (ha)
|
Significant
Assumptions
|
|
Wastewater
Investments: CHB
|
180
|
- Carbon Price of
$20/tonne
- Return on use of
funds based on HBRC’s borrowing rates as set out in this policy
- Farmers will
uptake Hill Country planting at a rate that allows the annual planting
targets to be made
- Hill Country: A
planting rate of 1,600ha per annum will be sustained for years 8-10 of the
LTP
|
|
Waste
Water Investments: Mahia
|
35
|
|
Waihapua
|
250
|
|
Hill
Country
|
Year
1: 500
Year
2: 1,000
|
|
Table
3b: Forestry Assets – Forestry Investments
|
|
Site Name
|
Area (ha)
|
Significant
Assumptions
|
|
Tangoio
|
320
|
20ha
will be harvested in the next two years with a further 20-30ha harvested in
2019-20
(Note 20 ha harvested in early 2014)
|
|
Tutira
|
140
|
140ha
will be progressively harvested starting in 2018-19
|
|
Tutira: Manuka
Honey Plantings
|
150
|
That
the actual investment returns from UMF honey will be not reduce significantly
over the life of the investment and will be similar to those projected
|
These forestry
investments are restated to fair value each year; however, for the purposes of
this plan the ‘property’ price adjusters as set out by BERL have
not been used because it is not possible to predict the future movements and
the prices over the period of the plan. This plan therefore assumes that the
increase in the value of the forestry asset is limited to the silvicultural or
roading work carried out on the forestry assets during each year of the plan.
Assets
Infrastructure Assets
All
infrastructure assets (river, flood control and drainage schemes) will be
operated, maintained and improved as set out in the asset management plans that
have been prepared for each of the river, flood control and drainage schemes.
Schemes are
funded to a level that ensures levels of service set for each scheme in the
relevant asset management plan are achieved and maintained over the life of the
assets.
For the
purposes of projecting annual movement in the values of this asset category to
fair value, the property price adjusters covering projected movement in asset
construction as set out by BERL have been used.
Plant, Property and Equipment including Intangible Assets
It is assumed
that HBRC’s other fixed assets continue to be provided at the level
required to carry out its activities. Depreciation on operating assets
will continue to be fully funded. Combined with the proceeds of asset sales and
loan funding, where appropriate, that will be sufficient to fund the ongoing
programme of capital expenditure on operating assets.
The useful
life of each category of asset is shown in the Statement of Significant
Accounting Policies included in this plan.
For the
purposes of projecting annual movement in the values of this asset category to
fair value, the property price adjusters as set out by BERL have been used.
Insurance of
Infrastructure Assets
HBRC currently
provides cover for its infrastructure assets through a hierarchy of insurance
and other available funding as follows.
1. Commercial insurance covering 60% of infrastructure value
excluding live tree edge protection up to a maximum estimated loss of $19M.
(This insurance was discontinued as at 30 June 2013.)
2. Local Authority Protection Programme (LAPP) which covers 40% of
infrastructure value above an excess of $1,259,000 which will apply for the 2013-14
year and may change in subsequent years.
3. Central Government, under the National Civil Defence Recovery
Plan, will meet 60% of the value of infrastructure assets critical to the
functioning of the community, above 0.002% of regional capital value and
provided HBRC has taken demonstrable steps to meet the remainder of the cost.
4. Each flood control and drainage scheme has access to a disaster
reserve account. The scheme disaster reserves are designed to meet the
costs of damage that may occur in any relatively minor flood event.
5. A Regional Disaster Reserve which is intended to cover 60% of the
unfunded portion (namely that which is not met from all other funding sources)
of asset reinstatement cost following a disaster event. It is a discretionary
funding pool of last resort and is designed as a contribution toward the cost
of reinstatement of infrastructure assets to an equivalent standard to that in
place before the damage was incurred.
A number of
major natural disasters, including the Christchurch Earthquake, have put
significant financial pressure on the insurance market, which has driven
increased insurance premiums. As a result of insurance cost increases and
stronger government commitment to meet a share of the disaster cost as set out
in the National Civil Defence Emergency Management Plan, Council decided not to
renew its commercial insurance cover for infrastructure assets in February
2013.
The Regional
Disaster Reserve is required to be maintained with between $2.75M and $3.75M of
investments. The Reserve as at 31 March 2013 holds $3.6M. HBRC has
committed to utilise approximately $720,000 as a contribution toward the
rebuilding of the Makara No 1 dam.
The budgets
established for the 2012-22 LTP were prepared on the basis that this reserve
would not be drawn on within the 10 Year Plan period.
Dividend
Equalisation Reserve
HBRC has
established a Dividend Equalisation Reserve with the intention of having funds
available to provide additional dividend income in years where the payment of a
dividend from the Port of Napier Limited (PONL) is substantially less than the
levels forecast. This reserve has in the past been used to insulate Council
from needing to increase general rates to make up any shortfall in dividend
income.
The current
policy as set out in the Statement of Intent between PONL and the Council (and
soon to be changed to HBRIC) calculates the dividend payout based on a return
of 8% on shareholder funds, with the Council being paid 70% of that return. The
remaining 30% is retained by PONL for expansion programmes, etc.
When HBRC
established the Dividend Equalisation Reserve, the dividends paid by PONL were
calculated as a percentage of net profit after tax, which exposed it to the
risk of fluctuations in dividend payout from year to year. The current basis
using a return on equity to calculate dividends has resulted in limited
variability in the dividend payouts from year to year.
The Dividend
Equalisation Reserve is estimated to be $2.7M at the beginning of the Long Term
Plan (1 July 2012). This is forecasted to be utilised during the next 10 years
for operating purposes and is estimated to have a remaining balance of $1.5M at
the end of this Long Term Plan.
Funding of
Open Space Initiatives and Community Facility Assistance
HBRC has
adopted a policy to approve expenditure on capital related open space items and
a further policy to provide assistance to community facilities within the
region. This plan assumes that the majority of the initiatives as approved by
these two policies will be funded by the loan facility of $7.5M. This loan
facility is repayable over a 10 year period and is funded by the transfer of
about $1M per annum from Council’s Sale of Land Investment account.
Subsidy
Rates
Funding
assistance will be provided by Crown agencies, primarily the New Zealand
Transport Agency and Animal Health Board at the following levels:
NZTA - Operations funding assistance rates
· Bus Services 50%
· Total Mobility Scheme 60%
· Infrastructure Maintenance and Operations 59%
(reducing by 1% a
year for each year of the LTP).
Animal Health Board
· HBRC will continue to undertake work for the Animal Health Board
on the basis that they cover all relevant costs.
Risks to
Assumptions
The following
tables (4-7) outline the risks to significant forecasting assumptions. If these
assumptions prove to be incorrect, there could be a significant effect on the
level of rates that HBRC plans to collect from the community. In this
situation, it will re-examine its work programmes and determine if it’s
appropriate to rate the community or change the scope of those programmes.
|
Table
4: Council Investment Risks
|
|
Assumptions
|
Risk
to Assumption
|
Level
of Uncertainty
|
Reasons
and Financial Effects of Uncertainty
|
|
Forestry: Carbon Investments
|
Price falls below assumed $20/tonne
|
High
|
This is a complex issue linked to global
politics and economic performance. Financial modelling shows that the long
term carbon price could reduce to $15/tonne and the afforestation project
would still make a 6% return on investment. In addition HBRC can hold carbon
accumulated from forestry for long periods (i.e. 5-10 years) so has some
flexibility to pick the time to sell.
|
|
Project Cost
|
Medium
|
Investment would only proceed on a strong
business case including a trading strategy for carbon.
|
|
Forestry: Manuka Honey Plantings
|
Honey yield per hectare is lower than
forecast
|
Medium
|
The projected investment returns are
based on MAF apiary data and based on these the project will deliver returns
well above HBRC’s 7% Internal Rate of Return hurdle rate. Even with a
reduction in honey yield of 30% the project would still deliver an investment
return of about 7%.
|
|
Forestry: Harvesting
|
Price for logs is less than forecast
|
Low
|
Commodity markets such as timber are
cyclical; however, there is the option to defer harvest. Because HBRC’s
total harvestable forest asset is a small proportion of its overall
investments, the impact of lower harvest prices (to the extent they cannot be
managed by deferred harvest) is not believed to be significant.
|
|
HBRC
2014-15 Annual Plan - Part 3 Financial Information
|
Attachment 4
|
Investment
Company Risks
Table 5 summarises the
principal investment risks in respect of the proposed projects of the
investment company.
|
Table
5: Investment Company Risks
|
|
Investment
|
Assumptions
|
Risk to Assumption
|
Level
of Uncertainty
|
Reasons
and Financial Effects of Uncertainty
|
|
Water Storage and
Harvesting (Ruataniwha Plains and Ngaruroro)
|
Farmer take up
|
Lower than planned
|
Medium
|
This Long Term
Plan provides for funding of operating losses equating to a 51% share for any
shortfall in HBRIC Ltd ability to service interest on the debt raised to fund
these investments.
This Plan provides
for an “investment risk reserve” which equates to a reduction of
1.50% from the interest charged in the investment model on holding costs to
be paid by HBRIC Ltd to HBRC for its borrowings. This reserve will
continue until the projects become operational. The provision of this
reserve is considered to be prudent given the significant risks on farmer
uptake and the effect this could have on HBRIC’s ability to provide a
commercial return on funds invested by Council. This reserve will also
provide funding if the interest rates used to calculate holding costs paid by
HBRC are below those levels budgeted.
|
|
Investment by
co-shareholders
|
Low investment
interest
|
Low
|
Significant risk
however will be managed through the years of the LTP by a proactive approach
to relationship building with prospective investors in the project.
|
|
Project cost
|
Project cost rises
|
Medium
|
Significant
effect, however this will be mitigated against by strong project management
by the Board of HBRIC Ltd. The estimate of the potential effects of the
uncertainty is best illustrated by stating that for every $10M increase in
project costs, HBRC will need to invest a further $5M if we are to retain our
51% investment. A commercial return would need to be achieved on any increase
in project costs within a reasonable time period.
|
|
Project does not
proceed
|
Not commercially
viable
|
Medium
|
The
‘investment risk reserve’ covers the interest differential
between interest charged on project advances and interest estimated to be
earned from bank deposits.
|
|
Rail - Port Hub
|
Demand
from PONL and its clients
|
Demand falls
|
Low
|
|
|
Project
cost
|
Project
cost rises
|
Medium
|
Commercial
return would need to be achievable on any increased project cost.
|
|
Market
conditions steady
|
Rental
yields fall
|
Medium
|
Would
only proceed with a sound commercial proposal which would include a long term
lease commitment from PONL.
|
|
Port
of Napier
|
Dividend
|
Port
of Napier Dividends are higher or lower than forecast
|
Low
|
The
level of uncertainty relating to the Port of Napier Dividend has been
substantially reduced as a result of the change in calculation method. The
new method of calculation of the dividend by way of a return of 8% on
shareholder’s funds, with HBRC being paid 70% of that return, is deemed
to be more certain than the previous calculation method of 75% of Net Profit
After Tax.
|
Funding
Risks
|
Table
6: Funding Risks
|
|
Funding Type
|
Assumption
|
Risk to Assumption
|
Level
of Uncertainty
|
Reasons
and Financial Effects of Uncertainty
|
|
Sale of
residual cash flows for Napier leasehold
|
The
maximum value will be received on the sale
|
Demand for this
product from the market at a value acceptable to HBRC.
|
Low to Medium
|
There would be a
loss of interest of between $42,000 and $75,000 for each $1M of reduced sale
realisation value.
|
Other
Risks
|
Table
7: Other Risks
|
|
Assumption
|
Risk to Assumption
|
Level
of Uncertainty
|
Reasons
and Financial Effects of Uncertainty
|
|
Inflation
|
Inflation is
higher or lower than forecast
|
Medium
|
Inflation is
affected by external economic factors, most of which are outside of
HBRC’s control and influence. The estimate of the potential effects of
the uncertainty is best illustrated by stating that for 2013/14 a move in
these projections by plus or minus 0.5% would result in either an under or
over provision for external expenditure of $102,000 and for employment costs
of $59,000.
|
|
Interest
Rates on Borrowings
|
Interest
rates are higher or lower than forecast
|
High
– especially in later years of the plan
|
The
majority of the borrowing programme proposed in this plan is to provide
funding to the Investment Company. As the borrowing programme for HBRC is
expected to grow substantially in the later years of the plan, any movement
in interest rates are expected to have a major effect on HBRC’s
interest expense. This plan assumes that the Investment Company will pay for
advances at HBRC’s borrowing rate. The effect of any interest rate
movements on the borrowing programme can best be illustrated by stating that
a 0.5% movement either up or down from the assumed levels of interest rates
in this plan would result in an annual exposure of plus or minus $81,000 for
2012/13 and $305,000 in 2021/22.
|
|
Interest
Rates on Deposits
|
Interest
rates are higher or lower than forecast
|
Medium
|
Short
and long term HBRC cash investments are estimated to be in the order of $40M
at the start of this plan, therefore a 0.5% movement either up or down from
the assumed levels of interest rates in this plan would result in an annual
exposure of plus or minus $225,000 in 2012/13 and $161,000 in 2021/22.
|
|
Occurrence
of Natural Disaster
|
A
natural disaster/flood event occurs which damages Council’s property,
plant and equipment
|
Medium
|
Call
on commercial insurance, Local Authority Protection Programme and Government
funding through the National Civil Defence Recovery Plan. The use of reserves
is also available to HBRC as required.
|
Reporting on
Significant Changes
The Local Government Act
2002, Section 95 (5)(b) requires that subsequent Annual Plans identify any
variation from the financial statements and funding impact statement which are
included in the Council's Long Term Plan for the year of that plan. For the
purposes of this reporting, the following material and significance levels will
apply:
· Where the financial impact of any change exceeds 1.5% of total
budgeted expenditure in that year
· Other items of change where it is considered to be of interest to
the public as the principal users of the plan. These items would include establishing
new land drainage and flood control schemes, new projects, changes in future
direction etc.
|
HBRC
2014-15 Annual Plan - Part 3 Financial Information
|
Attachment 4
|
Forecast Financial Statements
Introduction
The following
pages cover the forecast financial statements, notes and other financial
information required by clauses 18-22 of Schedule 10 to the Local Government
Act 2002 (LGA). The significant forecasting assumptions required for the
LTP by clause of 17 of Schedule 10 to the LGA are also included.
These
financial statements, notes and other financial information comply with
Financial Reporting Standard No. 42, “Prospective Financial
Statements”.
As required by
section 100(1) of the LGA, HBRC has ensured that each year’s projected
operating revenues are set at a level sufficient to meet that year’s
projected operating expenses.
The Nature
of Prospective Information Presented
The
prospective financial information has been presented to comply with the
requirements of sections 95 of the LGA in relation to the Annual Plan for the
financial year ending on 30 June 2015. The statements and information may
not be appropriate for purposes other than those disclosed above.
The
prospective information presented is based on the best information that could
reasonably be expected to be available at the time of preparation. While
every care has been taken in the preparation of the prospective financial
information presented, the actual results are likely to vary from the
information presented and the variations may be material.
Authorisation
and Responsibility
The prospective
financial information presented was authorised for issue by HBRC on 25 June
2014.
HBRC
Councillors and management accept responsibility for the prospective financial
information presented including the appropriateness of the assumptions
underlying the information and all other disclosures.
Other Disclosures
There is no
intention to update the prospective financial information presented after the
approval of the Annual Plan on 25 June 2013.
Comparative
Information Linkages
The
Prospective Statement of Changes in Equity and Prospective Cash Flow Statement
closing positions for 2012/13 do not link to opening positions for
2013/14. This is because the 2013/14 Annual Plan prospective financial
statements were finalised before the 2012/13 Annual Report.
The 2014/15
forecast opening positions are based on the 2012/13 Annual Report closing
positions after adjusting for the 2013/14 Annual Plan forecast results and cash
flows.
|
HBRC
2014-15 Annual Plan - Part 3 Financial Information
|
Attachment 4
|
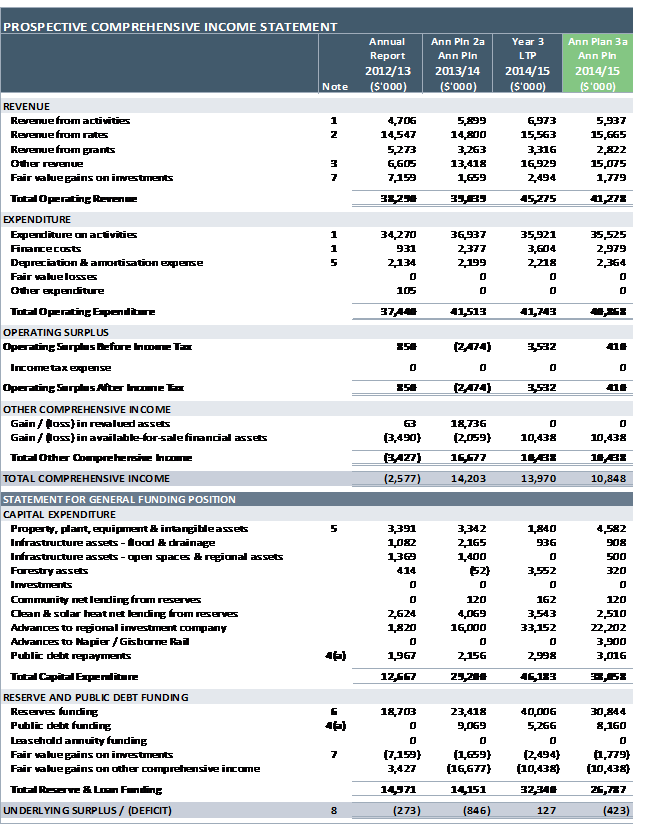
|
HBRC
2014-15 Annual Plan - Part 3 Financial Information
|
Attachment 4
|
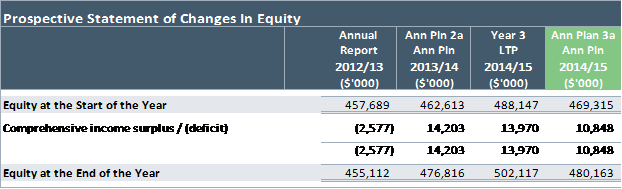
|
HBRC
2014-15 Annual Plan - Part 3 Financial Information
|
Attachment 4
|
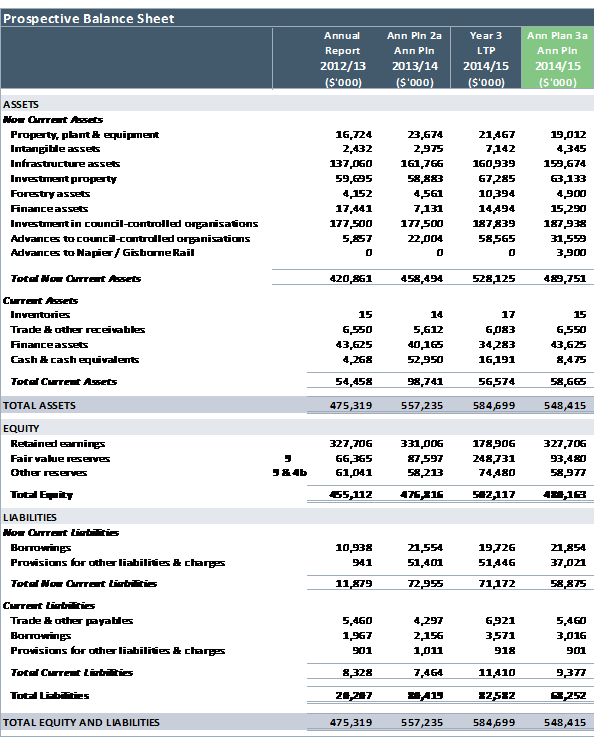
|
HBRC
2014-15 Annual Plan - Part 3 Financial Information
|
Attachment 4
|
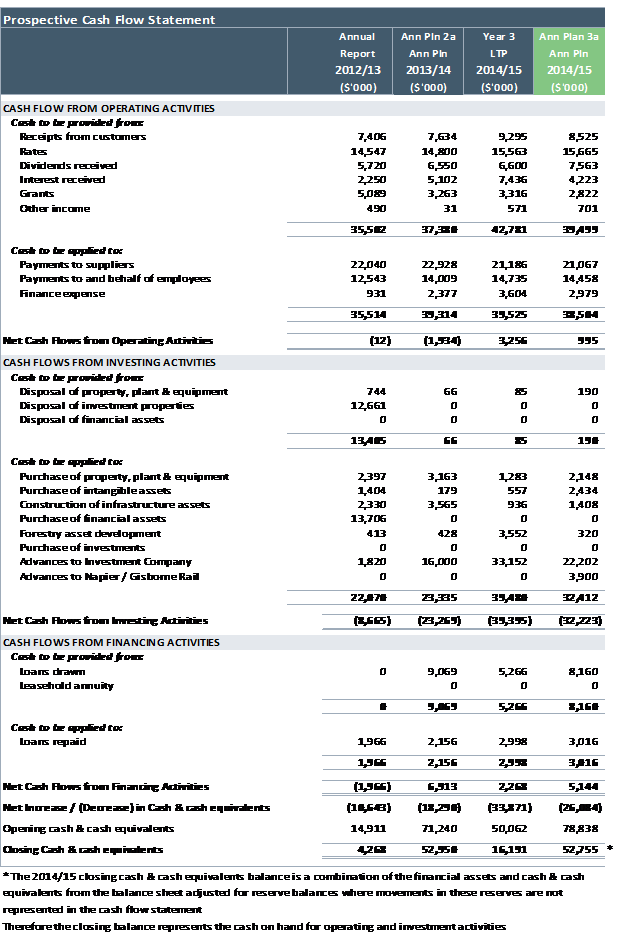
|
HBRC
2014-15 Annual Plan - Part 3 Financial Information
|
Attachment 4
|
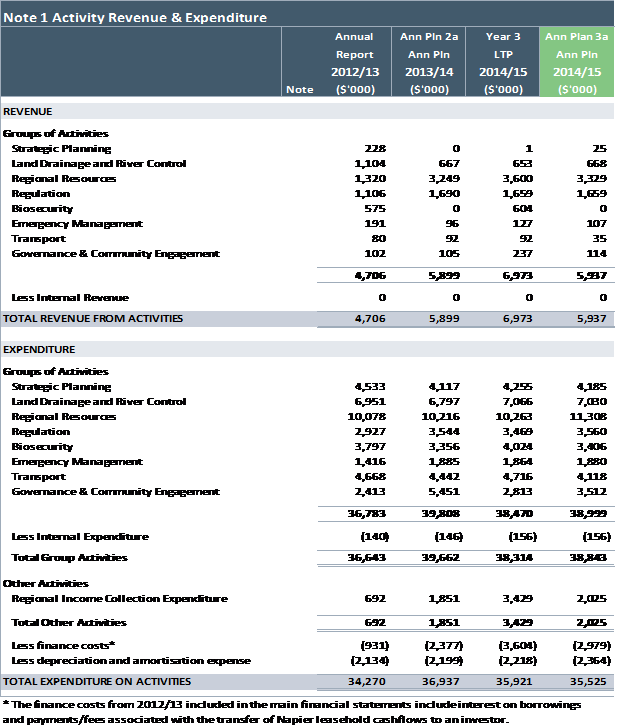
|
HBRC
2014-15 Annual Plan - Part 3 Financial Information
|
Attachment 4
|
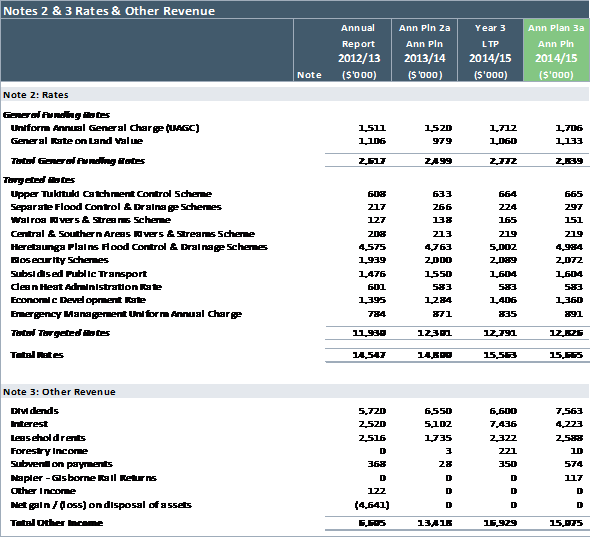
|
HBRC
2014-15 Annual Plan - Part 3 Financial Information
|
Attachment 4
|
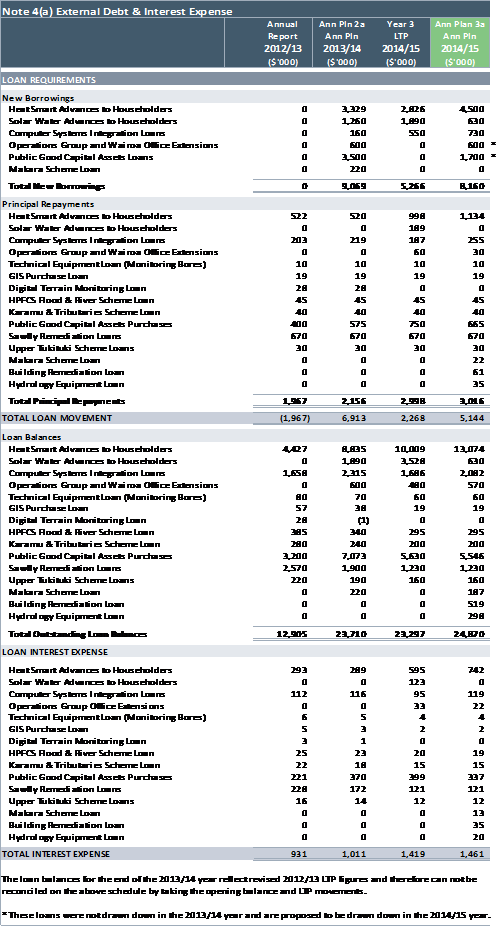
|
HBRC
2014-15 Annual Plan - Part 3 Financial Information
|
Attachment 4
|
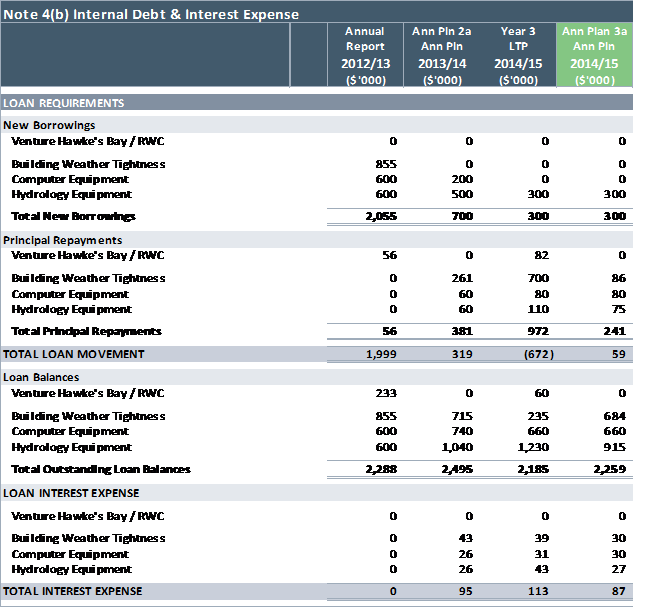
|
HBRC
2014-15 Annual Plan - Part 3 Financial Information
|
Attachment 4
|
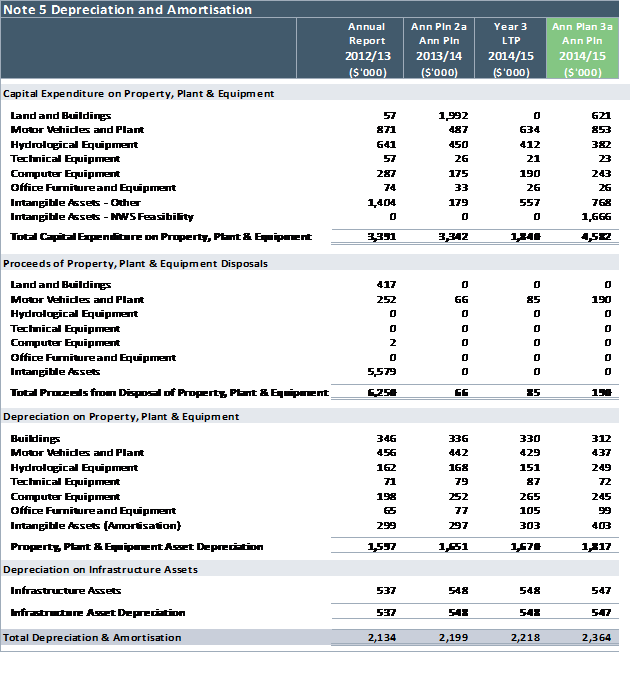
|
HBRC
2014-15 Annual Plan - Part 3 Financial Information
|
Attachment 4
|
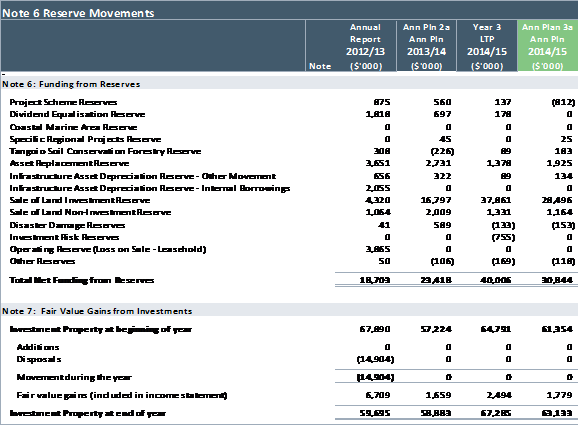
|
HBRC
2014-15 Annual Plan - Part 3 Financial Information
|
Attachment 4
|
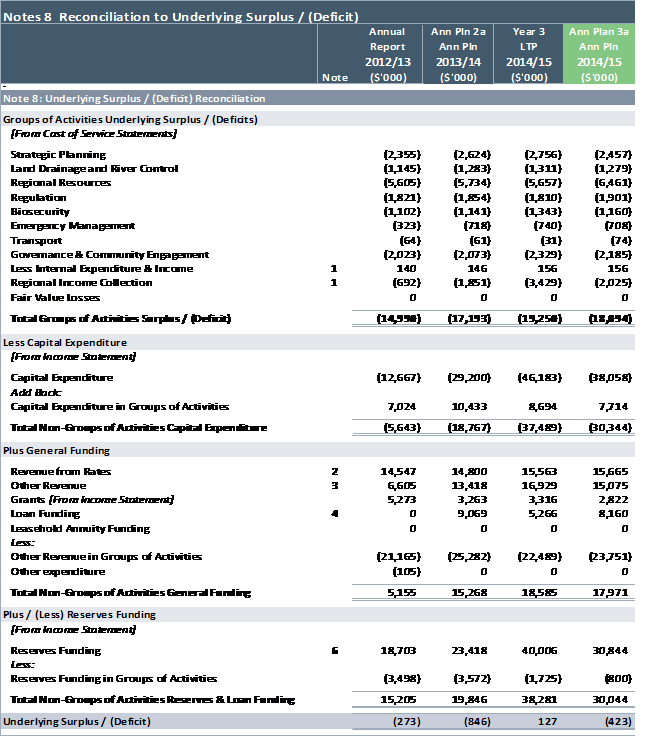
|
HBRC
2014-15 Annual Plan - Part 3 Financial Information
|
Attachment 4
|
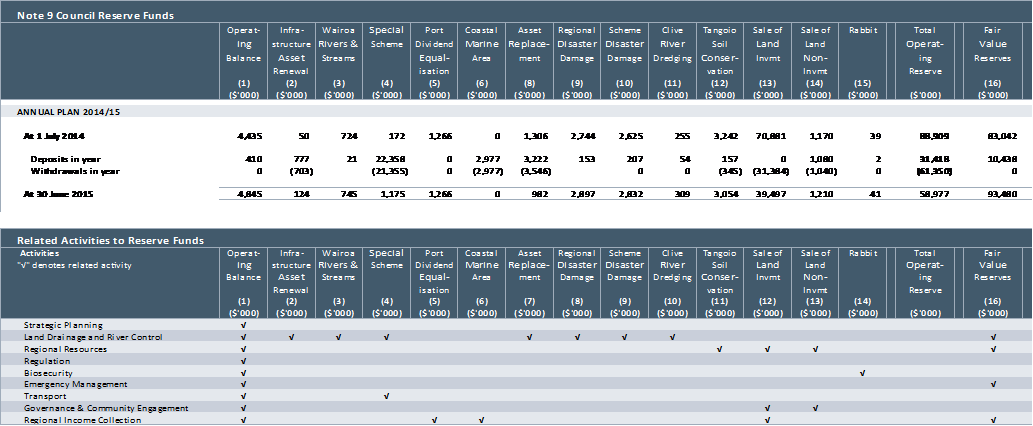
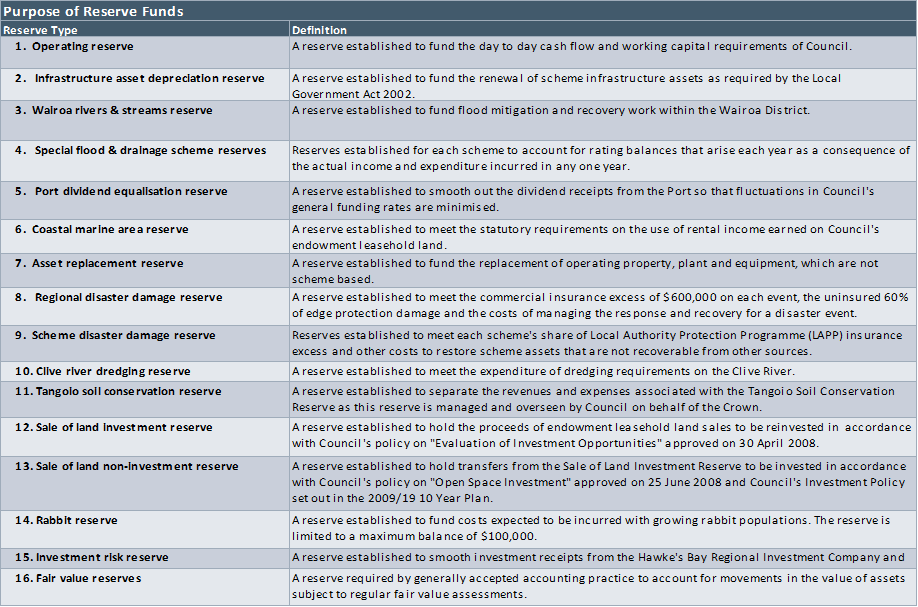
|
HBRC
2014-15 Annual Plan - Part 3 Financial Information
|
Attachment 4
|
Financial Metrics
The LTP set out
a number of financial metrics to be monitored. The 2014-15 LTP metrics
have been compared to the 2014-15 Annual Plan metrics in the table below along
with an explanation of any major difference. Comparison between the
2013-14 LTP metrics and actual 2013-14 metrics will be completed in the 2013-14
Annual Report.
|
Trends
of Other Financial Metrics
|
LTP
|
Ann
Pln
|
Variance
|
Explanation
|
|
Metric
|
2014-15
|
2014-15
|
|
|
|
Operating Surplus Margin:
(This
shows the annual surplus generated from business as usual activities being
available to fund capital expenditure, to meet interest and principal
repayments on debt and/or set aside to meet future contingencies. The
metric for HBRC is negative because a third of HBRC’s revenue is
generated from investment income which is not included in this
calculation. This metric therefore shows HBRC’s exposure to the
assumption that investment incomes will continue into the future.)
|
(37.1%)
|
(41.5%)
|
4.4%
|
The
operating surplus margin has decreased due to increased operating expenses.
|
|
Net Surplus Margin:
(This
metric shows the percentage of income retained by HBRC after meeting all
operating costs for the year).
|
8.3%
|
1.0%
|
(7.3%)
|
The
net surplus margin has decreased due lower than expected interest revenue and
increased operating expenses from unspent 2013-14 budgets that were carried
forward to 2014-15.
|
|
Return on Investment Assets:
(This
metric shows the amount of interest and dividend income generated each year
by HBRC’s total investment asset base).
|
4.5%
|
4.2%
|
(0.3%)
|
The return on
investment assets has decreased due to lower than expected interest rates
offset by larger dividends from HBRIC Ltd
|
|
Rates to Total Revenue:
(This
metric shows the percentage of HBRC’s total revenue that is collected
through rates).
|
36.4%
|
39.7%
|
3.3%
|
Rates to total
revenue have increased due to a slightly higher rate take combined with a
substantial reduction in overall income
|
|
General Rates to Total Rates:
(This metric shows the percentage of HBRC’s total rates
revenue that is collected through general rates).
|
17.8%
|
18.1%
|
0.3%
|
General rates to
total rates have increased due to a natural increase in ratepayers due to
subdivisions etc.
|
|
Capex to Depreciation:
(This
metric indicates the rate at which HBRC is renewing/replacing its existing
fixed assets. For HBRC this rate is high as significant expenditure is
proposed in the LTP 2012-22 to be spent on flood and drainage schemes, the
majority of these assets not being depreciable). Further, in 2012-13 it
is proposed to spend $1.3m on HBRC’s Dalton Street Office and
Operations Group accommodation.
|
125%
|
183%
|
58%
|
Capex
to Depreciation has increased due to additional capital spending on systems integration
projects for regulatory software, an increase in motor vehicles and plant due
to timing on fleet replacements as well as unspent capital spending from
2013-14 year being carried forward to 2014-15.
|
|
HBRC
2014-15 Annual Plan - Part 3 Financial Information
|
Attachment 4
|
|
Trends
of Other Financial Metrics
|
LTP
|
Ann
Pln
|
Variance
|
Explanation
|
|
Metric
|
2014/15
|
2014/15
|
|
|
|
Capex to Total Cash Payments:
(This metric shows the proportion of total cash payments that
has been spent on fixed assets).
|
3.4%
|
5.9%
|
2.5%
|
Capex
to total cash payments has significantly increased due to additional capital
spending on systems integration
projects for regulatory software, an increase in motor vehicles and plant due
to timing on fleet replacements as well as unspent capital spending from
2013-14 year being carried forward to 2014-15.
|
|
|
|
|
|
|
|
Finance Expense (including lease annuity)
to Total Operating Expenditure
|
8.6%
|
7.3%
|
1.3%
|
Finance
expenses to total operating expenditure has reduced due to the reduction in
annuity expenses on the leasehold cash flows. The value of cash flows
to be sold to an investor have reduced as a result of greater than expected
freeholding and therefore less payment/fees will be paid to the investor.
|
|
Finance Expense (excluding lease
annuity) to Total Operating Expenditure
|
3.4%
|
3.6%
|
0.2%
|
Finance Expense (excluding lease annuity) of external public
debt to operating expenditure has remained consistent with the LTP.
|
|
Debt to Debt Plus Equity
|
14.7%
|
11.3%
|
(3.4%)
|
Debt to
debt plus equity has decreased as the LTP included the ACC annuity of $61
million in the debt figure which has now been reduced to $37 million as a
result of increased sell downs before the ACC deal took place.
|
|
HBRC
2014-15 Annual Plan - Part 3 Financial Information
|
Attachment 4
|
Rate
Movements
The 2012-22 Long Term Plan (LTP) committed to hold rates increases
to 4% in each of its first two years and at rate levels below 4% for the
remaining years. The 2014-15 Annual Plan proposes to increase the rates
by 5.86% from the 2013-14 actual rate figures due to the fact that the 2013-14
Annual Plan reduced the rates increase to 2.8%. Refer to
“Explanatory Notes of Changes between Year 3 of the LTP 2012-22 and
Annual Plan 2014-15” section for further explanation for the change.
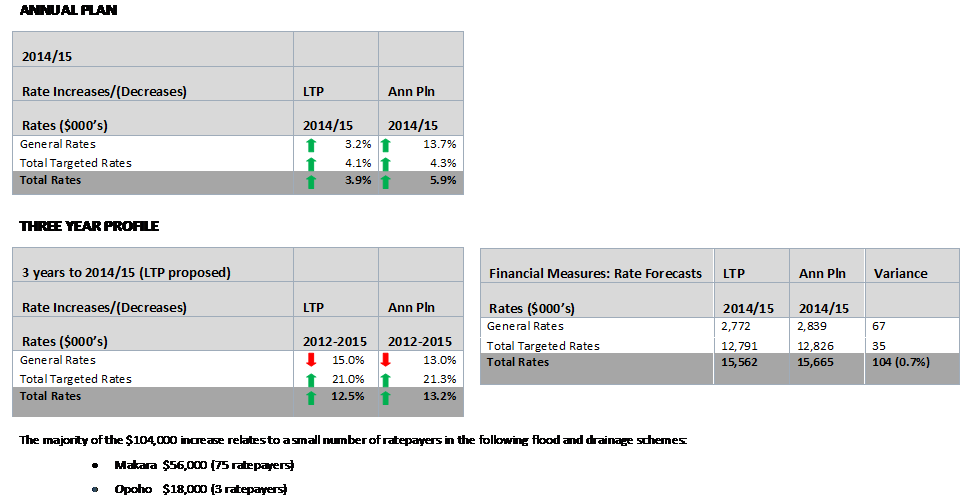
|
HBRC
2014-15 Annual Plan - Part 3 Financial Information
|
Attachment 4
|
Local
Government (Financial Reporting) Regulations 2011
Introduction
The following
information is presented for compliance with Local Government (Financial
Reporting) Regulations 2011. In accordance with the regulations, the information
presented is incomplete (in particular, the information presented does not
include depreciation and internal transactions such as overheads) and it is not
prepared in compliance with generally accepted accounting practice. It
should not be relied upon for any other purpose than compliance with the Local
Government (Financial Reporting) Regulations 2011.
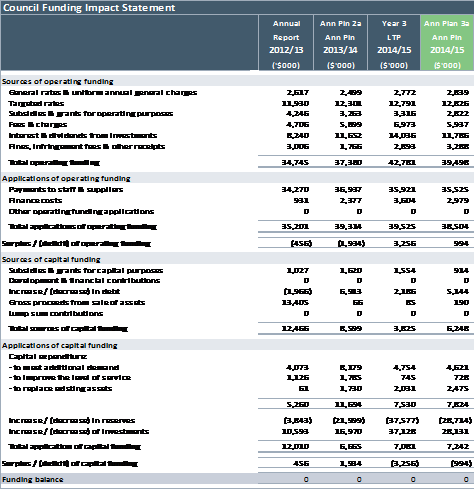
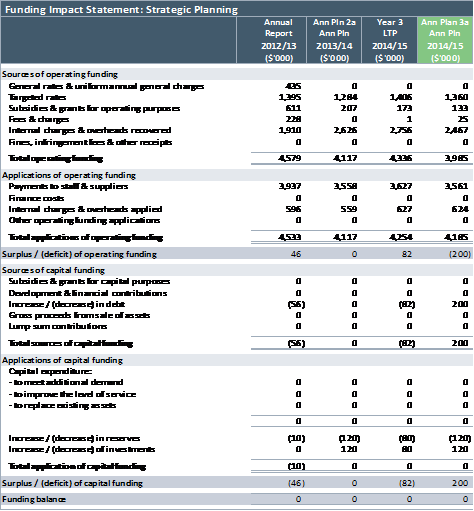
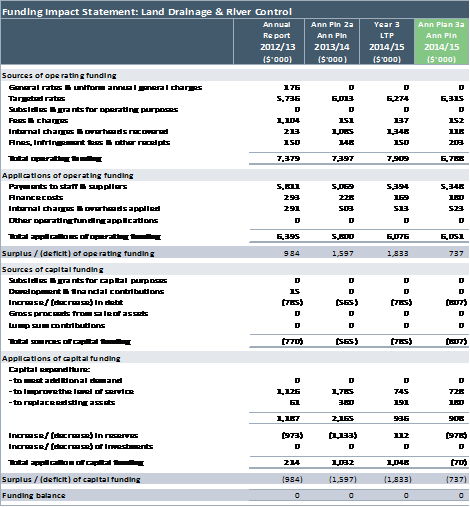
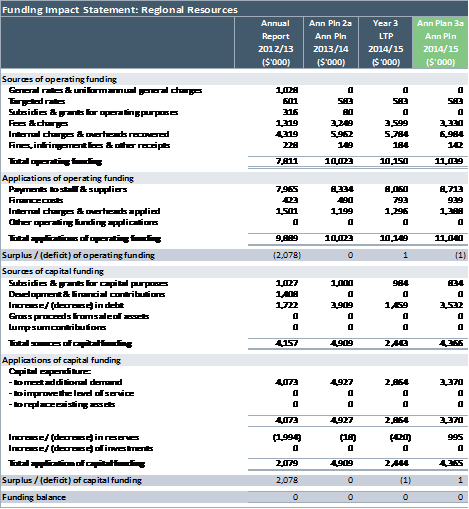
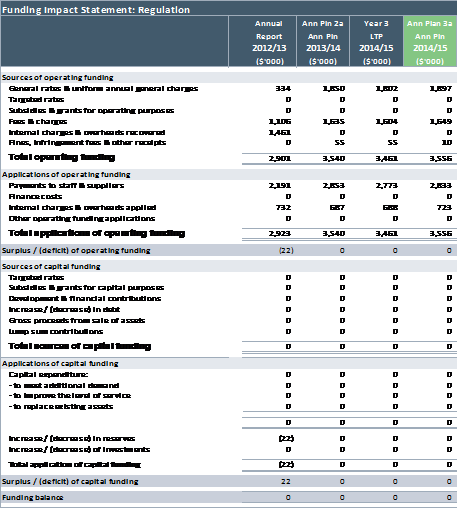
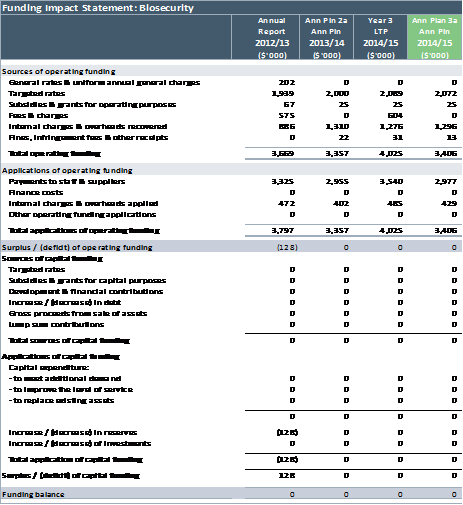
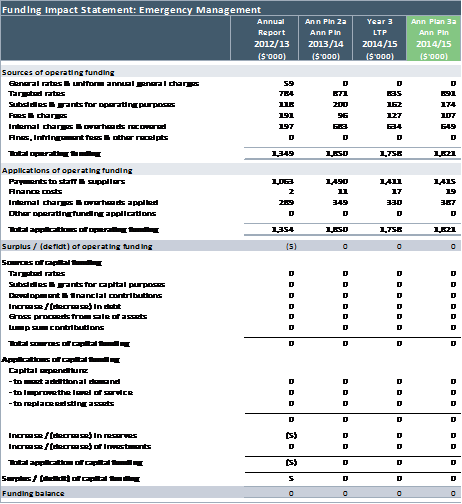
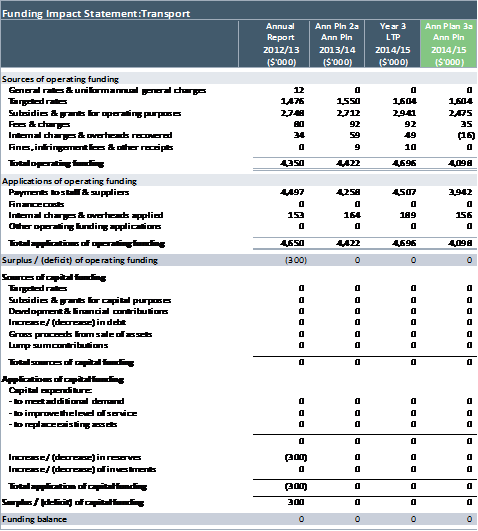
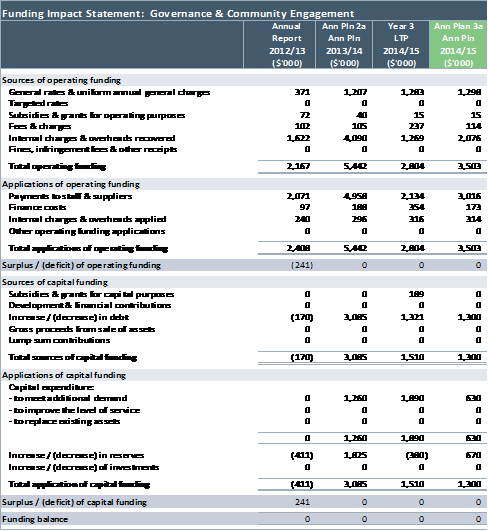
|
HBRC
2014-15 Annual Plan - Part 3 Financial Information
|
Attachment 4
|
Introduction
This Funding
Impact Statement sets out the impact that the Hawke’s Bay Regional
Council's Revenue and Financing Policy has on ratepayers.
The Revenue
and Financing Policy clearly identifies beneficiaries of HBRC activities paying
for the cost of those activities by target rates or direct charges, whichever
is the most efficient administratively.
Public benefit
is funded through a combination of investment income and general rates. Private
benefit is funded through targeted rates and/or direct charges.
At various
points of the Funding Impact Statement, a level of rates or charges is
specified. These indicative figures are included to give ratepayers an estimate
of what their level of rates is likely to be in the current year. These figures
may not be the actual level of rates that will be assessed in the coming year
because the actual figure will not be known until the Council’s rating
information database is finalised.
All the
estimated rates and levels of rates included in this statement are GST inclusive.
There is no
provision for the payment of rates from lump sum contributions, except for the
early repayment of Clean Heat loans.
Due dates
for payment of rates
The rates are
due and payable on or after 1 October 2014. Pursuant to Section 57 of the Local
Government (Ratine) Act 2002, a penalty charge of 10% will be imposed on the
current rates remaining unpaid as at 1 February 2015.
When a fixed
amount is set for each property, whether it be a Uniform Annual General Charge
(UAGC) for general funding rates or a Uniform Annual Charge (UAC) for Targeted
Rates, then a fixed amount is charged for each separately used or inhabited
part of a rating unit. Therefore, units in a rest home, retail shops in a
shopping complex, and additional farm houses are charged with separate UAGCs or
UACs.
Where two or
more rating units are contiguously joined, owned by the same ratepayer and used
for the same purpose, or a Farm property with separately titled paddocks, then
only one UAGC or UAC will be payable.
HBRC’s
contention is that this mix of rating bases better reflects the benefits
delivered to the general community while addressing some of the rate level
volatility experienced by those ratepayers in the community whose land values
have increased by more than the average.
HBRC directly
collects rates for all rating units contained within its boundaries and where
specific rates are set across District/City boundaries on a value basis, then
the rates are set on Estimate of Projected Valuation (equalisation) which
recognises annual movement of values across the region for each territorial
authority.
Section 21 of the Local
Government (Rating) Act 2002 requires that Uniform Annual General Charges and
targeted rates set on a uniform basis are not to exceed 30% of the total
revenue from all rates sought by Hawke’s Bay Regional Council (HBRC) for
the budgeted year. The rates making up this category amount to 23.28% of
Council’s total rates in 2014-15 and are therefore within the limits
prescribed by the Act.
Inspection and objection to HBRC's Rating Information Database
The Rating
Information Database (RID) is available for inspection at HBRC offices at 159
Dalton Street Napier and on Council’s website www.hbrc.govt.nz.
Ratepayers have the right to inspect the RID records and can object to their
rating liability on the grounds set out in the Local Government (Rating) Act
2002.
|
HBRC
2014-15 Annual Plan - Part 3 Financial Information
|
Attachment 4
|
|
Explanation of Rating Method
|
|
|
Types of Rates
|
Groups
of Activities Funded
|
Types of land to be Rated
(Local Government (Rating) Act, Schedule 2)
|
Basis of Rating
(Local Govt (Rating) Act, Schedule 3)
|
|
General Funding
Rates
|
|
|
General Rates
|
Regulation
Governance
& Community Engagement (Climate Change)
|
All Rateable Rating Units within the region.
|
Land Value
|
|
Uniform Annual General Charges
|
Regulation
Governance
& Community Engagement
|
All Rateable Rating Units within the region.
|
Fixed Amount (Refer Note 1)
|
|
Targeted Rates
|
|
|
Subsidised Public Transport
|
Public Transport System and Total Mobility programme for
disabled persons.
|
Those
Rating Units within the urban areas of Napier, Hastings & Havelock North
including Clive Township but excluding Bay View.
|
Land
Value
|
|
Heretaunga Plains Control Scheme
|
Catchment Works
Direct Benefit F1
Indirect Benefit F2
|
Rating Units
receiving direct benefit within Napier City and Hastings District from flood
control measures.
All Rating Units
within Napier City and Hastings District.
(For
categories of the rateable land refer to Section 12 of the Asset Management
Plan available at www.hbrc.govt.nz)
|
Capital
Value
|
|
Upper Tukituki Catchment Control
|
Catchment Works
|
All
Ratings Units in Central Hawke’s Bay District on a graduated
basis. Also, Rating Units on the southern boundary of Hastings District
Council.
(For
categories of the rateable land refer to Section 12 of the Asset Management
Plan available at www.hbrc.govt.nz)
|
Land
Value
|
|
Central & Southern Rivers & Streams
|
Catchment Works
|
All
Ratings Units in the region excluding Wairoa District.
|
Capital
Value
|
|
Wairoa River & Stream
|
Catchment Works
|
All
Rating Units in the Wairoa District.
|
Capital
Value
|
|
Various Stream & Drainage Schemes
|
Catchment Works
|
Rating
Units identified receiving benefit from specific stream and drainage
works. Some on graduated basis.
(For
categories of the rateable land refer to Section 12 of the Asset Management
Plan available at www.hbrc.govt.nz)
|
Land
Value Area and Fixed Amount (Refer Note 1)
|
|
Continued: Explanation of Rating
Method
|
|
|
Types
of Rates
|
Groups of Activities Funded
|
Types of land to be Rated
(Local Government (Rating) Act, Schedule 2)
|
Basis of Rating
(Local Govt (Rating) Act, Schedule 3)
|
|
Targeted
Rates
|
|
|
Animal and Plant Pest Control
|
Biosecurity
Regional Animal Pest Management Strategy
|
All rateable rural land containing 4.0469 hectares in the region
excluding Rating Units greater than 200 hectares where more than 90% of the
land is covered in indigenous vegetation which will be zero rated.
A
differential rate will be applied to those Rating Units that have between 40
and 400 hectares where more than 75% of the land is covered in production
forestry, also any production forestry Rating Units over 400 hectares.
|
Area
|
|
Bovine TB Vector Control
|
Bovine TB Vector Control
|
All rateable rural land containing 4.0469 hectares in the
region.
|
Area
|
|
Plant Pest Strategy
|
Regional Plant Pest Management Strategy
|
All rateable rural land containing 4.0469 hectares in the region
excluding Rating Units greater than 200 hectares where more than 90% of the
land is covered in indigenous vegetation which will be zero rated.
|
Area
|
|
Healthy Homes - Clean Heat Financial Assistance
|
Management of the scheme to encourage the replacement of open
fire or wood burners with more efficient form of heating and where necessary
the installation of insulation.
|
All Rating Units in Napier and Hastings within the affected
airshed.
|
Land Value
|
|
Clean Heat & Insulation Loans
|
Repayment of loans to ratepayers to insulate homes and replace
open fires or non-compliant woodburners.
|
Those ratepayers who have opted for a loan to be repaid over 10
years with interest as a fixed amount through a Targeted Differential rate.
|
Dollar Amount
|
|
Continued: Explanation of Rating
Method
|
|
|
Types
of Rates
|
Groups of Activities Funded
|
Types of land to be Rated
(Local Government (Rating) Act, Schedule 2)
|
Basis of Rating
(Local Govt (Rating) Act, Schedule 3)
|
|
Economic Development Rate
|
To fund economic and tourism development in the region.
|
30% of the total rates are funded by the Commercial/Industrial
Rating Units based on the Capital Value.
The remaining 70% is collected from residential and rural Rating
Units as an Uniform Annual Charge.
The Wairoa District ratepayers’ contribution is limited to
5% of the total rate.
|
Capital Value
Fixed Amount (Refer to Note 1)
|
|
Emergency Management
|
Funding of the Hawke’s Bay Civil Defence Emergency
Management (CDEM) Group Office to manage the provision of effective CDEM
consistent with the CDEM Act 2002.
|
All Rating
Units in the region with the exception of Rangitikei and Taupo districts.
|
Fixed Amount
(Refer to Note 1)
|
Note 1: A Uniform Annual General Charge (UAGC) or Uniform Annual Charge
(UAC) is set on each separately used or inhabited part of a rating unit within
the region.
|
HBRC
2014-15 Annual Plan - Part 3 Financial Information
|
Attachment 4
|
|
Details of Rates Calculated within each District and City
General and Uniform Annual General Rates
|
|
|
Groups
of Activities / Rate Type
|
Districts
|
Rates
set on
|
Differentials
|
Calculation
Factor
|
Estimated
Rates Revenue 2014-15
|
Estimated
Amount of $100,000 value per property
|
2013/14
Rate
|
|
|
|
General Rate
|
|
|
|
Napier City
|
Land Value
|
|
0.00825
|
$368,659
|
$8.25
|
$318,424
|
|
|
|
Hastings District
|
Land Value
|
|
0.00839
|
$638,648
|
$8.39
|
$546,530
|
|
|
|
Wairoa District
|
Land Value
|
|
0.00848
|
$84,173
|
$8.48
|
$75,904
|
|
|
|
Central H B District
|
Land Value
|
|
0.00877
|
$203,153
|
$8.77
|
$176,847
|
|
|
|
Taupo District
|
Land Value
|
|
0.00978
|
$5,788
|
$9.78
|
$4,976
|
|
|
|
Rangitikei District
|
Land Value
|
|
0.01682
|
$2,823
|
$16.82
|
$2,681
|
|
|
|
Estimate of Projected Valuation
|
|
0.00838
|
$1,303,244
|
|
$1,125,362
|
|
|
|
|
|
|
|
|
|
|
|
|
Uniform Annual
General Rate
|
|
|
|
Napier City
|
Fixed Amount
|
26,370
|
28.41
|
$749,159
|
28.41
|
$669,659
|
|
|
|
Hastings District
|
Fixed Amount
|
31,116
|
28.41
|
$884,005
|
28.41
|
$783,457
|
|
|
|
Wairoa District
|
Fixed Amount
|
5,182
|
28.41
|
$147,220
|
28.41
|
$136,894
|
|
|
|
Central H B District
|
Fixed Amount
|
6,352
|
28.41
|
$180,460
|
28.41
|
$157,735
|
|
|
|
Taupo District
|
Fixed Amount
|
18
|
28.41
|
$511
|
28.41
|
$613
|
|
|
|
Rangitikei District
|
Fixed Amount
|
4
|
28.41
|
$113
|
28.41
|
$153
|
|
|
|
TOTAL
|
|
69,042
|
|
$1,961,468
|
|
$1,748,511
|
|
|
|
|
|
|
|
|
|
|
|
|
|
|
|
|
|
|
|
|
|
|
|
|
Details of Targeted Rates Calculated within each District and
City
|
|
Groups
of Activities / Rate Type
|
Districts
|
Rates
set on
|
Differentials
|
Calculation
Factor
|
Estimated
Rates Revenue 2014-15
|
Estimated
Amount of $100,000 land value per property
|
2013/14
Rate
|
|
SUBSIDISED PUBLIC TRANSPORT
|
|
Napier City
|
Land Value
|
|
0.02632
|
$1,028,162
|
$26.32
|
$1,014,485
|
|
Hastings
District
|
Land Value
|
|
0.02678
|
$816,726
|
$26.78
|
$768,015
|
|
|
Estimate of
Projected Valuation
|
|
0.02675
|
$1,844,888
|
|
$1,782,500
|
|
|
|
|
|
|
|
|
|
|
RIVER CONTROL
|
|
|
Benefit
|
|
|
|
|
|
|
|
|
|
|
|
|
|
Heretaunga Plains Flood
Control Scheme
|
|
Napier City
|
Capital
Value
|
Direct
|
0.01163
|
$752,708
|
$11.63
|
$725,077
|
|
Napier City
|
Capital
Value
|
Indirect
|
0.00284
|
$275,931
|
$2.84
|
$266,961
|
|
|
Hastings
District
|
Capital
Value
|
Direct
|
0.01169
|
$887,518
|
$11.69
|
$843,023
|
|
|
Hastings
District
|
Capital
Value
|
Indirect
|
0.00285
|
$427,023
|
$2.85
|
$405,082
|
|
|
Estimate of
Project Valuation
|
|
Direct
|
0.01166
|
|
|
|
|
|
Estimate of
Project Valuation
|
|
Indirect
|
0.00284
|
|
|
|
|
|
TOTAL
|
|
|
|
$2,343,180
|
|
$2,240,143
|
|
Upper Tukituki Catchment Control
Scheme
|
|
|
Central H B
District
|
Land Value
|
F1 100
|
0.62728
|
$131,090
|
$627.28
|
$124,362
|
|
|
Central H B
District
|
Land Value
|
F2 75
|
0.47046
|
$194,266
|
$470.46
|
$186,928
|
|
|
Central H B
District
|
Land Value
|
F3 50
|
0.31364
|
$92,161
|
$313.64
|
$87,908
|
|
|
Central H B
District
|
Land Value
|
F4 25
|
0.15682
|
$121,872
|
$156.82
|
$115,142
|
|
|
Central H B
District
|
Land Value
|
F5 10
|
0.06273
|
$72,116
|
$62.73
|
$68,482
|
|
|
Central H B
District
|
Land Value
|
F6 1
|
0.00627
|
$85,107
|
$6.27
|
$80,656
|
|
|
Central H B
District
|
Land Value
|
U1 25
|
0.15682
|
$36,810
|
$156.82
|
$35,308
|
|
|
Central H B
District
|
Land Value
|
U2 15
|
0.09409
|
$5,452
|
$94.09
|
$5,172
|
|
|
Central H B
District
|
Land Value
|
U3 10
|
0.06273
|
$13,770
|
$62.73
|
$13,105
|
|
|
Central H B
District
|
Land Value
|
U4 1
|
0.00627
|
$7,620
|
$6.27
|
$7,258
|
|
|
Hastings
District
|
Land Value
|
F5 10
|
0.06530
|
$1,333
|
$65.30
|
$1,183
|
|
|
Hastings
District
|
Land Value
|
F6 1
|
0.00653
|
$2,687
|
$6.53
|
$2,387
|
|
|
TOTAL
|
|
|
|
$764,285
|
|
$727,891
|
|
|
|
|
|
|
|
|
|
|
Details of Targeted Rates Calculated within each District and
City
|
|
Groups
of Activities / Rate Type
|
Districts
|
Rates
set on
|
Differentials
|
Calculation
Factor
|
Estimated
Rates Revenue 2014-15
|
Estimated
Amount of $100,000 capital value per property
|
2013/14
Rate
|
|
RIVER CONTROL
|
|
|
Benefit
|
|
|
|
|
|
|
|
|
|
|
|
|
|
Wairoa River & Streams Scheme
|
|
|
Wairoa District
|
Capital Value
|
|
0.01041
|
$174,116
|
$10.41
|
$165,482
|
|
|
|
|
|
|
|
|
|
|
Central & Southern Area Rivers & Streams
|
|
|
Napier City
|
Capital
Value
|
|
0.000875
|
$85,293
|
$0.87
|
$83,778
|
|
|
Hastings
District
|
Capital
Value
|
|
0.000879
|
$131,873
|
$0.87
|
$127,065
|
|
|
Central HB
District
|
Capital
Value
|
|
0.000905
|
$33,758
|
$0.90
|
$32,753
|
|
|
Taupo
District
|
Capital
Value
|
|
0.000980
|
$767
|
$0.98
|
$741
|
|
|
Rangitikei
District
|
Capital
Value
|
|
0.001463
|
$345
|
$1.46
|
$359
|
|
|
Estimate of
Projected Valuation
|
|
0.000877
|
$252,036
|
|
$244,696
|
|
|
|
|
|
|
|
|
|
|
STREAMS AND DRAINS
|
|
|
|
|
|
|
|
|
|
|
|
|
|
- Napier,
Meeanee & Puketapu
|
Napier City
|
Land Value
|
Urban
|
0.02847
|
$726,488
|
$28.01
|
$688,048
|
|
Napier City
|
Land Value
|
Industrial
|
0.11387
|
$182,112
|
$112.05
|
$172,762
|
|
Hastings District
|
Land Value
|
Rural
|
0.02847
|
$13,925
|
$28.50
|
$13,678
|
|
TOTAL
|
|
|
|
$922,525
|
|
$874,488
|
|
|
|
|
|
|
|
|
|
Karamu
& Tributaries
|
Hastings District
|
Land Value
|
Urban
|
0.03661
|
$846,989
|
$36.65
|
$809,442
|
|
Hastings District
|
Land Value
|
Industrial
|
0.14645
|
$310,377
|
$146.61
|
$292,811
|
|
TOTAL
|
|
|
|
$1,157,366
|
|
$1,102,253
|
|
|
|
|
|
|
|
|
|
|
|
|
|
|
|
|
|
|
|
|
|
|
|
|
|
|
|
|
|
Details of Targeted Rates Calculated within each District and
City
|
|
|
Groups
of Activities / Rate Type
|
Districts
|
Rates
set on
|
Differentials
|
Calculation
Factor
|
Estimated
Rates Revenue 2014-15
|
Estimated
Amount of $100,000 capital value per property
|
2013/14
Rate
|
|
|
STREAMS AND DRAINS
|
|
|
|
|
|
|
|
Raupare
Enhancement
|
Hastings District
|
Area
|
1097 hectares
|
12.65
|
$13,877
|
$12.65/hectare
|
$13,877
|
|
|
Raupare
Twyford
|
Hastings District
|
Land Value
|
Rural
|
0.0848
|
$199,589
|
$84.89
|
$192,371
|
|
|
Haumoana
|
Hastings District
|
Land Value
|
Rural
|
0.1051
|
$141,774
|
$105.22
|
$136,980
|
|
|
Tutaekuri,
Waimate & Moteo
|
Hastings District
|
Land Value
|
Rural
|
0.1585
|
$212,165
|
$158.69
|
$202,062
|
|
|
Pakowhai
Brookfields
|
Hastings District
|
Land Value
|
Rural
|
0.1980
|
$144,656
|
$198.21
|
$139,093
|
|
|
Puninga
|
Hastings District
|
Land Value
|
Rural
|
0.2282
|
$79,336
|
$237.81
|
$76,653
|
|
|
Brookfields
Awatoto
|
Napier City
|
Land Value
|
Urban
|
0.2042
|
$101,945
|
$200.93
|
$98,251
|
|
|
|
Napier City
|
Land Value
|
Industrial
|
0.8168
|
$56,100
|
$803.73
|
$54,449
|
|
|
|
TOTAL
|
|
|
|
$949,442
|
|
$913,736
|
|
|
|
|
|
|
|
|
|
|
|
Muddy
Creek
|
Hastings District
|
Land Value
|
Urban
|
0.10469
|
$206,570
|
$104.81
|
$203,619
|
|
|
Hastings District
|
Land Value
|
Industrial
|
0.41876
|
$37,899
|
$419.23
|
$34,888
|
|
|
TOTAL
|
|
|
|
$244,469
|
|
$238,507
|
|
|
|
|
|
|
|
|
|
|
|
Karamu
Drainage Maintenance
|
Hastings District
|
Fixed Amount
|
5,569
|
10.55
|
$58,764
|
10.55
|
$55,966
|
|
|
Karamu
Enhancement
|
Hastings District
|
Fixed Amount
|
5,569
|
9.86
|
$54,935
|
9.86
|
$52,319
|
|
|
|
|
|
|
|
|
|
|
|
Poukawa
Drainage Special Rating Scheme
|
Hastings District
|
Land Value
|
PO1
|
0.66022
|
$31,877
|
$660.22
|
$26,564
|
|
|
Hastings District
|
Land Value
|
PO2
|
0.11003
|
$1,664
|
$100.03
|
$1,393
|
|
|
Hastings District
|
Land Value
|
PO3
|
0.02200
|
$659
|
$22.01
|
$542
|
|
|
TOTAL
|
|
|
|
$34,200
|
|
$28,499
|
|
|
|
|
|
|
|
|
|
|
|
Porangahau
Flood Control
|
Central HB District
|
Land Value
|
|
0.0144
|
$41,602
|
$14.40
|
$39,621
|
|
|
Maraetotara
Flood Maintenance
|
Hastings District
|
Capital Value
|
|
0.0975
|
$11,744
|
$9.75
|
$11,402
|
|
|
Kairakau
Community Scheme
|
Central HB District
|
Uniform Charge
|
80 Rating Units
|
1,205.90
|
$9,647
|
$120.59
|
$9,421
|
|
|
|
|
|
|
|
|
|
|
|
|
|
|
|
|
|
|
|
|
|
|
|
|
|
|
|
|
|
|
|
|
|
|
|
Details of Targeted Rates Calculated within each District and
City
|
|
Groups
of Activities / Rate Type
|
Districts
|
Rates
set on
|
Differentials
|
Calculation
Factor
|
Estimated
Rates Revenue 2014-15
|
Estimated
Amount of $100,000 capital value per property
|
2013/14
Rate
|
|
DRAINAGE SCHEMES
|
|
|
|
|
|
|
|
|
|
|
|
|
Paeroa Drainage Scheme Special Rating Area
|
|
Wairoa District
|
Area Basis
|
P1
|
6734.97
|
$13,349
|
$67.35
|
$13,349
|
|
Wairoa District
|
Area Basis
|
P2
|
4377.73
|
$5,865
|
$43.78
|
$5,864
|
|
Wairoa District
|
Area Basis
|
P3
|
3030.74
|
$1,681
|
$30.31
|
$1,681
|
|
Wairoa District
|
Area Basis
|
P4
|
2357.24
|
$1,442
|
$23.57
|
$1,442
|
|
Wairoa District
|
Area Basis
|
P5
|
336.75
|
$746
|
$3.37
|
$746
|
|
TOTAL
|
|
|
|
$23,082
|
|
$23,082
|
|
|
|
|
|
|
|
|
|
Ohuia Whakaki Drainage
Rating Scheme
|
|
Wairoa District
|
Area Basis
|
A
|
12373.45
|
$36,656
|
$123.73
|
$35,078
|
|
Wairoa District
|
Area Basis
|
B
|
9898.76
|
$8,553
|
$98.98
|
$8,185
|
|
Wairoa District
|
Area Basis
|
C
|
7424.07
|
$5,223
|
$74.24
|
$4,998
|
|
Wairoa District
|
Area Basis
|
D
|
3712.04
|
$13,122
|
$37.12
|
$12,557
|
|
Wairoa District
|
Area Basis
|
E
|
1237.35
|
$2,869
|
$12.37
|
$2,746
|
|
TOTAL
|
|
|
|
$66,424
|
|
$63,564
|
|
|
|
|
|
|
|
|
|
Upper Makara Stream Catchment
Special Rating Scheme
|
|
Central HB District
|
Area Basis
|
A
|
14394.9
|
$7,803
|
$143.94
|
$7,539
|
|
Central HB District
|
Area Basis
|
B
|
11515.92
|
$21,861
|
$115.16
|
$21,122
|
|
Central HB District
|
Area Basis
|
C
|
9356.69
|
$33,140
|
$93.56
|
$32,019
|
|
Central HB District
|
Area Basis
|
D
|
5038.22
|
$6,645
|
$50.38
|
$6,421
|
|
Central HB District
|
Area Basis
|
E
|
719.75
|
$16,609
|
$7.19
|
$16,047
|
|
Central HB District
|
Area Basis
|
F
|
287.90
|
$13,115
|
$2.88
|
$12,671
|
|
|
|
|
|
|
|
|
|
|
|
|
|
$99,173
|
|
$95,819
|
|
|
|
|
|
|
|
|
|
|
|
|
|
|
|
|
|
|
|
|
|
|
|
|
|
|
|
|
|
|
|
Details of Targeted Rates Calculated within each District and
City
|
|
|
Groups of Activities / Rate Type
|
Districts
|
Rates set on
|
Differentials
|
Calculation Factor
|
Estimated Rates Revenue 2014-15
|
Estimated Amount per Hectare
|
2013/14
Rate
|
|
|
|
DRAINAGE SCHEMES
|
|
|
|
|
|
|
|
|
|
|
|
|
|
|
Esk River & Whirinaki Stream Maintenance Scheme
|
|
|
Hastings District
|
Area Basis
|
E1
|
3922.4893
|
$8,808
|
$39.22
|
$9,040
|
|
|
Hastings District
|
Area Basis
|
E2
|
1623.0499
|
$2,396
|
$16.23
|
$2,510
|
|
|
Hastings District
|
Area Basis
|
R11
|
3932.8367
|
$1,214
|
$39.32
|
$1,291
|
|
|
Hastings District
|
Area Basis
|
R12
|
13371.3512
|
$623
|
$133.71
|
$623
|
|
|
Hastings District
|
Area Basis
|
R13
|
43231.250
|
$623
|
$432.31
|
$622
|
|
|
TOTAL
|
|
|
|
$13,665
|
|
$14,087
|
|
|
|
|
|
|
|
|
|
|
|
Hastings District
|
Area Basis
|
W1
|
17257.124
|
$5,330
|
$172.57
|
$5,099
|
|
|
Hastings District
|
Area Basis
|
W2
|
11066.00
|
$515
|
$110.66
|
$515
|
|
|
Hastings District
|
Area Basis
|
W3
|
3577.70
|
$515
|
$35.77
|
$515
|
|
|
Hastings District
|
Area Basis
|
W4
|
19025.50
|
$2,888
|
$190.02
|
$2,700
|
|
|
Hastings District
|
Area Basis
|
W5
|
369.2240
|
$147
|
$3.69
|
$147
|
|
|
Hastings District
|
Area Basis
|
W6
|
4460.606
|
$147
|
$44.60
|
$147
|
|
|
Hastings District
|
Area Basis
|
W7
|
1582.792
|
$147
|
$15.83
|
$147
|
|
|
TOTAL
|
|
|
|
$9,689
|
|
$9,270
|
|
|
Opoho Drainage/Stream
|
|
|
Wairoa District
|
Fixed
Amount
|
A
|
66
|
$13,848
|
$13,848
|
$0
|
|
|
Wairoa District
|
Fixed
Amount
|
B
|
25
|
$5,164
|
$5,164
|
$0
|
|
|
Wairoa District
|
Fixed
Amount
|
C
|
10
|
$2,065
|
$2,065
|
$0
|
|
|
TOTAL
|
|
|
|
$21,077
|
|
$0
|
|
|
|
|
|
|
|
|
|
|
|
|
|
Details of Targeted Rates Calculated within each District and
City
|
|
|
Groups of Activities / Rate Type
|
Districts
|
Rates set on
|
Differentials
|
Calculation Factor
|
Estimated Rates Revenue 2014-15
|
Estimated Amount per Hectare
|
2013/14
Rate
|
|
|
|
DRAINAGE SCHEMES
|
|
|
|
|
|
|
|
|
|
|
|
|
|
|
|
|
Te Ngarue Stream Flood Protection Scheme
|
|
|
Hastings District
|
Area
Basis
|
TN
|
2916.28
|
$2,773
|
$29.16
|
$2,773
|
|
|
Hastings District
|
Area Basis
|
TN1
|
18431.79
|
$155
|
$184.31
|
$155
|
|
|
TOTAL
|
|
|
|
$2,928
|
|
$2,928
|
|
|
|
|
|
|
|
|
|
|
|
Kopuawhara Stream Flood
Control Maintenance Scheme
|
|
|
Wairoa District
|
Area
Basis
|
A
|
15351.4
|
$1,875
|
$153.51
|
$1,821
|
|
|
Wairoa District
|
Area
Basis
|
B
|
6140.5
|
$3,804
|
$61.41
|
$3,693
|
|
|
Wairoa District
|
Area
Basis
|
C
|
3070.2
|
$2,225
|
$30.70
|
$2,160
|
|
|
Wairoa District
|
Area
Basis
|
D
|
767.57
|
$772
|
$7.67
|
$749
|
|
|
TOTAL
|
|
|
|
$8,676
|
|
$8,423
|
|
|
|
|
|
|
|
|
|
|
|
|
Details of Targeted Rates Calculated within each District and
City
|
|
|
Groups
of Activities / Rate Type
|
Districts
|
Rates
set on
|
Differentials
|
Calculation
Factor
|
Estimated
Rates Revenue 2014-15
|
Estimated
Amount 4.047 hectare (10acre) property
|
2013/14
Rate
|
|
|
|
BIOSECURITY
|
|
|
|
|
|
|
|
|
|
|
|
|
|
|
|
|
|
|
Plant Pest Strategy
|
|
|
|
Napier City
|
Area Basis
|
4,474
|
45.62
|
$2,041
|
$1.85
|
$1,963
|
|
|
|
Hastings District
|
Area Basis
|
365,883
|
45.62
|
$166,916
|
$1.85
|
$160,467
|
|
|
|
Wairoa District
|
Area Basis
|
270,247
|
45.62
|
$123,287
|
$1.85
|
$118,557
|
|
|
|
Central HB District
|
Area Basis
|
302,866
|
45.62
|
$138,167
|
$1.85
|
$132,867
|
|
|
|
Taupo District
|
Area Basis
|
21,900
|
45.62
|
$9,991
|
$1.85
|
$9,608
|
|
|
|
Rangitikei District
|
Area Basis
|
17,912
|
45.62
|
$8,171
|
$1.85
|
$7,858
|
|
|
|
TOTAL
|
|
983,282
|
|
$448,573
|
|
$431,320
|
|
|
|
|
|
|
|
|
|
|
|
|
Regional Animal Pest Management Strategy
|
|
|
|
Napier City
|
Area Basis
|
4,475
|
149.77
|
$6,702
|
$6.06
|
$6,464
|
|
|
|
Hastings
District
|
Area Basis
|
300,027
|
149.77
|
$449,350
|
$6.06
|
$431,961
|
|
|
|
Wairoa
District
|
Area Basis
|
207,503
|
149.77
|
$310,777
|
$6.06
|
$299,759
|
|
|
|
Central HB
District
|
Area Basis
|
295,417
|
149.77
|
$442,446
|
$6.06
|
$426,759
|
|
|
|
Taupo
District
|
Area Basis
|
7,996
|
149.77
|
$11,976
|
$6.06
|
$11,551
|
|
|
|
Rangitikei
District
|
Area Basis
|
17,912
|
149.77
|
$26,827
|
$6.06
|
$25,875
|
|
|
|
TOTAL
|
|
833,330
|
|
$1,248,078
|
|
$1,202,369
|
|
|
|
|
|
|
|
|
|
|
|
|
Bovine TB Vector Control
|
|
|
|
Napier City
|
Area Basis
|
4,426
|
59.33
|
$2,626
|
$2.40
|
$2,537
|
|
|
|
Hastings
District
|
Area Basis
|
392,528
|
59.33
|
$232,887
|
$2.40
|
$224,996
|
|
|
|
Wairoa
District
|
Area Basis
|
275,758
|
59.33
|
$163,607
|
$2.40
|
$158,063
|
|
|
|
Central HB
District
|
Area Basis
|
302,978
|
59.33
|
$179,757
|
$2.40
|
$173,666
|
|
|
|
Taupo
District
|
Area Basis
|
34,922
|
59.33
|
$20,719
|
$2.40
|
$20,017
|
|
|
|
Rangitikei
District
|
Area Basis
|
17,912
|
59.33
|
$10,627
|
$2.40
|
$10,266
|
|
|
|
TOTAL
|
|
1,028,524
|
|
$610,223
|
|
$589,545
|
|
|
|
|
|
|
|
|
|
|
|
|
Details of Targeted Rates Calculated within each District and
City
|
|
|
Groups
of Activities / Rate Type
|
Districts
|
Rates
set on
|
Differentials
|
Calculation
Factor
|
Estimated
Rates Revenue 2014-15
|
Estimated
Amount 4.047 hectare (10acre) property
|
2013/14
Rate
|
|
|
|
BIOSECURITY
|
|
|
|
|
Pest Control - Forestry
|
|
|
|
Napier City
|
Area Basis
|
0
|
|
|
|
|
|
|
|
Hastings District
|
Area Basis
|
65,998
|
50.6
|
$33,395
|
$2.05
|
$34,322
|
|
|
|
Wairoa District
|
Area Basis
|
62,744
|
50.6
|
$31,748
|
$2.05
|
$31,748
|
|
|
|
Central HB District
|
Area Basis
|
7,307
|
50.6
|
$3,697
|
$2.05
|
$3,678
|
|
|
|
Taupo District
|
Area Basis
|
13,903
|
50.6
|
$7,035
|
$2.05
|
$7,035
|
|
|
|
Rangitikei District
|
Area Basis
|
|
|
|
|
|
|
|
|
TOTAL
|
|
149,952
|
|
$75,876
|
|
$76,783
|
|
|
|
|
|
|
|
|
|
|
|
|
|
|
|
|
|
|
|
|
|
|
|
|
|
Details of Targeted Rates Calculated within each District and
City
|
|
|
Groups
of Activities / Rate Type
|
Districts
|
Rates
set on
|
Differentials
|
Calculation
Factor
|
Estimated
Rates Revenue 2014-15
|
Estimated
Amount of $100,000 land value per property
|
2013/14
Rate
|
|
|
|
CLEAN HEAT & SOLAR HOT WATER SCHEME
|
|
|
Healthy
Homes
|
Napier City
|
Land Value
|
|
0.00859
|
$352,895
|
$8.59
|
$355,913
|
|
|
(Clean Heat Financial
Assistance)
|
Hastings District
|
Land Value
|
|
0.00874
|
$317,744
|
$8.74
|
$314,726
|
|
|
|
Estimate of Projected
Valuations
|
|
|
0.00873
|
$670,639
|
|
$670,639
|
|
|
|
|
|
|
|
|
|
|
|
|
Rates
to repay loans to homeowners for clean heat, insulation and Solar Hot Water
Scheme
|
|
$10 per $100 loan
|
$10
|
|
$10.00
per $100 loan
|
|
|
|
|
|
|
|
|
|
|
|
|
|
|
|
|
|
|
|
|
|
|
|
|
Details of Targeted Rates Calculated within each District and
City
|
|
|
Groups
of Activities / Rate Type
|
Districts
|
Rates
set on
|
Differentials
|
Calculation
Factor
|
Estimated
Rates Revenue 2014-15
|
Estimated
Amount of $100,000 land value per property
|
2013/14
Rate
|
|
|
|
ECONOMIC DEVELOPMENT
|
|
|
|
Napier City
|
Fixed Amount
|
23728
|
17.53
|
$415,952
|
$17.53
|
$393,170
|
|
|
|
Hastings District
|
Fixed Amount
|
28757
|
17.53
|
$503,877
|
$17.53
|
$475,804
|
|
|
|
Wairoa District
|
Fixed Amount
|
4930
|
14.00
|
$69,020
|
$14.00
|
$64,467
|
|
|
|
Central HB District
|
Fixed Amount
|
6023
|
17.53
|
$105,583
|
$17.53
|
$99,723
|
|
|
|
Taupo District
|
Fixed Amount
|
17
|
17.53
|
$298
|
$17.53
|
$300
|
|
|
|
Rangitikei District
|
Fixed Amount
|
4
|
17.53
|
$70
|
$17.53
|
$66
|
|
|
|
TOTAL
|
|
63459
|
|
$1,094,800
|
|
$1,033,530
|
|
|
|
|
|
|
|
|
|
|
|
|
|
Napier City
|
Capital Value
|
Commercial/
|
0.01308
|
$212,509
|
$13.08
|
$201,607
|
|
|
|
Hastings District
|
Capital Value
|
Industrial
|
0.01315
|
$230,867
|
$13.15
|
$215,855
|
|
|
|
Wairoa District
|
Capital Value
|
|
0.01592
|
$9,180
|
$15.92
|
$9,357
|
|
|
|
Central HB District
|
Capital Value
|
|
0.1353
|
$16,644
|
$13.53
|
$16,123
|
|
|
|
TOTAL
|
|
|
|
$469,200
|
|
$442,942
|
|
|
|
|
|
|
|
|
|
|
|
|
EMERGENCY MANAGEMENT
|
|
|
|
Napier City
|
Fixed Amount
|
26370
|
14.84
|
$391,413
|
$14.84
|
$383,598
|
|
|
|
Hastings District
|
Fixed Amount
|
31116
|
14.84
|
$461,885
|
$14.84
|
$448,849
|
|
|
|
Wairoa District
|
Fixed Amount
|
5182
|
14.84
|
$94,287
|
$14.84
|
$90,355
|
|
|
|
Central HB District
|
Fixed Amount
|
6352
|
14.84
|
$76,924
|
$14.84
|
$78,417
|
|
|
|
TOTAL
|
|
69020
|
|
$1,024,509
|
|
$1,001,219
|
|
|
|
|
|
|
|
|
|
|
|
|
HBRC
2014-15 Annual Plan - Part 3 Financial Information
|
Attachment 4
|
Introduction
Section 36 of the Resource Management Act (RMA) enables local
authorities to allocate fixed charges for various administrative and monitoring
activities to specific resource users. These fixed charges can either be
specific amounts or determined by charging scales.
There are five
types of resource management charges and they relate to:
· consent applications
· compliance and monitoring
· zone based water management
· gravel extraction
· contaminated sites.
1. Charges
Relating to Resource Consent Applications
(other than non-notified gravel extraction applications)
Charges for
receiving, processing and deciding on applications for:
• resource consents
• certificates of compliance
• changes to, cancellation of, or
review of resource consent conditions
• transfers of resource consents
shall comprise
a fixed charge payable in advance (a deposit) and an additional charge payable
once the application has been decided. An additional fixed charge will be
required before notification, and the start of a hearing, if the application
requires these processes.
Fixed Charges for Processing Resource Consent Applications
Tables 1 and 1a set out the fixed charges payable for processing
resource consent applications. These fees are charged in accordance with
Section 36(1)b of the RMA.
Table 1: Fixed charges payable for processing resource consent
applications
(other than Non-notified Gravel Extraction Applications - see Table 3)
|
|
Item
|
Initial
Fixed Fee - Payable upon Lodgment (excl GST)
|
Additional Charge - Payable subsequent to processing
|
|
Land use
application for a bore permit where the application is made by a HBRC
accredited driller.
Land use
application for bore permit where the application is not made by a HBRC
accredited driller
|
$156
$350
|
N/A
N/A
|
|
Changes or cancellations of consent
conditions
|
$500
|
Based on actual and reasonable
costs1
|
|
Review of conditions as specified in
resource consents
|
$320
|
Based on actual and
reasonable costs1
|
|
Transfer a consent to another site
|
$400
|
Based on actual and reasonable
costs 1
|
|
Extensions to lapsed dates for land use
consents and onsite domestic waste water, less than 2m3 a day
|
$150
|
N/A
|
|
Extensions to lapsed dates
|
$200
|
Based on actual and reasonable
costs1
|
|
Transfer of resource consent (1
only, with transfer form completed and signed) to a new owner/occupier or
change of name
|
$85
|
Based on actual and reasonable
costs for non-standard process1
|
|
Transfer of resource consent (2 or
more, with transfer form completed and signed) relating to the same property
to a new owner/occupier or change of name
|
$110
|
Based on actual and reasonable costs
for non-standard process1
|
Section 36(7) of the RMA specifies that where a fixed charge has
not been paid, Council need not perform the action to which the charge relates
until it has been paid in full. HBRC can suspend processing an application until
a fixed charge has been paid.
Table 1 continued:
Fixed
charges payable for processing resource consent Applications
(other
than Non-notified Gravel Extraction Applications - see Table 3 page 57)
|
|
Item
|
Initial
Fixed Fee - Payable upon Lodgment (excl GST)
|
Additional Charge - Payable
subsequent to processing
|
|
Certificate of compliance:
Bore sealing
Other
|
no charge
$300
|
N/A
Based on actual
& reasonable costs1
|
|
On-site wastewater system where the
application is made in conjunction with an accredited designer on a low risk
site
|
$350
|
N/A
|
|
Renewal of Category 1 domestic
on-site wastewater consents (with a good compliance history, and a verified
history of complete wastewater system maintenance servicing by an accredited
installer/service agent).
|
$350
|
Based on actual and reasonable
costs1
|
|
Renewal of all other (Category 2)
domestic on-site wastewater consents.
|
$350
|
Based on actual and reasonable
costs1
|
|
Confirmation of domestic on-site
wastewater Permitted Activity status
|
$150
|
N/A
|
|
Other Individual resource consent
application (including applications for ancillary activities)
|
$1000
|
Based on actual and reasonable
costs1
|
|
Table 1a: Fixed Charges for
Resource Consent Applications Requiring Notification or a Hearing
|
|
Application Type
|
Type of Fixed Fee (excl GST)
|
Additional Charge – Payable subsequent to processing
|
|
Initial
Fixed Fee
|
Fixed Fee: Payable upon notification
|
Fixed fee: Payable 5 days before hearing
|
|
Individual resource consent
application (including applications for ancillary activities)
|
$1000
|
$5000
|
$5000
|
Based on actual and reasonable
costs1
|
|
Application processed as part of a
catchment wide replacement process
|
$1000
|
$1500
|
$1500
|
Based on actual and reasonable
costs3
|
|
Request for Independent
Commissioner under s 100A
|
Fixed fee payable on
requesting a Commissioner
|
Additional Charge
- Payable subsequent to processing
|
|
Fixed fee payable on
requesting an independent commissioner
|
$3000
per commissioner
|
Based on actual
and reasonable costs1 of additional cost incurred as a result of
using an independent commissioner
|
Note 1:
Actual and Reasonable Costs include time spent by staff in receiving,
processing and deciding on the applications, hearing costs and any external
disbursements (which shall include any external expert advice from consultants
at cost). Staff costs shall be calculated by multiplying the actual hours
involved in receiving, processing and granting a consent by the hourly rates
for the staff involved and adding any actual disbursements (as in Table 6); and
adding any hearing costs and any costs of consultants and commissioned reports;
and then subtracting the fixed charge that was paid in advance and any renewal
fees that have been paid in advance. The total calculated amount shall
then, if necessary, be adjusted to reflect HBRC’s actual and reasonable
costs having regard to the factors referred to in section 36(4) of the RMA and
any relevant discounts. (This does not apply to applications which are not
subject to additional charges or refunds).
Note 2: Where a bore field consent is issued for 3 or more bores,
bore inspection and compliance administration shall be carried out at an hourly
rate of $107 per hour.
Note 3: Where an activity requires multiple ancillary consents,
and the application will be processed in a bundle, HBRC may require payment of
only one initial fixed fee (deposit). The deposit shall be equal to the highest
deposit required for any of the applications required, as per Table 1.
|
HBRC
2014-15 Annual Plan - Part 3 Financial Information
|
Attachment 4
|
Additional
Resource Consent Charges
In addition to
these fixed charges, in most cases additional charges will be payable
subsequent to processing, in accordance with Section 36(3) of the RMA.
Refunds
Except for
applications for bore permits, minor administrative changes or cancellations,
wastewater lapse date extensions and waste water consents made in conjunction
with an accredited designer on a low risk site, a portion of the charge as set
out in Tables 1 and 1a will be remitted if the actual cost of receiving,
processing and deciding on the application is less than that already paid.
Hearings
HBRC is
conscious of the cost that can be incurred by applicants when a resource
consent application goes to a hearing. Therefore, the HBRC Hearings Committee
will carefully assess the number of members who will participate in each hearing.
The numbers involved in a hearing panel will usually range from three to a
maximum of five. Where a hearing is required, the following charges shall be
payable by the applicant, except for those costs incurred under s100A of the
RMA:
· actual meeting fee allowances at the rate approved by the
Remuneration Authority, which is currently $80.00 an hour for each committee
member other than the chairman who is paid $100.00 an hour, for each of the
elected and tangata whenua appointed Committee members participating in the
hearing (a six hour hearing with a hearing panel of three members would,
therefore, incur meeting fee allowances for the hearing of $1,560);
· actual mileage for committee members travelling to and from the
hearing at the rate approved by the Remuneration Authority which is currently
77¢ a kilometre;
· actual accommodation costs where it is cheaper for a committee
member to stay overnight rather than return home;
· actual meeting fee allowances for each of the committee members
attending and participating in a formal site inspection, or any meeting
subsequent to the hearing for formal deliberations;
· mileage and accommodation costs associated with any formal site
inspection or deliberation meetings;
· actual costs (including disbursements) of any commissioner
appointed by the Minister of Conservation’s representative;
· the actual cost of staff attendance at a hearing (typically the
Reporting Officer, hearings administrator, decision writer, relevant technical
officers, and the Manager Consents or the Group Manager Resource Management);
· the costs associated with the use of an independent hearing
commissioner where the use of a commissioner has been occasioned by
the application. The apportionment of costs when an independent hearing
commissioner is requested by an applicant and/or submitters is noted below.
Independent hearing commissioner costs will be calculated on an actual and
reasonable basis and include fees for disbursements, reading the application
material, site visit, hearing attendance, deliberations and drafting the
decision.
· the costs for photocopying, hall hire, catering (for the Panel and
Decision Writer), and any administration services relating to hearings and
deliberations will be recovered from the applicant on a case-by-case basis.
Independent Hearing Commissioners (s100A)
Applicants
and/or submitters now have the ability to request that independent
commissioners hear and decide publicly or limited notified applications. If an
applicant makes the request, he or she is responsible for paying all costs
associated with the use of the independent commissioner (as noted above). In
accordance with s36(1)(ab), if one or more submitters requests an independent
commissioner (and the applicant does not), those submitters are responsible for
paying the extra costs incurred as a result of an independent commissioner
being used (compared with the cost of using an elected member).
If a request
is made for an independent commissioner, a fixed charge of $3000 a commissioner
shall be paid at the time of the request. The actual and reasonable costs of
the commissioner will also be charged as an additional charge in accordance
with Section 36(3) of the RMA. HBRC decides which accredited independent
commissioner(s) will be appointed to the Hearing Panel.
Hearing Decision Writers
The following
charges shall be payable by the applicant except for those costs incurred under
s 100A of the RMA:
· The cost of the decision writer to attend the hearing and
deliberations, and the decision writing time. Where the decision writer is an
independent commissioner sitting as a panel member, the commissioner’s
time to attend the hearing and deliberations will be charged at actual cost.
However, the additional cost of using an independent consultant to write the
decision will not be charged to the applicant. That is, the cost of the
decision writing time will be charged to the applicant at the same rate as if a
HBRC senior consent officer were undertaking the work.
· Where the decision writer is an external consultant not sitting as
a panel member any additional cost of the consultant’s time to attend the
hearing and deliberations, and to write the decision will not be charged to the
applicant. That is, the consultant’s time will be charged to the
applicant at the same rate as if a HBRC senior consent officer were undertaking
the work.
Charging for Consultants
· Where the use of consultants is required to provide particular
technical input to the consent process, and the use is occasioned by the
application, the applicant will be responsible for the actual costs charged by
the consultant.
· Where the use of consultants has not been occasioned by an
application, for example, where workloads are such that in-house expertise
exists but is unavailable, the applicant will be charged for the use of the
consultant at a rate capped at what would have been charged by HBRC’s
in-house staff, as in Table 6.
Contribution to the costs of
Commissioning Reports in accordance with Section 92(2)
HBRC may, from
time to time, commission reports in accordance with Section 92(2) of the RMA,
to determine the cumulative effects of an activity according to resource
consent applications. Where the activity meets the following criteria, the HBRC
may contribute to the costs of preparing the report to a maximum of 25%, up to
a maximum of $5000. The HBRC’s contribution is at the discretion of the
Group Manager, Resource Management, and the following criteria must be met for
a discount to be considered:
· The commissioned report must directly inform a plan change that
the HBRC has committed to in the applicable Long Term Council Community Plan,
and/or
· The commissioned report must develop a method, or provide
information that is applicable to sites beyond the immediate scope of the
application, and
· The commissioned report must contain information that is of
benefit to the regional community as a whole.
2. Charges to Holders of Resource Consents for
Compliance and Impact Monitoring
Charges for
the monitoring, administration and supervision of resource consents have been
determined based on an estimate of the time for carrying out the inspection/s,
assessment, reporting and administration associated with that monitoring.
Basic Charge
Consent
holders whose consents require no more than a single annual inspection, and/or
information return, and/or a single sampling undertaken by HBRC staff at the
same time as the inspection will be charged as in Table 2. Table 2 does not
include water takes with a water measuring device. Consent holders should check
the conditions of the consent to determine whether sampling, water use or other
information is required.
These charges
are invoiced after inspection for one-off inspections, or at the end of the
financial year for the consents that either have more than one inspection or
ongoing monitoring throughout the year.
|
Table 2: Monitoring Task (excluding water takes with water measuring
device)
|
Fixed
Basic Annual Charge (Excl GST)
|
|
Inspection and associated reporting
and administration
|
$374
|
|
Inspection and associated reporting
and administration of unmetered water takes
|
$290
|
|
Additional inspection, reporting
and administration charges where a resource consent authorises groundwater
takes from more than two wells
|
$68.40 - each additional well over
2.
|
|
Additional inspection, reporting
and administration charges where additional consents under the same ownership
and invoiced collectively, within 5km of each other, and able to be inspected
on the same day
|
$227 - each additional consent.
|
|
Sampling time (sampling analysis
will be at cost – see Table 4)
|
$107
|
|
Other information returns
|
$107
|
An additional
charge will only be made to consent holders whose consents fall under the
description for the basic charge, where extra compliance monitoring is required
as a result of non-compliance with consent conditions or where extra time is
spent following up suspected non-compliance where a consent holder has not
supplied sufficient information to demonstrate compliance.
Water Measuring Device Charges
Charges to
holders of resource consents to take water which require a water measuring
device.
|
Table 2a: Monitoring
Water Takes with Water Measuring Devices
|
Annual
Charge (Excl GST)
|
|
Sampling time (sampling analysis
will be at cost – see Table 4)
|
$107
|
|
Water use returns
& Audits – Telemetered, Web/Text entry
Each additional
water measuring device
|
$188
$30
|
|
Water use returns
& Audits – Fax/Email/Standard Mail
Each additional
water measuring device
|
$230
$63
|
|
Where water measuring devices do
not meet HBRC’s approved devices criteria or are not installed by an approved
installer, a full compliance audit will be undertaken.
|
$374
|
|
Non exercised consent
|
$80
|
An additional
charge will only be made where extra compliance monitoring is required as a
result of non-compliance with consent conditions or where water takes require
additional monitoring or data returns over and above water use returns.
Monitoring of RMA Regulations
Where HBRC is
required to monitor regulations under the Resource Management Act, a fixed
charge of $107 for the first hour, and then additional charges based on actual
and reasonable charges in Table 6 will be charged.
Actual and Reasonable Charge
Consent
holders whose consents are subject to more than a single inspection a year
and/or are subject to specific conditions, will be subject to the basic charge
for the first inspection plus an additional charge based on the actual and
reasonable costs to undertake the total annual monitoring activity.
For new
consents, the consent holder will be advised of the likely annual monitoring
costs when the consent is issued; thereafter the previous year’s
monitoring costs will act as an indication of monitoring costs.
Additional Charges for Compliance Monitoring
Where an
additional charge is to be made, this shall be calculated by multiplying the
actual hours involved in undertaking monitoring of the consent by the hourly
rate for the staff involved and adding any actual disbursements (as in Table
6). The total calculated shall then, if necessary, be adjusted to reflect
HBRC's actual and reasonable costs having regard to the factors referred to in
section 36(4) of the RMA.
Incentives for Full Compliance
When a consent
holder consistently achieves full compliance (a Grade 1 in two consecutive
years) the frequency of on-site monitoring may be reduced. An annual inspection
may reduce to once every two years or more if the scale of the activity and
continued compliance warrants it. Quarterly inspections may reduce to six
monthly inspections. The reduction in frequency will be at the discretion of
the Manager of Compliance and Pollution Response. Random inspections may be
undertaken at no cost to the consent holder to ensure continued compliance
during the intervening period.
Monitoring of Domestic On-site Wastewater Treatment Systems
Charges
Consent
holders with an on-site wastewater treatment system type that is not on the
HBRC’s Accredited Manufacturer list, and who do not have that system
installed and serviced by a person or company on the Accredited Installer and
Service Agent list will be subject to an annual monitoring cost of $374.
Consent
holders with an on-site wastewater treatment system type that is on the
HBRC’s accredited list and is installed and maintained by an accredited installer/service
person or company will not be subject to routine compliance inspection fees.
Charges to holders of Resource Consents
for Low Flow Monitoring
For holders of
consents to take water where the abstraction is subject to low flow limits
(directly or via gallery intake or wells), the cost of monitoring the low flows
will be recovered for each water take subject to low flow restrictions
(excluding any frost consents that are from the same take point as a irrigation
consent, held in the same consent holders name):
· A charge of $100 each primary consent (excl GST)
· Should all of the fixed charge not be adequate to recover
the actual and reasonable costs associated with the entire low flow
monitoring program, an additional charge shall be added to all consents that
are subject to the above low flow fixed charge, to recover the actual and
reasonable costs incurred.
3. Charges to holders
of Resource Consents for Freshwater Management Research/Investigations and
Monitoring (Zone Based Water Science Charges)
HBRC policy is
to recover 35% of the total costs of investigation and monitoring of freshwater
resources from holders of resource consents to take or dam water, or to
discharge into water or onto land that may enter water. This recognises that
while all residents of the region receive benefits from the sustainable
management of our freshwater resources, resource users receive greater benefits
than other land owners.
As part of the
2010/11 Annual Plan development HBRC consulted on the proposed charging with
all existing current consent holders.
Allocation of Charges
The costs
attributed under this charge are derived from the water investigation and
monitoring projects with a proposed total cost to be recovered from consent
holders of $1,180,000 excl GST in 2012-13. HBRC has agreed to directly
subsidise $87,000 from the HBRC’s Sale of Land (non investment account).
This subsidy ($87,000) will be available for years 2012-13 to 2014-15.
Costs are
recovered from consent holders using a hybrid zone and regional based approach.
Twenty per cent of the costs will be charged as a fixed portion (regional) and distributed uniformly among all current consent holders.
This is estimated to be $83, excluding
GST, per consent for 2012-13. The
remaining 80% of the costs (zone based) are separately attributed to the five
major categories of consent holders (surface water takes, groundwater takes
(stream depleting – hybrid SW/GW), hydro water takes, discharges to water
and discharges to land consents). Charges are weighted against individual
allocated volume m3 for water takes, and a pollution index score for
discharge consents.
Charges are
weighted against consented volumes not actual use, non-exercised/partially
exercised consents do not receive dispensation. HBRC consents will be excluded
from these charges.
The pollution
index score for each discharge subtype will be reviewed yearly and preformed by
a suitably qualified scientist.
Charges are
struck against the current consent holder at the time of invoicing, no yearly
apportioning will apply other than a 1 month discount for consents expiring
31 May. Charges lie where they fall. Charges are payable by the date
specified on the invoice, the 2 to 5 year payment plan trialled in 2011-12 will
not be offered due to the low take up rate.
Domestic on
site wastewater consents from a single domestic dwelling are excluded from the
charging. A 25% discount is struck against the irrigation component of dam fill
consents, short term takes and discharges associated with a land use consent
are excluded.
Compliance Monitoring, Administration Charges and Financial
Contributions
Compliance
monitoring, administration charges and financial contributions are based on the
volume of gravel extracted; the source of the gravel; and its quality. The
categories include:
· inferior grade material (as determined by HBRC staff);
· material extracted from above the confluence of the Tukipo and
Mangaonuku River tributaries of the Tukituki and Waipawa rivers (Upper Tukituki
catchment);
· all other material.
The financial
contribution is established in the Regional Resource Management Plan under
Section 108 of the Resource Management Act 1991.
Resource
consent charges for gravel extraction are due and payable monthly on the same
day as extraction declarations.
4. Charges
for Gravel Extraction Land Use Consents
Charges for Non-notified Applications
A charge
payable in advance for receiving, processing and deciding on non-notified land
use consent applications to extract gravel:
· 0-50 cubic metres $20
· 50 cubic metres and over $80
(For charges
for notified gravel extraction land use consents, see Table 1 and associated
text.)
Table 3: Gravel Extraction Charges based on $ per Cubic Metre Extracted
per annum (Excluding GST)
|
|
|
State
of Environment Monitoring Charge (S35 of RMA)
|
Compliance / Allocation Charge (S36 of RMA)
|
Financial Contribution (S108 of RMA)
|
Total
|
|
Upper Tukituki catchment
|
No charge
|
$0.20
|
No charge
|
$0.20
|
|
Inferior grade
|
$0.12
|
No charge
|
$0.08
|
$0.20
|
|
All Other
|
$0.12
|
$0.60
|
$0.08
|
$0.80
|
5. Charges for the Preparation of, or Change
to the Regional Policy Statement or a Regional Plan
Applicants for
the preparation of or change to the Regional Policy Statement or any regional
plan will be subject to the following fixed charge payable in advance: $1000
(excl GST).
If the actual
costs incurred by HBRC in preparing, varying or changing the Regional Policy
Statement or any regional plan exceed the charge payable in advance, then these
costs may be recovered by way of an additional charge. The additional charge
shall be based on actual costs as calculated by multiplying the actual hours
involved in preparing or changing the Regional Policy Statement or any regional
plan by the hourly rates for staff involved (see Table 6), adding any actual
disbursements (see Table 6) and subtracting the charge referred to above. The
total calculated amount shall then, if necessary, be adjusted to reflect HBRC's
actual and reasonable costs having regard to the factors referred to in section
36(4) of the Resource Management Act (RMA). An additional charge is levied under subsection 36(3)
of the RMA and such charges are subject to objection and appeal under section
36(6) of the RMA.
|
HBRC
2014-15 Annual Plan - Part 3 Financial Information
|
Attachment 4
|
Building Act Charges
Introduction
The processing
of building consents for dams and issuing of Project Information Memoranda
(PIMs) for dams and administering dam safety regulations are new statutory
functions for the HBRC under the Building Act (2004) and its amendments. Dam
safety regulations become operative on 1 July 2010. Amounts stated for Building
Act charges below are exclusive of GST.
PIM Costs
A fixed charge
(deposit) is payable in advance, and an additional charge may be payable once
the application has been decided. The fixed charge for this is listed in Table
4.
Building
Consent Costs
This function
has been transferred to Waikato Regional Council (WRC). The transfer agreement
specifies that Building Consent costs will be recovered on an actual and
reasonable basis, with hourly rates and fixed charges from WRC. These charges
are set and recovered directly by WRC. Any HBRC processing costs will be as
specified in Table 4 under Resource Management Charges.
Certificate
of Acceptance Costs
This function
is retained by HBRC, but WRC will provide technical advice into the process. A
fixed charge (deposit) is payable in advance, and an additional charge may be
payable once the application has been decided. The fixed charge for this is
listed in Table 4.
Department
of Building and Housing and Building Research Authority of New Zealand Levies
Department of
Building and Housing (DBH) and Building Research Authority of New Zealand
(BRANZ) levies were required by regulation on 1 March 2008. These levies may
change in accordance with amendments made to regulations. The Hawke’s Bay
Regional Council (HBRC) is required to collect and pay DBH and BRANZ levies as
regulated for all Building Consent Applications and Certificate of Acceptance
Applications.
The following
fees apply to all building work with an estimated value greater than $20,000 -
DBH levy – $2.01 for every $1000 (or part of $1000) of the estimated
value of the building work. BRANZ levy – $1 for every $1000 (or part of
$1000) of the estimated value of the building work.
|
Table 4: Fixed Charges (Deposit) for Building Act Applications
(Excluding GST)
|
|
Item
|
PIM
|
Certificate of
Acceptance
|
Amendment to Compliance
Schedule
|
|
Large Dam
(above $100,000 value)
|
$1000
|
$4000
|
$1000
|
|
Medium Dam
($20,000 to <$100,000 value)
|
$750
|
$2000
|
$1000
|
|
Small Dam
($0 to <$20,000 value)
|
$500
|
$500
|
$1000
|
Additional
Building Act Charges
Where an
additional charge is to be made, the charge will be recovered on an actual and
reasonable basis. This shall be calculated by multiplying the actual hours
involved in undertaking monitoring of the application by the hourly rate for
the staff involved and adding any actual disbursements (as in Table 4).
An additional
charge will apply to:
· all PIMs, Certificate of Acceptance Applications, and Amendment to
a Compliance Schedule applications when the fixed charge does not cover the
costs of processing.
· all other unspecified Building Act duties that deal with its
application, processing or compliance, and are attributable directly to a dam.
These charges are payable by the owner of a dam.
|
HBRC
2014-15 Annual Plan - Part 3 Financial Information
|
Attachment 4
|
Standard Charges under the Maritime Transport Act 1994 - Marine
Tier 1 Oil Transfer Sites
Maritime Rule
Part 130B requires that the operator of an oil transfer site obtain the
approval for a site marine oil spill contingency plan from the Director of
Maritime New Zealand. The power to approve these plans has been delegated by
the Director to the Chief Executive (sub-delegated to HBRC Regional On Scene
Commanders) of HBRC in an Instrument of Delegation pursuant to Section 444(2)
of the Maritime Transport Act 1994. Section 444(12) of the Maritime Transport
Act 1994 allows HBRC to charge a person a reasonable fee for:
· Approving Tier 1 site marine oil spill contingency plans and any
subsequent amendments
|
Table
5: Navigation and Safety
Charges
|
|
Licence
Type
Vessels
not Under Safe Ship Management
|
Annual Charge Payable in Advance (Excluding GST)
|
|
Passenger Vessel Licence
– Passenger Vessel
Owner’s Licence
– Passenger
Vessel Licence (per vessel)
|
$100
$40
|
|
Hireboat Licence
– Hireboat Owner’s
licence
|
$100
|
|
Pilot-exemption
Recommendations/Revalidation
|
$300
|
|
Applications for Suspension or
Exemptions under Bylaw 5.1
Public
Notification
|
Actual Advertising Costs
|
· Inspecting Tier 1 sites and any subsequent action taken thereafter
in respect of preparation of inspection reports or reporting on non-conformance
issues.
Tier 1 Site
operators shall be charged a basic charge of $312 per Tier 1 Marine Oil Spill
Contingency Plan approval. Where the cost incurred by HBRC when approving a
contingency plan is greater than $350, the Tier 1 Site operator will be charged
the actual and reasonable cost.
Inspecting
Tier 1 sites, auditing response exercises and subsequent follow up reports and
corrective actions shall be charged the actual and reasonable cost of the
required work.
Actual and
reasonable charges shall be calculated using the hourly rates listed in the
Charge Rates section, Table 6.
Navigation and Safety By-laws Charges
The Local
Government Act enables HBRC to charge for various functions it undertakes in
accordance with the Navigation and Safety By-laws.
A fixed charge
of $183 will be charged to all vessels requiring a permit to be issued outside
the hours of 8am – 4pm on a normal working day.
Internal and
external costs incurred responding to breaches of Navigation and Safety
By-laws, securing of vessels, responding to unseaworthy or sinking vessels, and
other tasks required to be undertaken to ensure safe navigation can be
maintained, shall be charged actual and reasonable costs (Table 5) to the
master, owner or person who caused the cost to be incurred.
|
HBRC
2014-15 Annual Plan - Part 3 Financial Information
|
Attachment 4
|
Charges Relating to Contaminated Site Management
These charges
are set in accordance with section 150 of the Local Government Act 2002.
|
Table
3a: Charges relating to contaminated sites
|
|
Where a party
requests information about the ‘contaminated site’ status of a
property
|
A
charge of $200
An additional
charge based on actual and reasonable costs may apply if a site inspection is
required
|
|
Where a party
requests HBRC review and comment on contaminated site investigation and
remediation reports
|
Actual and
reasonable charges will apply
|
|
Where a party
requests more extensive involvement of HBRC staff
|
A charge based on
the actual and reasonable costs of staff time incurred
|
Charges for
the Provision of Information
The Regional
Council (HBRC) shall charge for the provision of any information including the
Regional Policy Statement, regional plans and resource consents as follows.
· The first hour of time spent actioning a request for information
on each or any occasion relating to the same general matter shall be provided
free of charge.
· HBRC reserves its rights under section 13 of the Local Government
Official Information and Meetings Act 1987 (LGOIMA) to charge for the provision
of information above one hour. HBRC delegates the decision for treating
requests made by the same person and in quick succession as one request, to the
Chief Executive.
· Staff time spent actioning any request over and above the time
provided free of charge shall be charged at the rates set out in Table 6. HBRC
may also choose to require payment in advance.
· The first 20 pages of black and white photocopying on standard A4
or A3 paper shall be provided free of charge.
· Where the total number of pages of photocopying is in excess of 20
then the rates set out in Table 6 will apply.
· In alignment with the LGOIMA, HBRC does not consider requests for
explanations in its definition of information requests.
|
Table 6: Charge rates (excl GST) for the purpose of calculating actual costs per hour
|
|
Item
|
Per Hour
|
|
Executive
|
$125
|
|
Asset Management
|
$98
|
|
Environmental Science
|
$95
|
|
Strategic Direction
|
$99
|
|
Environmental Regulation
Resource consent
processing
Resource consent
administration
Management input
into resource consent processing including attendance at hearings and during
deliberations
Compliance/impact
monitoring of consents and Approving, monitoring & auditing of Tier 1
Marine Oil Spill Contingency Plans, and monitoring of Resource Management Act
regulations
All other tasks,
consent processing
All other tasks,
compliance monitoring
|
$123
$82
$126
$107
$82
$85
|
|
Environmental Information
|
$75
|
|
Land Management
|
$85
|
|
Disbursement costs shall be charged
at the rates of:
Accommodation
Public
notification
Photocopying
External
laboratory testing
Consultant fees
|
$150 a night per
person
Actual advertising
costs
20c per A4 page
B&W; 40c per A4 page colour; 30c per A3 page B&W; 70c per A2 page
B&W
actual cost
actual cost
|
For Information Only
Charges by the Crown
HBRC is
responsible for collecting the following Crown fees, rents and royalties in
addition to its charges:
In the Coastal
Marine Area:
· Extraction of sand and gravel - $1.51 excluding GST per cubic
metre royalty;
· Rent for the occupation of land from the Crown;
· Geothermal royalties.
Due Dates for Payment
· Charges payable in advance for consent applications are due on the
filing of an application.
· Charges payable for photocopying of less than $20 are due on
collection of the copies.
· All other charges will be due and payable on the 20th
of the month following date of the invoice.
Cost of Debt Recovery
All debt
collection costs incurred by HBRC in relation to the activities covered in this
part shall be borne as a debt by the party whose actions caused the initial
charge.
|
HBRC
2014-15 Annual Plan - Part 3 Financial Information
|
Attachment 4
|
The list below provides definitions of terms and acronyms
frequently used within this Annual Plan.
ACC Accident Compensation Corporation
AEP Annual Exceedance Probability, the chance of a flood of a given
size occurring in any one year
AHB Animal Health Board
AO Audit Office, which checks council plans and financial statements for compliance with legislation and standards
of practice
AQMS Air
Quality Monitoring Strategy
Airshed
A defined geographic area where air pollution is monitored.
This area is legally gazetted by the government.
BASS Better Administrative Support Systems
BOI Board of Inquiry
CAPEX Capital Expenditure (budget to purchase assets)
CCTOs Council
Controlled Trading Organisations
CDEM Civil Defence Emergency Management
CE Chief Executive
CHBDC Central Hawke’s Bay District Council
Class
Vie or Class VIIe A measure of the gradient of the land,
with Class VIIe being the steepest land with a high risk of eroding
Clean
Heat Hawke’s
Bay Regional Council’s insulation and clean heating funding assistance
programme for homeowners
CMA Coastal Marine Area
CPI Consumer Price Index
CRI Crown Research Institute
DHB District
Health Board
DOC Department
of Conservation
ECAN Environment Canterbury Regional Council
EECA Energy Efficiency & Conservation Authority
EMO Emergency Management Officer
EOC Emergency Operations Centre (for CDEM)
EPA Environmental Protection Authority
ERMA Environmental Risk Management Authority
ETS Emissions Trading Scheme
EW Environment Waikato (Waikato Regional Council)
Flood
event (or
rainfall event) a period in which flood or rain is monitored for hazard warning
GDP Gross
Domestic Product
GE Genetic Engineering
GIS Geographic Information System
GMO Genetically Modified Organism
Hapu Maori sub-tribe
HASNO Hazardous Substances and New Organisms Act
HBCDEM Hawke’s Bay Civil Defence Emergency Management
HBRC Hawke’s Bay Regional Council
HBRIC Ltd Hawke’s Bay Regional Investment Company
HDC Hastings District Council
Horizons Manawatu-Wanganui Regional Council
HPFCS Heretaunga Plains Flood Control Scheme
HPUDS Heretaunga Plains Urban Development Strategy
IRR Internal
Rate of Return
ISO International
Organisation for Standardisation
Iwi Maori tribe
Kaitiaki Maori term for guardianship
KPI Key Performance Indicator
Kyoto
Protocol United
Nations Framework Convention on Climate Change
LAPP Local Authority Protection Programme
LGA Local Government Act
LGNZ Local Government New Zealand
LGOIMA Local
Government Official Information and Meetings Act 1987
LOS Level of Service
LTCCP Long Term Council Community Plan – former name for Ten Year
Plan or Long Term Plan
LTP Long Term Plan, a 10 year plan required to be produced every 3
years by all councils in New Zealand
McLean
Scale A method for measuring populations of rabbits on land
MPI Ministry for Primary Industries - previously called Ministry of Agriculture and Forestry (MAF)
MTA Maritime
Transport Act
1994
MTI Maungaharuru-Tangitu Iwi Incorporated, the mandated body for
several hapu in the Tangoio, Tutira, and Maungaharuru areas
MoU Memorandum of Understanding
NCC Napier City Council
NES National Environmental Standard
NGO Non Government Organisation
NKII Ngati Kahungunu Iwi Incorporated
NPS National Policy Statement
NZ
GAAP New
Zealand Generally Accepted Accounting Practice
NZTA New Zealand Transport Agency
NZCPS New Zealand Coastal Policy Statement
PCA Pest
Control Area
PIF Performance Improvement Framework
PM 10 Particulate matter of 10 microns in size -This is very fine
material (in dust , smoke or sea spray) which can get into people’s lungs
and cause respiratory illness; Air quality monitoring measures the amount of PM10 in the air
PONL Port of Napier Limited trading as Napier Port
RCEP Regional Coastal Environment Plan
Rates Please refer to Targeted Rates, UAGC and UAC
RID Rating
Information Database
RLS Regional Landcare Scheme
RLTS Regional Land Transport Strategy
RMA Resource Management Act
RPMS Regional
Pest Management Strategy
RPS Regional Policy Statement
RRMP Regional Resource Management Plan
RSAP Regional Safety Action Plan
SOE State of the Environment
SOI Statement of Intent
TAG Technical Advisory Group
Targeted
Rates Rates set against particular properties, to fund activities
specific to that area
Tb or
TB [Bovine]
Tuberculosis, an infectious disease of cattle
Telemetry Device that can automatically transmit and record
various monitoring information, such as water use and soil moisture levels
TLA Territorial local authority – a legal term for a city or
district council
TOR Terms of Reference
Total
Control Management level for plant or animal pests
TTOH Te Taiwhenua o Heretaunga
TTOT Te Taiwhenua o o Tamatea
UAC Uniform Annual Charge, a targeted rating method where a fixed
amount is charged on each property within a specific area
UAGC Uniform Annual General Charge, a fixed amount charged on each
property
Vector
control Pest control to prevent the spread of disease by
‘vectors’ or carriers (i.e. TB Vector control )
VTR Voluntary Targeted Rate
WCO Water Conservation Order
WDC Wairoa District Council