Meeting of the Hawke's Bay Regional Council Maori
Committee
Date: Tuesday 24 June 2014
Time: 10.15am
|
Venue:
|
Council Chamber
Hawke's Bay Regional Council
159 Dalton Street
NAPIER
|
Agenda
Item Subject Page
1. Welcome/Notices/Apologies
2. Conflict
of Interest Declarations
3. Short Term
Replacements 3
4. Confirmation of
Minutes of the Maori Committee held on 29 April 2014
5. Matters Arising
from Minutes of the Maori Committee held on 29 April 2014
6. Call for any Minor
Items Not on the Agenda 5
7. Follow Ups
from Previous Maori Committee Meetings 7
Information or Performance Monitoring
8. Verbal
presentation on Mana Ake by Marei Apatu – 10.30am
9. Presentation from
Nga Hapu o Tutaekuri
10. Update on Current Issues by
the Interim Chief Executive
11. Planning for the Development
of the Next Long Term Plan 2015-25 11
12. Options for Future of Maori
Committee 13
13. River Gravel Update 15
14. Science Reports - June 2014
Update 19
15. RMA Section 35a Requirements 95
16. Statutory Advocacy Update 99
17. Minor Items Not on the Agenda 105
Please Note - Pre Meeting for Māori Members of
the Committee begins at 9 am
1.
Two hour on-road parking
is available in Vautier Street at the rear of the HBRC Building.
2.
The public park in
Vautier Street on the old Council site costs only $4 for all day parking. This
cost will be reimbursed by Council.
3.
There are limited
parking spaces (3) for visitors in the HBRC car park – entry off Vautier
Street - it would be appropriate that the “Visitors” parks
be available for the Members travelling distances from Wairoa and CHB
N.B. Any
carparks that have yellow markings should NOT be used to park in.
HAWKE’S BAY REGIONAL COUNCIL
Maori
Committee
Tuesday 24 June 2014
SUBJECT: Short Term Replacements
REASON FOR REPORT:
1. Council has made allowance in the terms of reference of the Committee
for short term replacements to be appointed to the Committee where the usual
member/s cannot stand.
|
RECOMMENDATION:
That the
Maori Committee agree:
That ______________ be appointed as
member/s of the Maori Committee of the Hawke’s Bay Regional Council for
the meeting of Tuesday, 24 June 2014 as short term replacements(s) on the
Committee for ________________
|
|
Viv Moule
Human
Resources Manager
|
Liz Lambert
Chief
Executive
|
Attachment/s
There are no
attachments for this report.
HAWKE’S BAY REGIONAL COUNCIL
Maori
Committee
Tuesday 24 June 2014
SUBJECT: Call for any Minor Items Not on the Agenda
Reason for Report
1. Under standing orders, SO 3.7.6:
“Where an item is not on the agenda
for a meeting,
(a) That item
may be discussed at that meeting if:
(i) that
item is a minor matter relating to the general business of the local authority;
and
(ii) the
presiding member explains at the beginning of the meeting, at a time when it is
open to the public, that the item will be discussed at the meeting; but
(b) No
resolution, decision, or recommendation may be made in respect of that item
except to refer that item to a subsequent meeting of the local authority for
further discussion.”
2. The Chairman will request any items councillors wish to be added for
discussion at today’s meeting and these will be duly noted, if accepted
by the Chairman, for discussion as Agenda Item 16
|
Recommendations
That Maori
Committee accepts the following minor items not on the agenda, for discussion
as item 16.
1.
|
|
Paul Drury
Group
Manager Corporate Services
|
|
HAWKE’S BAY REGIONAL
COUNCIL
Maori
Committee
Tuesday 24 June 2014
SUBJECT: Follow Ups from Previous Maori
Committee Meetings
Introduction
1. Attachment 1 lists items raised at previous meetings that require
actions or follow-ups. All action items indicate who is responsible for each
action, when it is expected to be completed and a brief status comment. Once
the items have been completed and reported to Council they will be removed from
the list.
Decision
Making Process
2. Council is required to make a decision in
accordance with Part 6 Sub-Part 1, of the Local Government Act 2002 (the Act).
Staff have assessed the requirements contained within this section of the Act
in relation to this item and have concluded that as this report is for
information only and no decision is required in terms of the Local Government
Act’s provisions, the decision making procedures set out in the Act do
not apply.
|
Recommendation
1. That the Maori Committee receives the report
“Follow ups Items from Previous Maori Committee Meetings”.
|
|
Liz Lambert
Chief
Executive
|
|
Attachment/s
|
Follow
up Items
|
Attachment 1
|
Follow Ups
from Previous Maori Committee Meetings
29 April 2014 meeting
|
|
Agenda Item
|
Action
|
Person Responsible
|
Due Date
|
Status Comment
|
|
1.
|
Marae Water issues – A Verbal
Update by Mr Des Ratima
|
Meeting with CE and
Chairman
|
LL/VM
|
24 June
|
Verbal update at 24 June meeting
|
|
2.
|
Future of Maori Committee
|
A workshop to be held
|
VM/MH
|
24 June
|
Verbal update of workshop discussions
|
|
3.
|
Healthy Homes Presentation
|
Meeting with Regional
CEs
|
LL/VM
|
24 June
|
Update at 24 June meeting
|
HAWKE’S BAY REGIONAL
COUNCIL
Maori
Committee
Tuesday 24 June 2014
SUBJECT: Planning for the Development of the
Next Long Term Plan 2015-25
Reason for Report
1. The purpose of this report is to introduce the planning process for
the development of the next Long Term Plan and to signal the opportunity for
the Maori Committee to think about what Council should be doing in relation to
matters of interest to tangata whenua. The Long Term Plan outlines the
Council strategic direction for the 10 year period from 2015 to 2025 and
Background
2. Under the Local Government Act, Council is required to prepare a
Long Term Plan for a 10 year period every three years. There is a
considerable focus on land and water management both in terms of science
investigations and planning as well as finding solutions to improve water
quality and water security. Pest control, flood control and civil defence and
emergency management also continue to be key work programmes.
Key Drivers for the next 10 Years
3. The Council has just started its planning for the Long Term Plan and
has had one strategic planning workshop so far. At that workshop, the following
key issues and drivers were identified as continuing to be relevant or
increasing in its relevance:
3.1. Land and water management
3.2. Regional preparedness for climate change
3.3. Regional Council’s role in regional infrastructure
3.4. Regional Council’s role in economic development
3.5. Regional Council’s role in advocating on social issues facing
the region
3.6. How Regional Council engages with tangata whenua both at a
governance level and operational level, particularly in relation to planning
processes
3.7. Relationships with Post Treaty Settlement entities
Tangata whenua Kaupapa
4. This is an opportunity for the Maori Committee to reflect on matters
of importance to hapu, marae and Ngati Kahungunu in general that align with or
are relevant to the Regional Council’s strategic direction and
functions. Committee members and the groups you represent have no doubt
been involved in hui over the last three years where various matters that might
be relevant to the Long Term Plan have been discussed.
5. The Committee might also like to consider the effectiveness of
Council’s engagement with tangata whenua and provide some feedback on
that matter
6. Other matters that the Committee might consider include:
6.1. How to progress the development of iwi or hapu management plans
6.2. How tangata whenua can create better engagement to enhance capacity
building with Council
6.3. The potential for Maori agri-business
6.4. How to enable direct Council engagement with hapu/marae on matters
of direct relevance
6.5. How marae facilities and communities can support civil defence
response and recovery operations
7. While it is hoped that there could be some initial korero at this
meeting, Committee members will no doubt like to discuss this further with
their groups. It is hoped that members could report back at the August
meeting on some key matters that tangata whenua would like Council to consider
as part of the Long Term Plan development process.
Decision Making
Process
8. Council is required to make a decision in accordance with Part 6
Sub-Part 1, of the Local Government Act 2002 (the Act). Staff have
assessed the requirements contained within this section of the Act in relation
to this item and have concluded that, as this report is for information only
and no decision is to be made, the decision making provisions of the Local
Government Act 2002 do not apply.
|
Recommendation
1. That the Maori Committee
identifies and considers matters of importance to tangata whenua
that are aligned to Council’s strategic direction and responsibilities,
and reports back to the
August meeting of the Maori Committee in relation to those matters.
|
|
Viv Moule
Human
Resources Manager
|
Helen Codlin
Group
Manager Strategic Development
|
Attachment/s
There are no
attachments for this report.
HAWKE’S BAY REGIONAL
COUNCIL
Maori
Committee
Tuesday 24 June 2014
SUBJECT: Options for Future of Maori Committee
Reason for Report
1. At the April meeting of the Maori Committee it was decided that the
Maori Committee would consider options for the future of the Maori Committee as
a workshop prior to the June meeting of the Committee.
2. This paper provides for an opportunity to bring any
decisions/recommendations from that workshop to this meeting of the Committee
for further discussion and as a means for making a recommendation to the
Regional Council (if that is appropriate).
Background
3. With the re-establishment of the present Maori Committee after the
October 2013 elections, it was decided that there would be a review of the role
and function of the Committee by June 2014.
4. Members discussed, at the April meeting, the background of the
Committee, which was first established in 1990 and the changes that have taken
place since then.
5. In light of some of the changes that have evolved and those that are
likely to occur as Treaty settlements are concluded, it was felt appropriate to
consider whether the present Maori committee arrangement best served tangata
whenua interests in their dealings with the Regional Council or whether
something more appropriate should be considered.
6. Two important factors in this consideration was the establishment of
the Regional Planning Committee and its effect on the work of the Maori
committee and also the effectiveness of the present ‘reporting
back’ process.
7. The majority of issues coming to the Maori committee are for
information and often centered on issues associated with the Heretaunga Plains
leaving Wairoa and Tamatea somewhat ‘sidelined’ in discussions.
8. Any decision of the Maori Committee should be one that is considered
to enhance the interaction between Council and tangata whenua throughout the
region.
Decision Making
Process
9. Council is
required to make a decision in accordance with Part 6 Sub-Part 1, of the Local
Government Act 2002 (the Act). Staff have assessed the requirements
contained within this section of the Act in relation to this item and have
concluded that, as this report is for information only and no decision is to be
made, the decision making provisions of the Local Government Act 2002 do not
apply.
|
Recommendation
That the Maori
Committee outlines the decisions/recommendations from the workshop held
before the meeting and makes appropriate recommendations to Council based on
those decisions/recommendations.
|
|
Viv Moule
Human
Resources Manager
|
Liz Lambert
Chief
Executive
|
Attachment/s
There are no
attachments for this report.
HAWKE’S BAY REGIONAL
COUNCIL
Maori
Committee
Tuesday 24 June 2014
SUBJECT: River Gravel Update
Reason for Report
1. This report is to update the Maori Committee on progress with the
Review of Riverbed Gravel Management. This is review being managed by the
Engineering Section as part of the Gravel Management Project (Project 369).
Background
2. Gravel extraction forms an integral part of ongoing flood protection
to both the Heretaunga and Ruataniwha Plains scheme areas, with gravel being
extracted such that the flood capacity of the schemes is maintained, and the
potential for the rivers to undermine edge protection is minimised.
3. The Hawke’s Bay river-borne gravel resource is increasingly
under pressure for construction use particularly in the proximity of the
Heretaunga Plains where the transport cost to the main centres is significantly
less than gravel sourced further away.
4. The majority of the easily accessible rivers are now effectively
managed through the process of targeted gravel extraction. However gravel
stocks are limited in many of the areas closest to the market and as a result
pressure is placed on gravel extractors to win their resource at greater
distances (eg Ruataniwha Plains rivers) from their markets putting pressure on
their competitiveness.
5. With the understandable reluctance to source gravel from further
afield due to the high transport costs there is a risk that gravel management
for flood control purposes in these areas will become an expense on scheme
ratepayers that may be unaffordable.
6. In addition there is increasing concern being expressed by the
public that river gravel extraction is aggravating coastal erosion,
particularly in Haumoana and Te Awanga. More research being undertaken to fully
understand and manage the potential effects.
7. The Asset Management section believes it is imperative for Council
to have an effective framework for the ongoing management of the gravel
resource within the region, supported by robust science and processes. This was
the subject of a paper to Council on 09 November 2010 where a scoping report
was presented that outlined the issues and proposed a way forward.
8. The scoping report identified the issues associated with the current
management of the region’s river bed gravel resource that when completed
would:
8.1. Improve Council’s understanding of riverbed gravel transport
and the impact of gravel extraction on flood protection works and coastal
processes.
8.2. Enable Council to review its management regime for assessing the
gravel resource and for managing its extraction.
8.3. Examine the future demand for the resource working with the
extraction industry.
8.4. Inform co-management discussions with regard to the gravel resource
and its management with Treaty Claimant Groups.
9. The scoping report adopted by Council included a prioritised
programme of work that could be accommodated in a 6 year time span. This
2013/2014 financial year is the third year of the programme. Completion is
programmed for 2016/2017.
10. In order
to carry out the review and obtain a wide view of community concerns and ideas
on the gravel resource a number of meetings have been arranged, (and are
ongoing) to discuss the issues. A separate meeting was held with the key people
in the gravel supply industry to hear their views as they have a different
perspective on the resource than other interested parties. These meetings with
the industry are continuing as they are a vital part of gravel
management.
11. A meeting
has been held with DOC, Fish & Game and the TLA’s. A hui was widely
advertised and held at Kohupatiki Marae to inform and discuss with hapu
associated with the rivers the issues relating to gravel management. In
addition a number of specialists working in the fields of coastal and river
gravel processes have been interviewed for their expert knowledge.
12. HBRC has
a number of responsibilities that have a direct bearing on the management of
gravel resources in the region:
12.1. It has
the jurisdiction to manage and authorise activities in riverbeds
12.2. It has
the jurisdiction to manage and authorise activities in the coastal area
12.3. It has
responsibility for flood control and protection of assets.
13. There is
an ongoing demand for gravel and aggregate for a range of activities in the
roading and construction industry. There is a need to balance the allocation of
gravel between supply demand and the need to maintain the flood capacity of
flood protection schemes. This balance should also take account of the
environmental effects of gravel extraction, Māori views and the river
ecology.
14. Extensive
flood protection schemes have been established throughout the Heretaunga Plains
and the Ruataniwha Plains, managed by HBRC. These schemes are currently
designed and constructed to a standard (1% Annual Exceedance Probability,
AEP). This standard is maintained through maintenance of the channel
carrying capacity and design riverbed levels.
15. The main
population areas and therefore gravel demand are on the Heretaunga Plains.
However the gravel resources are spread between the Northern area, Heretaunga
Plains and Ruataniwha Plains. As noted above there is a tension between the
gravel supply and the gravel demand areas due to the extra transport costs.
This has implications for HBRC’s management of the flood protection
schemes as too high a cost to extract the gravel may result in gravel
extractors preferring to establish land based sources. HBRC currently has
little ability to manage these land based areas, although land based mining is
covered in the Hastings District Plan.
16. There is
uncertainty over the potential effects of riverbed gravel extraction,
specifically in relation to the following aspects:
16.1. Long-term
riverbed morphology
16.2. Long-term
riverbed gravel supply from the high country
16.3. Sediment
supply to the coast and the effect on coastal stability
16.4. Riverbed
ecology and biodiversity
16.5. Sites
and issues of significance to tangata whenua.
17. The
review includes work to investigate and/or quantify these effects and determine
what further work, if any is needed to provide HBRC with robust information
necessary to manage the gravel resource as well as confirming or otherwise
whether the current management regime and processes are appropriate for long
term sustainability. The information will improve the understanding of gravel
transport and therefore also enhance the understanding for other interested parties.
18. The
review is divided into 13 separate but related issues that require
investigation. The order presented in the table below begins with the highest
priority first and some of the later issues are dependent on the outcome and/or
data from the earlier studies. Rough order costs to carry out the work have
been assigned to each issue. In addition there are annual costs associated with
Tangata Whenua involvement and a steering group.
|
|
Issue
|
Total Indicative cost
|
Stage
|
Current
Status
|
|
1
|
Hydrological Review
|
$40,000
|
Stage 1
|
Complete
|
|
2
|
Gravel Supply & Transport
|
$110,000
|
In Progress
|
|
3
|
Gravel Resource Inventory
|
$60,000
|
|
|
4
|
Implications for Flood Protection
|
$40,000
|
|
|
5
|
Gravel Demand & Forecast
|
$30,000
|
|
|
6
|
Gravel Monitoring & Resource Availability
|
$40,000
|
|
|
7
|
In-stream Ecological Effects
|
$75,000
|
Stage 2
|
In Progress
|
|
8
|
Riverbed Birds & Flora
|
$45,000
|
In Progress
|
|
9
|
Tangata Whenua Values
|
$20,000
|
Ongoing
|
|
10
|
Effectiveness of Beach-raking
|
$40,000
|
Stage 2
|
Complete
|
|
11
|
RMA Issues
|
$30,000
|
Stage 3 (RMA issues sooner)
|
|
|
12
|
Allocation & Financial Mechanisms
|
$30,000
|
|
|
13
|
Riverbed Gravel Management Plan
|
$75,000
|
Final Stage
|
|
|
|
Total
|
$635,000
|
|
|
|
|
Tangata Whenua consultation
|
$10,000/year
|
|
Ongoing
|
|
|
Steering Group
|
$10,000/year
|
|
Ongoing
|
19. The terms
of reference for the review were to consider the costs spread over a number of
years at about $100,000 per year. This of course is subject to a suitable
source of funding and could be expanded or reduced to suit. At present 6 years
is the time period considered. A work programme has been prepared to enable
each of these issues to be studied and reported on in a final report by 2017.
20. Possible
options for funding the work were discussed with gravel extractors and Council.
The option chosen to fund the work is from increased Resource Management
charges currently levied on a per cubic metre rate on all river bed gravel
extracted. With the previous level of extraction averaging approximately
600,000 cubic metres per annum this required an increase of the levy charged from
$0.60/m3 to approximately $0.80/m3.
21. In the
past year gravel extraction from the region’s rivers has reduced
significantly as the market demand has dropped off. There are two consequences
of this if the trend continues;
21.1. The
lesser consequence is that funding to continue the research will need to be
topped up from another source or the programme will need to be extended. This
latter action is least preferred owing to the urgent nature of some of the
issues.
21.2. The
more serious consequence with reduced demand is that gravel build-up in the
rivers will be a problem for the flood protection system. Already some river
reaches in the Ruataniwha Plains (e.g. Makaretu River) have excessive gravel
deposits causing problems.
22. Staff
will give a short presentation to Councillors outlining the research done to
date, highlighting some of the more pertinent findings and provide some comment
on future work.
Decision Making
Process
23. This
paper is to update Council on a programme of work that has already been
approved and as such no decisions are required to be made. Likewise there
are no recommendations to consider.
|
Recommendation
1. That the Maori Committee receives the
report “Gravel Resource Review: Update”.
|
|
Mike Adye
Group
Manager Asset Management
|
|
Attachment/s
There are no
attachments for this report.
HAWKE’S BAY REGIONAL
COUNCIL
Maori
Committee
Tuesday 24 June 2014
SUBJECT: Science Reports - June 2014 Update
Reason for Report
1. Hawke’s Bay Regional Council (HBRC) has a responsibility under
the RMA, the New Zealand Coastal Policy Statement and the Regional Coastal
Environment Plan to safeguard the integrity, functioning and resilience of the
coastal environment and to sustain its ecosystems.
2. These reports and the associated summaries will update Council
regarding the outcomes of an ongoing targeted investigation into the extent of
saltwater influence in the region’s estuaries. The report also
outlines the conclusions of a review of relevant data into the state of the
Ahuriri Estuary for contact recreation and shellfish gathering purposes.
The
Tukituki, Waitangi and Ahuriri: Assessment of the extent of saltwater influence
in Hawke’s Bay estuaries. RM 14/01 – Plan No: 4577.
3. This report describes the mapping of the extent of saltwater
influence in the Tukituki, Waitangi and Ahuriri estuaries.
Electrical
conductivity was used as a proxy for salinity. Following preliminary surveys of
conductivity gradients in each of the estuaries using field meters, Odyssey
conductivity loggers collecting continuous data were deployed. These
deployments coincided with periods of low flows and spring tides, which were
expected to be the periods of the maximum extent of saltwater influence.
The data collected by
the loggers was then interpolated using ArcGIS to generate maps of the salinity
gradient through the estuaries.
The data collected by
the Odyssey loggers was correlated against median flow and tide height. At most
of the sites tide height was strongly correlated with salinity (the higher the
tide the higher the salinity). River flow often had a relationship (the higher
the flow the lower the salinity) with salinity, especially at those sites
furthest from the mouth of the estuary.
4. The maximum extent of saltwater influence from the sea was:
· 1
km into the Tukituki estuary;
· 4.1
km into the Clive River arm of the Waitangi estuary;
· 5.1 km into the
Ngarururo River arm of the Waitangi Estuary;
· 2.9 km into the
Tutaekuri River arm of the Waitangi Estuary;
· 9.2 km into the
Ahuriri Estuary.
5. Since the
writing of this report, the extent of saltwater influence into the Porongahau,
Mohaka and Nuhaka estuaries has been established. The Odyssey loggers are
currently deployed in the Waikari estuary. These estuaries will be the subject
of a future report.
Ahuriri Estuary: Contact Recreation and Food Gathering Review.
EMT13/10 – Plan Number 4483.
6. The Ahuriri Estuary, Napier is a significant ecological and
recreational resource for the Hawke’s Bay community. It is
recognised as a nationally significant wildlife and fisheries habitat, and a
nationally important example of tectonic processes. Natural and
human-induced changes to the estuary over the last century have considerably
changed the estuary form.
7. As one of the few sheltered tidal lagoon estuaries within
Hawke’s Bay, Pandora Pond provides for a number of recreational
opportunities including swimming, kayaking, sailing, and waka ama. These
activities can however be compromised by the presence of faecal contaminants
that have the potential to cause illness. Faecal indicator organisms
sampled within the Ahuriri Estuary may stem from stormwater, overland flow or
accidental sewage discharges.
8. The estuary is currently classified as being in ‘Fair’
condition (grades range from Very Good to Very Poor) in terms of contact
recreation, due to the influence of inflows with elevated bacterial
concentrations – these may increase the risk of illness to recreational
users of the estuary. Other metrics, such as clarity and algal growth do
not indicate impairment of recreational opportunities as a consequence of
nuisance algal growths.
9. The Ahuriri Estuary also provides food gathering opportunities, most
commonly cockle and various species of flounder. Current information
suggests that shellfish gathered from the estuary may be unsuitable for human
consumption because of elevated faecal indicator bacteria concentrations.
10. If the
community regards the water and sediment quality within the estuary as impaired
for contact recreation and food-gathering purposes, techniques such as faecal
source tracking may assist in identifying the sources of faecal contamination
in targeting appropriate management strategies
Decision Making
Process
11. Council
is required to make a decision in accordance with Part 6 Sub-Part 1, of the
Local Government Act 2002 (the Act). Staff have assessed the requirements
contained within this section of the Act in relation to this item and have
concluded that, as this report is for information only and no decision is to be
made, the decision making provisions of the Local Government Act 2002 do not
apply.
|
Recommendation
1. That the Maori Committee receives the reports
“The Tukituki, Waitangi and Ahuriri: Assessment of the Extent of
Saltwater Influence in Hawke’s Bay Estuaries” and “Ahuriri Estuary: Contact Recreation and Food Gathering”
Report.
|
|
Oliver Wade
Environmental
Scientist WQ&E
|
Anna Madarasz-Smith
Senior
Scientist, Water Quality & Ecology
|
|
Stephen Swabey
Manager,
Science
|
Iain Maxwell
Group
Manager Resource Management
|
Attachment/s
|
1
|
Ahuriri
Estuary Contact Recreation and Food Gathering Report
|
|
|
|
2
|
The Tukituki,
Waitangi and Ahuriri Assessment of the Extent of Saltwater Influence in
Hawke's Bay Estuaries
|
|
|
|
Ahuriri
Estuary Contact Recreation and Food Gathering Report
|
Attachment 1
|
Ahuriri Estuary:
Contact
Recreation and Food Gathering Review
July 2013
HBRC Report No. EMT 13/10 – 4483
Environmental Science - Water
Quality and Ecology
Ahuriri Estuary:
Contact
Recreation and Food Gathering Review
July 2013
HBRC Report No. EMT 13/10 – 4483
 …………………………………………………………………….
|
Ahuriri
Estuary Contact Recreation and Food Gathering Report
|
Attachment 1
|
Contents
Executive summary............................................................................................................ 5
1 Introduction............................................................................................................. 6
2 Methods for assessing contact
recreation and food gathering risk.............................. 8
2.1 Contact recreation........................................................................................... 9
2.2 Food gathering.............................................................................................. 10
3 Contact recreation.................................................................................................. 11
3.1 Background................................................................................................... 11
3.2 Threats.......................................................................................................... 11
3.3 Current state................................................................................................. 12
3.4 State of the Ahuriri Estuary for
contact recreation............................................ 18
4 Food gathering....................................................................................................... 19
4.1 Background................................................................................................... 19
4.2 Threats.......................................................................................................... 19
4.3 Current state................................................................................................. 21
4.4 State of the Ahuriri Estuary for
food gathering.................................................. 23
5 Conclusions and recommendations......................................................................... 24
6 Acknowledgements................................................................................................ 25
7 Glossary of abbreviations and terms........................................................................ 25
8 References.............................................................................................................. 26
Appendix A Assessing microbiological water
quality for contact recreation.................... 28
Tables
Table 2‑1: Current water quality guidelines
associated with contact recreation. 9
Table 3‑1: Current guideline values associated
with water and shellfish quality. 10
Figures
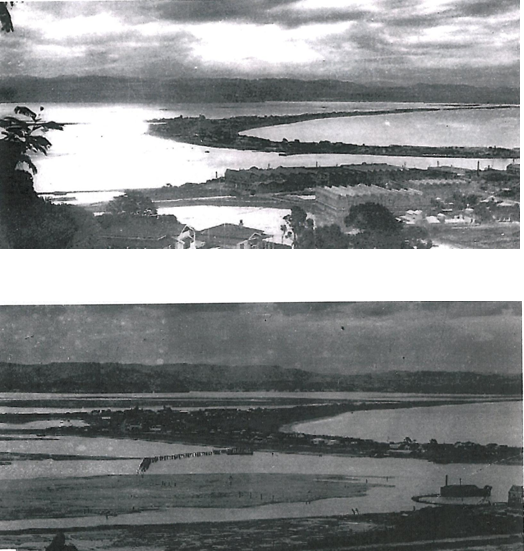
Figure 1‑1: Ahuriri Lagoon pre-1931 earthquake. 6
Figure 1‑2: Ahuriri Lagoon post-1931 earthquake. 6
Figure 1‑3: Drainage channels constructed to the
north and south of the main estuary outfall channel to develop agricultural
land. 7
Figure 2‑1: Levels of bacterial indicator
Enterococci at Pandora Pond, Ahuriri during the 2012/2013 recreational season. 12
Figure 2‑2: Turbidity measured in inflows to the
Ahuriri Estuary and within the Ahuriri Estuary. 14
Figure 2‑3: Turbidity levels at Pandora Pond,
Ahuriri Estuary between 1999 and 2013. n=20 per annum 14
Figure 2‑4: Sediment chlorophyll a
concentrations in the Ahuriri Estuary between 1998 and 2000. 16
Figure 2‑5: Chlorophyll a levels of water
samples taken within the Ahuriri Estuary between March and April 2013 (Ahuriri
1-6), and 2006-2013 (Ahuriri at Pandora). 17
Figure 3‑1: Dead fish being cleared from the
Ahuriri Estuary post- 1931 earthquake. 19
|
Ahuriri
Estuary Contact Recreation and Food Gathering Report
|
Attachment 1
|
Executive summary
The Ahuriri Estuary,
Napier is a significant ecological and recreational resource for the
Hawke’s Bay community. It is recognised as a nationally significant
wildlife and fisheries habitat, and a nationally important example of tectonic
processes. Natural and human-induced changes to the estuary over the last
century have considerably changed the estuary form.
As one of the few
sheltered, tidal lagoon estuaries within Hawke’s Bay, Pandora Pond
provides for a number of recreational opportunities including swimming,
kayaking, sailing, and waka ama. These activities can however be
compromised by the presence of faecal contaminants that have the potential to
cause illness. Faecal indicator organisms sampled within the Ahuriri
Estuary may stem from stormwater, overland flow or accidental sewage discharges.
The estuary is
currently classified as being in ‘fair’ condition in terms of
contact recreation, because it is influenced by inflows with elevated bacterial
concentrations – these may increase the risk of illness to recreational
users of the estuary. Other metrics, such as clarity and algal growth do
not indicate impairment of recreational opportunities as a consequence of
nuisance algal growths.
The Ahuriri Estuary
also provides food gathering opportunities, most commonly for the cockle (Austrovenus
stutchburyi) and various species of flounder. Current information
suggests that shellfish gathered from the estuary may be unsuitable for human
consumption because of elevated faecal indicator bacteria concentrations.
While there is some debate regarding the confidence in current guidelines for
bacterial concentrations in foods harvested recreationally for human
consumption, the inflow of stormwater derived from urban drains and proximity
of shellfish beds to these inflows indicate that the estuary should not be
regarded as safe food-source.
If the community
regards the water and sediment quality within the estuary as impaired for
contact recreation and food-gathering purposes, techniques such faecal source
tracking may assist in identifying the sources of faecal contamination in
targeting appropriate management strategies.
Toxic metal
contamination of shellfish and fish species is currently not at levels expected
to pose immediate health risks. Although it was not within the scope of
this study to assess the indirect effects of contaminants on the abundance and
distribution of edible resources, this was identified as an area for further
investigation.
|
Ahuriri
Estuary Contact Recreation and Food Gathering Report
|
Attachment 1
|
1 Introduction
As they form the
interface between land and sea, estuarine habitats are unique, distinctive and
dynamic environments. They experience rapid chemical and physical changes
over tidal cycles, yet provide some of the most important and diverse habitats
supporting bird roosting, feeding and breeding, fish spawning and nursery
grounds, and ecological services that help to sustain environmental quality and
integrity. They are productive habitats, and play an important role in
water regulation and nutrient cycling.
 In a region dominated by alluvial flood plain river
mouths, the Ahuriri Estuary (Te Whanganui-a-Orotu) represents one of the few
tidal lagoon estuaries in Hawke’s Bay. Formed in the wake of the
1931 earthquake, the Ahuriri Estuary is the remnants of the former Ahuriri
Lagoon (Figure 1-1). The earthquake resulted in an uplift of between 1 -
2 metres, exposing approximately 1300 ha (Figure 1-2) (Chague-Goff et al.,
2000). Drainage and reclamation following the earthquake has reduced the
area to its current size of approximately 470 ha of true estuary, and around
175 ha of associated wetlands (Figure 1-3; (Comerty, 1996).
In a region dominated by alluvial flood plain river
mouths, the Ahuriri Estuary (Te Whanganui-a-Orotu) represents one of the few
tidal lagoon estuaries in Hawke’s Bay. Formed in the wake of the
1931 earthquake, the Ahuriri Estuary is the remnants of the former Ahuriri
Lagoon (Figure 1-1). The earthquake resulted in an uplift of between 1 -
2 metres, exposing approximately 1300 ha (Figure 1-2) (Chague-Goff et al.,
2000). Drainage and reclamation following the earthquake has reduced the
area to its current size of approximately 470 ha of true estuary, and around
175 ha of associated wetlands (Figure 1-3; (Comerty, 1996).
Figure 1-1: Ahuriri
Lagoon pre-1931 earthquake.
Source: Hawke's Bay
Museum.
Figure 1-2: Ahuriri
Lagoon post-1931 earthquake.
Source: Hawke's Bay Museum.
Despite extensive
modification, reclamation, drainage and discharges, the estuary is recognised as an area of regional and national significance,
with high wildlife and fisheries values. The estuary provides
important feeding area for 20 species of trans-equatorial migrants (waders and
terns), six Australian species (herons, ibises and duck), and a number of
native species including white heron and royal spoonbill (Knox, 1979).
Additionally, the estuary makes a significant contribution to Hawke’s Bay
marine fisheries, supporting approximately 29 species of fish during some stage
of their life cycle. Some species (e.g. kahawai, grey mullet,
yellow-bellied flounder, stargazer and parore) use the area for feeding, and
around 11 species use the area as a nursery or spawning ground. These
include commercially important species such as yellow-bellied flounder, grey
mullet, sand flounder, common sole, and yellow-eyed mullet (Kilner and Akroyd,
1978).
|
|
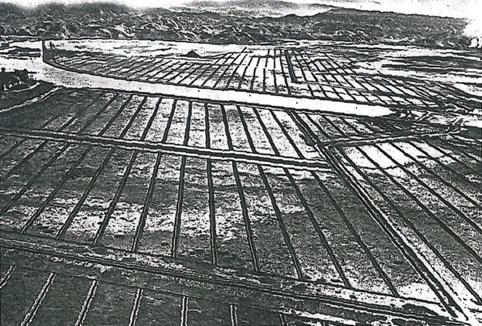 |
Figure 1-3: Drainage
channels constructed to the north and south of the main estuary outfall channel
to develop agricultural land.
Source: Hawke's Bay Museum.
Ahuriri Estuary is
listed as a Significant Conservation Area under the Regional Coastal
Environment Plan (HBRC, 2012), a Wetland of Ecological and Representative
Importance (WERI), and a Site of Special Wildlife Interest (SSWI) (Henriques,
1990). A Wildlife Refuge status protects the areas between the Southern
Marsh, Westshore Lagoon and the estuary, from the low level bridge to Pandora
Pond.
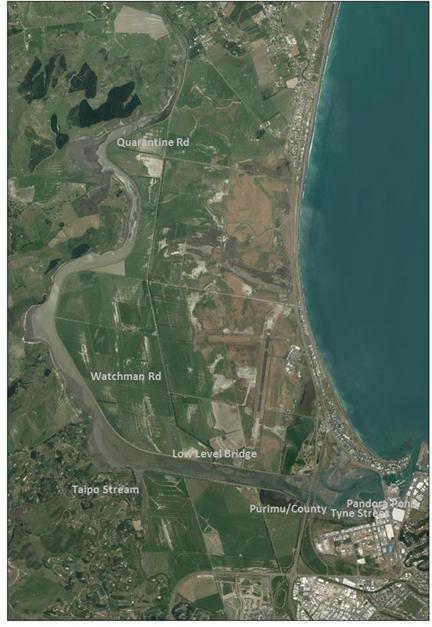
Figure 1‑4: Ahuriri
Estuary, Napier 2006.
|
Ahuriri
Estuary Contact Recreation and Food Gathering Report
|
Attachment 1
|
2 Methods
for assessing contact recreation and food gathering risk
2.1 Contact
recreation
“Contact
recreation” includes any activity that causes people come into contact
with water where a reasonable risk of inhaling or ingesting water exists.
At times, the suitability of water for recreation may be compromised by the
presence of human or animal faecal material resulting from land run-off,
discharges or from natural populations of animals or birds. During these
events, water may contain pathogens from this faecal matter. The risk of
contracting illnesses such as gastro-enteritis, respiratory illnesses,
Hepatitis A, giardiasis, cryptosporidiosis, campylobacterosis, and
salmonellosis increases as the risk of exposure to pathogenic organism
increases (MfE and MoH, 2003).
From an aesthetic
point of view, water clarity can be an important consideration for people
undertaking recreational activities. Although not as important in marine
waters which tend to be naturally more turbid, freshwater recreation choice can
be influenced by visual clarity.
Visual clarity
(determined by black disk visibility), is not generally measured in marine or
estuarine waters. Turbidity, a measure of the amount of light scattered
or absorbed by particles in the water, is more commonly used in New Zealand
coastal water quality monitoring programmes. An inverse relationship can
generally be demonstrated between turbidity and visual clarity.
Generally, if turbidity meets the requirements for aquatic ecosystems, it is likely
to meet the aesthetic value for contact recreation as well.
High algal biomass can
influence aesthetic values associated with contact recreation. High algal
biomass may reduce the visual clarity of the water by making it more turbid, or
by changing the colour of the water, creating ‘murky’ or
discoloured water. Human health risk associated with contact recreation may be
increased if toxic species are present. Increased nutrient inputs from
either land or marine sources can influence (increase) algal biomass growth
rates.
Current guidelines for
the attributes associated with contact recreation are detailed in Table 2-1.
Table 2-1: Current
water quality guidelines associated with contact recreation.
cfu = colony forming units, NTU = Nephelometric turbidity units, BD = black
disk.
|
Attribute
|
Guideline
value1
|
Source
|
Value
|
|
Satisfactory
|
Unsatisfactory/
Unacceptable
|
|
Enterococci (cfu/100 mL)
|
<280 cfu/100 mL
|
>280 cfu/100 mL
|
(MfE and MoH, 2003)
|
Human health
|
|
Turbidity (NTU)
|
0.5-10 NTU
|
>10 NTU
|
(ANZECC, 2000)
|
Aquatic ecosystems
|
|
Visual clarity (BD)
|
>1.6 m
|
<1.6 m
|
(MfE, 1994)
|
Aesthetic and safety
|
|
Chlorophyll a (g/m3)
|
<4 µg/L
|
>4 µg/L
|
(ANZECC, 2000)1
|
Aquatic ecosystems
|
|
Toxic algal species (cells/mL)
|
Absent
|
Present
|
‑
|
Human health and aquatic ecosystems
|
1These guidelines
refer to ANZECC 2000 for South-Eastern Australia which is used in the absence
of New Zealand specific estuarine guidance.
2.2 Food
gathering
With the exception of
overlying water quality, comparatively little information or guidance exists
around the risk associated with recreational harvesting of shellfish and
fish. Export food safety guidelines are applied in the absence of
recreational specific guidelines; however it is acknowledged that this appears
to be an area for further work or development.
For shellfish
gathering the attributes likely to compromise the ability to collect shellfish
include contamination by faecal material that may contain pathogens.
Additionally, the ability of shellfish and fish to accumulate contaminants such
as trace metals and other industrial and stormwater related toxins, means that
these parameters are also used to assess risks associated with food gathering.
Current guidelines for
the attributes associated with shellfish/fish gathering are detailed in Table 2-2.
Table
2-2: Current
guideline values associated with water and shellfish quality.
MPN =
Most Probable Number.
|
Attribute
|
Guideline
|
Source
|
Relevance
|
|
Satisfactory
|
Unsatisfactory/
Unacceptable
|
|
Faecal coliforms in overlying
waters
|
Seasonal median <
14 MPN/100mL
< 10%
of samples < 43MPN/100mL
|
Seasonal median > 14
MPN/100mL
> 10% of samples >
43MPN/100mL
|
(MfE and MoH, 2003)
|
Human Health
|
|
Toxic algal species in
overlying waters
|
Not present
|
Present
|
Nil
|
Human Health and Aquatic
Ecosystems
|
|
E. coli in
shellfish flesh
|
Median < 230
MPN/100g and
< 10%
of samples < 700 MPN/100g
|
Median > 230 MPN/100g and
> 10% of samples > 700
MPN/100g
|
(NZFSA, 1995)
|
Human Health
|
|
Trace metals
|
Below FSA guidelines
|
Above FSA guidelines
|
|
Human Health
|
|
Ahuriri
Estuary Contact Recreation and Food Gathering Report
|
Attachment 1
|
3 Contact
recreation
Like many
Hawke’s Bay rivers and lagoons, the Pandora Pond (or Humber Street Pond)
within the Ahuriri Estuary provides recreational opportunities, including
swimming, kayaking, sailing, and waka ama. This is perhaps one of the
highest profile uses of the estuary, along with birdwatching, and its
accessibility makes recreation a dominant use and value for the estuary.
The Pandora Pond was
created when sediment was excavated in 1977 to provide fill for the cargo
handling area in the Port of Napier (Lee, 1977). This created a pond that
provided Napier residents with an easily accessible, enclosed area for
recreational and boating activities suitable for families. On an exposed
coastline such as Hawke’s Bay, this area provides important opportunities
for aquatic recreation.
3.1 Background
Use of an area for
contact recreation can be driven by a number of external factors such as
climate, proximity from home and the physical characteristics of the
recreational site (Madarasz-Smith, 2010). Increasingly water quality is
becoming a prevalent deciding factor in people’s choice of recreational
areas. The key attributes that may affect water quality, and therefore
affect people’s recreational experience, include the risk of illness from
faecal contamination (bacteria and pathogens), water clarity, the extent of
algal coverage and the general amenity value or mauri of the area. This
report focusses on the first three key attributes - while recognising that
general amenity or mauri is important, it falls outside the scope of this report.
3.2 Threats
Faecal material can
enter water via stormwater, overland flow or accidental sewage
discharges. Within the Ahuriri estuary, faecal contamination has been
demonstrated to have resulted from all of the above at various times.
Farming within the upper catchment can contribute bacteria by overland flow
during periods of rain and stock watering, stormwater and land drainage
discharges occur regularly throughout the middle and lower estuary (Rycroft,
2000), and accidental sewerage discharges have occurred infrequently in the
past. While sewerage discharges are more likely to cause high
concentration of potentially pathogenic organisms and immediate health risks,
these tend to be short-lived and well communicated. The overall risk to
public health associated with sewer overflows may be therefore be lower than
the risks associated with less obvious but more frequent inputs such as diffuse
runoff from agricultural lands and stormwater.
Several studies have identified variable and at times poor water quality
within the Ahuriri Estuary. In general high numbers of bacteria were
found in upstream reaches of the estuary and in drains, most likely due to
lower levels of dilution by seawater (Hooper, 1989), or following periods of
heavy rain (Fenton, 1997). In the lower estuary, water entering the
estuary may contain high concentrations of faecal bacteria at times (e.g. Tyne
Street Drain (30-2000 FC/100 mL (Hooper, 1989) where FC = faecal coliforms).
|
Ahuriri
Estuary Contact Recreation and Food Gathering Report
|
Attachment 1
|
3.3 Current
state
3.3.1 Faecal
bacteria
National guidelines
identify concentrations at which the risk of illness associated with contact
recreation is no longer considered acceptable (MfE and MoH, 2003). This
allows the public to be informed of the health risks, and make informed
decisions regarding their exposure to these risks (see Appendix A for an
explanation of these guidelines).
The results of routine
sampling at the Pandora Pond, the most popular site within the estuary, has
provided good quality information regarding the risks associated with contact
recreation at this site. The pond is partially enclosed by a barrier arm,
creating a hydrodynamic environment that favours exchange of water on the
incoming tide (refreshed with saltwater), rather than the outgoing tide
(refreshed with freshwater) (Eyre, 2009). These characteristics suggest
that this area is likely to be protected from faecal contamination arising from
freshwater inflows outside of the pond.
Pandora Pond has been
monitored as part of Councils Recreational Water Quality Monitoring programme
since 1996. Since the 2008/09 season, the indicator has remained
enterococci, allowing trends over time to be established from this date.
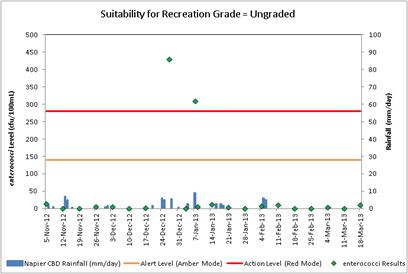
During 2012/13, the
pond was sampled for enterococci (as an indicator of faecal contamination),
electrical conductivity (as a proxy for salinity), turbidity and
temperature. During this period the site achieved 90% compliance with MfE
and MoH (2003) guidelines, indicating that for 18 out of the 20 weeks sampled,
the risk of illness associated with contact recreation at this site was
low. For two weeks however, elevated levels of bacteria (>280 cfu/100
mL) meant that the risk of illness was considered ‘unacceptable’
(Figure 3-1). Both of these occasions occurred after periods of
significant rain (11 mm 24th and 25th December and 9 mm 7th
January), indicating that surface runoff can impact water quality at this
site. Given the hydrodynamic regime described above, localised sources
should be investigated to determine their role in elevated bacterial
concentrations following rainfall events.
|
|
Figure 3-1: Levels
of bacterial indicator Enterococci at Pandora Pond, Ahuriri during the
2012/2013 recreational season.
Weekly monitoring
provides important information regarding the current state of water quality
within Pandora Pond. However, the timing of such information limits our
ability to assess the public health risk associated with contact recreation
because much of the information only becomes available after the period
of risk has occurred. This situation arises because the results of
analysis only become available 24-36 hours after the samples are collected
– during this period, the risk associated with contact recreation is
unknown and individuals may be exposed to elevated concentrations of pathogenic
organisms. To overcome this limitation, the 2003 guidelines incorporate
an approach that couples historical data with a catchment risk assessment to
generate a ‘Suitability for Recreation Grade’ (SFRG). The
SFRG is designed to provide a general indication of recreational water quality
of a water body at any time, rather than in response to the result from a
single sampling event.
A suitability for
recreation grade for Pandora Pond was generated at the completion of the
2012/13 season:
§ A
moderate catchment risk was obtained, indicating potential contamination
from sources such as stormwater, rural runoff, birds, land drainage and boat
mooring
§ A
microbiological assessment category of ‘C’ was obtained,
indicating that elevated bacteria concentrations can occur at times
§ Pandora
Pond achieved a ‘Fair’ SFRG.
This grading indicates
that the area is generally suitable for swimming, although caution should be
taken if there has been heavy rainfall, or if the water appears discoloured
(MFE and MOH, 2003).
3.3.2 Clarity/Turbidity
Turbidity within the
estuary has been assessed for a number of discrete projects over the last
decade. The most comprehensive data record exists for the period between
1995 and 1998. These data characterise the water quality of the Ahuriri
Estuary and the inflows to the estuary. These data were compared with the
results from a previous survey (Hooper (1989)) in Fenton (1997).
The turbidity in
waterways flowing in to the Ahuriri Estuary generally exceed guidelines for New
Zealand lowland streams (5.4 NTU (ANZECC, 2000); Figure 3-2, left). At
times, and within certain sub-catchments, turbidity can be extremely high;
however they appear to be somewhat buffered within the estuary with only a few
sites exceeding guidelines for marine and estuarine waters (Figure 3-2,
right). Typically higher turbidity values are observed in the upper
reaches of the estuary (Quarantine and Watchmen Rd), with elevated values at
sites in proximity to incoming waterways (e.g. Low level bridge, Tyne
Street). In general turbidity in the mid to lower estuary is within, or
close to, guideline values for aquatic ecosystems (10 NTU). These values
are unlikely to negatively impact on contact recreation except during periods
of heavy rainfall, when turbidity may transiently reach values of 130 NTU.
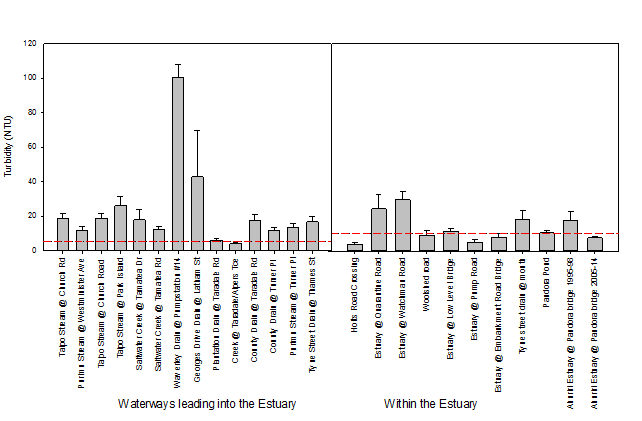
Figure 3-2: Turbidity
measured in inflows to the Ahuriri Estuary and within the Ahuriri Estuary n=4-37
Red line = ANZECC trigger levels for aquatic ecosystems for freshwater (left)
and estuaries (right).
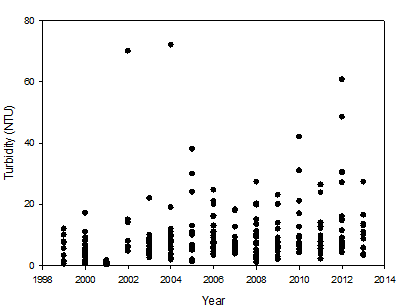
Figure 3-3: Turbidity
levels at Pandora Pond, Ahuriri Estuary between 1999 and 2013. n=20 per annum
The data described
above was collected mainly during the period 1995-98, with more recent data
restricted to the Pandora Bridge site. The Pandora Pond however has
consistently been monitored for turbidity since 1999 as part of the
Recreational Water Quality Monitoring programme. With the exception of
2004, no significant increase or decrease in turbidity has been observed
(Figure 3-3).
Therefore, the
turbidity at the Pandora Pond site does not appear to have significantly
changed since 1998.
3.3.3 Algae
Algae, both
macroscopic (large, found on the sediment surface), and microscopic (small,
plants found within the water column and on the sediment), are normal
constituents of a healthy estuarine ecosystem. In areas of high nutrient
loading however, algal numbers or cover can become excessive, causing nuisance
growths in terms of visual amenity, as well as negatively influencing sediment
quality and water chemistry.
Macroalgae
The largely
channelised nature of the Ahuriri Estuary minimises the likelihood of prolific
algal growths. In depositional areas (where flow is less rapid or
obvious), algal growth has generally been restricted to small patches of
ephemeral species (e.g. Ulva sp.) during the spring/summer period,
persisting at times through to autumn.
Given the nature of
the estuary and the moderate sediment nutrient concentrations, prolific algal
growth that would adversely affect contact recreation within the lower estuary
area (more commonly used for contact recreation) is unlikely.
Chlorophyll
a
A few previous studies
have detailed the nutrient status of the Ahuriri Estuary waters. These
identified that inflows to the estuary have delivered high concentrations of
both phosphorus and nitrogen into the main, ‘true’ estuary (Fenton,
1997, Hooper, 1989). Although the estuary has previously been described
as eutrophic (Hooper, 1989, Knox, 1979), the decrease in phosphorus
concentrations measured between 1989 and 1997 and currently indicate that the
trophic state of the waters may have decreased more recently. Conversely,
nitrogen concentrations (particularly ammoniacal nitrogen) appear to have
increased over the period 1989 – 2013 (Fenton, 1997, Hooper, 1989).
The current trophic status of estuarine waters, including the contributions of
nutrients from various inflows and land-uses should be investigated further.
That said, chlorophyll
a concentrations on estuarine sediments were assessed as part of a
specific water quality study in 1998 and 2000 (Figure 3-4). These data
can provide important information regarding the relative nutrient status
of inflows to the estuary. This work highlighted the role of inflows in
determining overall quality of estuarine water.
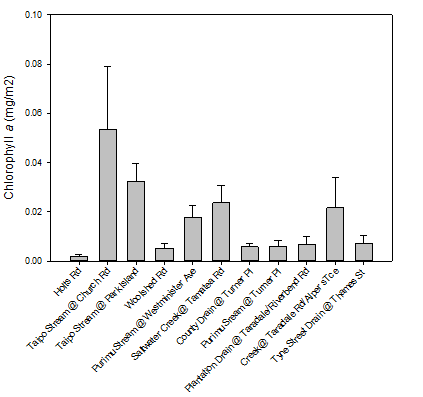
Figure 3-4: Sediment
chlorophyll a concentrations in the Ahuriri Estuary between 1998 and
2000.
More recently,
sampling in the Ahuriri Estuary has been undertaken as part of:
§ the
Nearshore Coastal Water Quality Monitoring Programme (at Pandora Bridge),
§ the
Estuarine Water Quality Monitoring programme to support policy development (at
six locations between Watchman Rd and Pandora Bridge) (waters),
§ the
Estuarine Ecological Monitoring Programme (sediments collected at multiple
locations across the estuary).
The waters of the
upper estuary appear to be fairly eutrophic, consistent with the findings of
previous reports. However by approximately the middle of the estuary,
chlorophyll a levels have dropped below trigger levels, indicating that
dilution and flushing from marine waters is moderating nutrient concentrations
and algal growth (Figure 3-5).
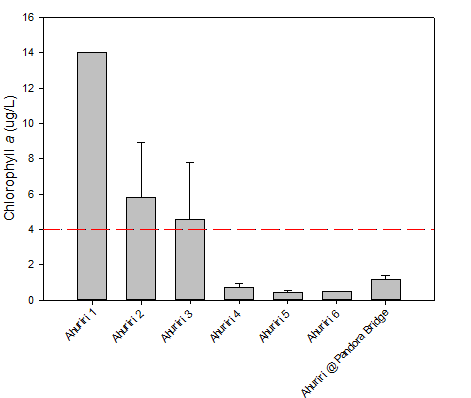
Figure 3-5: Chlorophyll
a levels of water samples taken within the Ahuriri Estuary between March
and April 2013 (Ahuriri 1-6), and 2006-2013 (Ahuriri at Pandora). Redline
= ANZECC trigger value for south-east Australian estuaries.
From a contact
recreation perspective, waters of the Ahuriri Estuary are unlikely to support
algal growth to an extent that would impair contact recreation. This
assessment excludes the periodic and transient blooms which can significantly
increases chlorophyll a concentrations and reduce visual clarity.
Such events are infrequently reported for the Ahuriri Estuary.
Harmful
algal blooms (HABs)
Harmful algae blooms
(and associated marine biotoxins) occur infrequently in Hawke Bay and estuarine
areas. These are defined as species that may release toxins (e.g. Gymnodinium
catenatum, Pseudonitzchia, Karenia, Dinophysis) which can be harmful if
ingested via water or contaminated shellfish, resulting in serious
illness. Additionally, species may be present in bloom numbers that do
not produce toxins, but cause irritation to the eyes or skin. These
blooms may also have environmental impacts, such as depletion of dissolved
oxygen concentrations in the water column.
Marine biotoxins were
routinely monitored by the Public Health Unit on behalf of the Food Safety
Authority until recently, when this function was transferred to the Ministry of
Primary Industry (MPI). During autumn 2005 and 2006, significant parts of
the Hawke’s Bay coastline were closed due to the presence of marine
biotoxins. In August 2012, a large and persistent bloom of Akashiwo
sanguine (red tide) was observed along most of the east coast of the North
Island, and in the following month a bloom of Pseudo-nitzschia spp.
(produces the neurotoxin domoic acid) was observed off Napier; this bloom also
included the red tide, Mesodinium rubrum. During these times,
contact recreation would have been discouraged along coastal beaches or
estuaries affected by these organisms.
3.4 State
of the Ahuriri Estuary for contact recreation
Based on information
derived from various monitoring programmes operated by Hawke’s Bay
Regional Council, the Ahuriri Estuary may be considered as “fair”
for contact recreational purposes (see appendix one). This grading
indicates that:
§ Ahuriri
Estuary waters are generally suitable for swimming.
§ Elevated
bacteria concentrations can occur at times.
§ Caution
is required during periods of heavy rain or when the water appears discoloured.
Faecal contamination
of the estuary is associated with stormwater inflows, runoff from rural land
uses and direct deposition of faeces by the high numbers of birds for which the
estuary is valued. Throughout the summer period when water quality
monitoring indicates an elevated risk of illness due to high numbers of faecal
bacteria, the Regional Council work in collaboration with the Public Health
Unit of the Hawke’s Bay District Health Board to inform the public of the
risk through signage and media releases.
Sewage discharges may
cause infrequent problems; these are not considered to be a persistent problem.
Should the community
express a desire for improved water quality, application of techniques such as
faecal source tracking would be useful in identifying the sources of faecal
indicator organisms, which in turn would allow management strategies to be
targeted on these sources.
Other water quality
metrics, such as visual clarity and algal growth do not generally impair
recreational values.
|
Ahuriri
Estuary Contact Recreation and Food Gathering Report
|
Attachment 1
|
4 Food
gathering
4.1 Background
The Ahuriri Estuary
has traditionally been an important food source for local hapu and
whanau. Maori occupation dates back as far as the 12th
century, and the estuary was used not only to provide food to the local area,
but also as a resource that aided in the development of trade and social
relationships with neighbouring hapu (Black and Ataria, 2008).
Prior to the 1931 earthquake
(which dramatically altered the physical nature of the estuary), the estuary
was used to collect fish (mullet, kahawai, flounder, herring), shellfish
(freshwater mussel, crayfish, mussel, horse mussel, pipi, mud snail,
periwinkle, cockles), and eels. However, in the aftermath of the
earthquake and due in part to drainage, reclamation, diversion and development,
the species distribution and abundance within the estuary was significantly
altered (Black and Ataria, 2008).
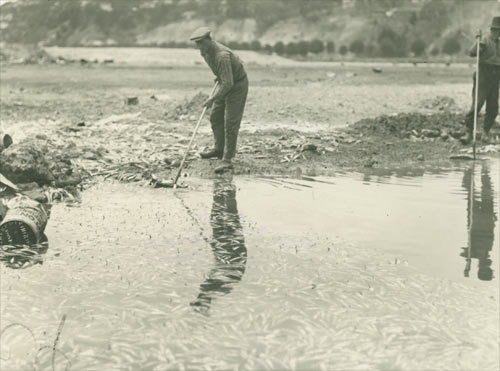
Figure 4-1: Dead
fish being cleared from the Ahuriri Estuary post- 1931 earthquake.
Source:
Hawke's Bay Museum.
More recently the
estuary has continued to provide valuable food resources for Napier
residents. The collection of cockles (Austrovenus stutchburyi) and
flounder is widespread within the estuary, with Yellowbelly founder (Rhombosolea
leporine), Sand flounder (Rhombosolea plebeian), Yellow-eyed mullet
(Aldrichetta forsteri), and Grey mullet (Mugil cephalus) all
common in the lower estuary (Ataria et al., 2008).
4.2 Threats
As filter feeders,
cockles filter large volumes of water, ingesting the small plants living in the
water for nutrition. They are therefore highly susceptible to the
contaminants present both in the water, and attached to any particulates they
ingest from the water column. They also have the potential to accumulate
contaminants associated with particulate material within their gut. In
turn, humans consuming whole cockles collected within these waters will ingest
any contaminants that have been retained within the cockle gut. Similarly,
flounder can ingest sediment particles during feeding, which makes them
vulnerable to accumulating contaminants from sediment. For this reason,
both cockles and flounder may be used to assess general environmental contamination.
Contaminants likely to
affect food gathered within the Ahuriri Estuary may enter the water and
sediments in the estuary through similar pathways to the contaminants likely to
impair contact recreation. Sources of faecal contaminants that can make
shellfish unsuitable for harvesting are described in section 3.2. The
quality of shellfish and fish harvested from the estuary may be compromised by
unacceptable concentrations of contaminants (including trace metals as
indicators of pollution) arising from stormwater discharges. Stormwater
derived from residential subdivisions may contain elevated concentrations of
copper from plumbing fittings, and zinc from roofing material, as well as
several other toxic metals associated with road runoff. Stormwater
derived from industrial areas have also been shown to contribute elevated
levels of toxic metals to waterways – these may accumulate in sediments
within the waterways, (Smith, 2011), as well as sediments within the estuary
itself (Smith, 2010).
Previous studies have
highlighted the impact that accidental discharges of chemicals from industry
may have on shellfish quality. Concentrations of chromium and lead within
the Tyne Street drain were deemed ‘unacceptable’, and at levels
‘well above’ New Zealand averages for estuaries (Hooper, 1989).
A spill of the timber treatment chemical Tanalith NCA in 1987 resulted in
concentrations of chromium in cockles that were 60% higher than in adjacent
area (Hooper, 1989). It is likely that episodes of acute industrial
discharge, as well as more pervasive discharges of trace amounts of these
metals, may contribute to elevated concentrations of toxic metals within
shellfish and fish.
When assessing the
changes associated with food gathering, it is necessary to consider:
1) The presence or
absence of contaminants in edible resources, as well as
2) How contaminant
profiles may indirectly affect the likelihood of encountering an edible
resource e.g.:
a. numbers may be
reduced by impairment of habitat type and quality, or
b. an increase or
reduction in prey species may decrease or increase the numbers of edible
species.
Assessment of these
factors is not within the scope of the current study, but this requirement has
been identified for further consideration.
|
Ahuriri
Estuary Contact Recreation and Food Gathering Report
|
Attachment 1
|
4.3 Current
state
4.3.1 Faecal
bacteria
The Microbiological
Water Quality Guidelines provide guidance regarding an the level of faecal
coliform contamination in waters during a shellfish gathering season (MfE and
MoH, 2003). These guidelines indicate that over a season:
§ median
faecal coliform concentrations should not exceed 14 MPN (Most Probable Number)
/100 mL, and/or
§ for
90% of samples, faecal coliform concentrations should not exceed 43 MPN/100
mL.
These guideline values
are based on the 1995 Ministry of Agriculture and Forestry ‘Shellfish
Quality Assurance Circular’ and the 1992 Department of Health
‘Provisional microbiological water quality guidelines for recreational
and shellfish-gathering waters in New Zealand’ for export standard
shellfish.
Recent concerns
regarding appropriateness of these guidelines was incorporated into a review
document produced for MfE (Bolton-Ritchie et al., 2013), this has resulted in
working groups being established to address a review of the guidelines by late
2013. More recently the Ministry of Health have stated that they do not
recommend collecting shellfish from areas affected by urban runoff (Paul
Prendergast (MoH) pers.comm.).
That said, HBRC
have collected information on shellfish gathering waters within Ahuriri Estuary
in line with MfE and MoH guidelines (2003) since 2006. The results are
detailed in Table 4-2 below:
Table 4‑1: Levels
of compliance with MfE and MoH guidelines for shellfish gathering waters, in
Ahuriri Estuary.
|
Year
|
Median
concentration (MPN /100mL)
|
Proportion
of samples
>43 MPN/100 mL
(%)
|
Compliant
with guideline values?
|
|
2006/07
|
9
|
20
|
No
|
|
2007/08
|
14
|
10
|
Yes
|
|
2008/09
|
10
|
5
|
Yes
|
|
2009/10
|
14
|
20
|
No
|
|
2010/11
|
39
|
40
|
No
|
|
2011/12
|
5
|
20
|
No
|
|
2012/13
|
3
|
0
|
Yes
|
The compliance of
waters in the Ahuriri Estuary with seasonal guidelines for water quality at
shellfish gathering sites is variable (Table 4-2). This variability
exemplifies one of the underlying concerns with the current guidelines. This is
that they produce highly variable results for the same shellfish gathering
waters, hindering the ability to provide consistent, reliable communication
regarding the level of risk with the public.
However,
§ the
historic levels of non-compliance and;
§ the
recommendation that shellfish should not be gathered from areas influenced by
urban runoff;
indicate that water
quality in the Ahuriri Estuary should not be considered generally appropriate
for shellfish gathering purposes.
This view is supported
by research completed in the Ahuriri Estuary in 2004, which showed that at
times E. coli concentration in shellfish flesh collected from the
estuary were higher than those considered acceptable for commercial harvest (ESR,
2004). Although guidelines do not currently exist for acceptable E. coli
concentrations in shellfish flesh collected for recreational purposes;
commercial limits may be applied, noting that these are likely to be more
conservative (provide a higher level of protection from infection).
A number of factors
support the need for further investigation of water quality pertaining to
recreational shellfish gathering in the Ahuriri Estuary:
§ The
Ahuriri Estuary is used extensively for recreational fishing and some cultural
harvest
§ Greater
certainty regarding the general suitability of water in the estuary for
shellfish gathering
§ Sources
of faecal contaminants that currently compromise microbiological water quality
need to be identified and targeted for remedial action.
4.3.2 Toxic
metals
Toxic metals are
delivered to the estuary (water and sediments) through numerous waterways that
discharge stormwater to the estuary (Ataria et al., 2008, Hooper, 1989, Smith,
2010, Smith, 2011). Concentrations of metals in the water column and
sediments may render shellfish and fish unsuitable for consumption.
Shellfish flesh
(cockles) was previously tested as part of a study into the effects of boat
maintenance and repair facilities on sediments in the Inner Harbour (Strong,
2005). This report showed that levels within shellfish flesh fell within
guidelines for human consumption, and so were unlikely to pose a risk for human
health. More recently, a review undertaken in association with Te
Taiwhenua a Te Whanganui-a-Orotu comprehensively assessed the concentrations of
industrial and stormwater contaminants in the sediments of the Ahuriri Estuary,
as well as within shellfish and fish flesh (Ataria et al., 2008). This
investigation showed that at the time of the study, the risk to human health
associated with consumption of cockles and yellowbelly flounder could be
considered negligible. For example, it would be necessary to consume 6 kg
of cockles or 11 kg of flounder per day to exceed the tolerable limit for zinc,
and 11 kg of cockles or 123 kg of flounder to exceed the tolerable daily intake
limit for copper.
Ataria et. al. (2008)
noted that for tangata whenua, the presence of contaminants in the water from
discharges, even at levels considered safe in relation to food safety
standards, was regarded as unacceptable.
|
Ahuriri
Estuary Contact Recreation and Food Gathering Report
|
Attachment 1
|
4.4 State
of the Ahuriri Estuary for food gathering
There is relatively
little information regarding the state of food resources within the Ahuriri
Estuary. While Hawke’s Bay Regional Council undertakes monitoring
of waters overlying popular shellfish gathering areas, comparing measured
concentrations with national guideline values, there is some concern regarding
the relevance and applicability of these guidelines for assessing the risks to
human health. Available information has been derived from single study
events of variable duration and robustness. The most comprehensive study
undertaken to date related the effects of stormwater contaminants on edible
shellfish resources.
In general, shellfish
gathered within the Ahuriri Estuary are likely to contain relatively elevated
faecal contaminant concentrations. Further work is required to assess
whether current contaminant concentrations do restrict this activity, and how
these relatively elevated concentrations may be reduced.
Although shellfish and
fish gathering is not compromised by levels of contamination that constitute
immediate health risks, the presence of stormwater contaminants is likely to
impose a barrier to food gathering by tangata whenua.
|
Ahuriri
Estuary Contact Recreation and Food Gathering Report
|
Attachment 1
|
5 Conclusions
and recommendations
This report describes
the current state of knowledge for the factors likely to influence contact
recreation and food gathering within the Ahuriri Estuary.
The estuary may be
considered fair for contact recreation, recognising that at times inputs of
faecal material may contribute to high concentrations of faecal bacteria at the
Pandora Pond site.
Should contact
recreation be considered as compromised by faecal contamination, and a desire
exist to improve water quality, techniques such as faecal source tracking would
assist in identifying source areas and in focusing management or remedial
measures.
Little information
exists regarding the impact of land-use on food resources within the
estuary. Existing information indicates that concentrations of toxic
metals in edible resources harvested in the estuary do not currently constitute
a risk to human health. The elevated concentrations of contaminants observed
in the inflows to the estuary indicate that there is a potential for adverse
impacts on edible resources – this is an issue that needs to be
considered in future.
Faecal contamination
of resources indicates that the estuary should not be considered
suitable as a safe source of shellfish for human consumption. Further
work is required at a national level to develop appropriate guidance on
assessing the risks of shellfish gathering to recreational fishers.
Regardless, the
Ahuriri Estuary does support a significant recreational fishery and further
work is required to quantify the public risk associated with consumption of
food harvested from the estuary. At this stage it is unclear where
responsibility for this assessment lies (Public Health Unit, Food Safety
Authority (MPI), or Regional Council). Continuing monitoring of toxic
metals, other chemical contaminants and faecal indicator bacteria within edible
resources (cockles and flounder) in the estuary is recommended to better assess
human and ecological health risks, inform public health and identify
appropriate catchment management actions that will achieve community objectives
for the area.
|
Ahuriri
Estuary Contact Recreation and Food Gathering Report
|
Attachment 1
|
6 Acknowledgements
The author wishes to
acknowledge the reviewers for comments made on the draft report and the
Hawke’s Bay Museum for images used within the report.
7 Glossary
of abbreviations and terms
|
cfu
|
Coliform Forming Units
|
|
E. coli
|
Esherichia coli
|
|
HAB
|
Harmful Algal Bloom
|
|
HBRC
|
Hawke’s Bay Regional Council
|
|
MfE
|
Ministry for the Environment
|
|
MoH
|
Ministry of Health
|
|
MPI
|
Ministry of Primary Industries
|
|
MPN
|
Most Probably Number
|
|
NTU
|
Nephelometric Turbidity Units
|
|
SFRG
|
Suitability for Recreation Grade
|
|
Ahuriri
Estuary Contact Recreation and Food Gathering Report
|
Attachment 1
|
8 References
ANZECC (2000)
Australian and New Zealand Guidelines for Fresh and Marine Water Quality 2000.
ANZECC and ARMCANZ (eds), Australian and New Zealand Environment and
Conservation Council, Australia.
Ataria, J., Tremblay,
C., Tremblay, L., Black, M., Kaukau, M., Kemp, R. and Mauger, J. (2008) He
Moemoea mo Te Whangaui-a-Orotu: A vision plan.
Black, M. and Ataria,
J. (2008) Napier Estuary Literature Review, p. 31, Landcare Research, Lincoln,
New Zealand.
Bolton-Ritchie, L.,
Greenfield, S., Madarasz-Smith, A., Milne, J., Stevenson, M. and Walker, J.
(2013) Recreational Water Quality: A practitioner's discussion on the
limitations of the 2003 national guidelines.
Chague-Goff, C.,
Nichol, S.L., Jenkinson, A.V. and Heijnis, H. (2000) Signatures of natural
catastrophic events and anthropogenic impact in an estuarine environment, New
Zealand. Marine Geology 167, 285-301.
Comerty, P.S., D.A.
(1996) A directory of wetlands., p. 395, Department of Conservation,
Wellington.
ESR (2004) Ahuriri
cockle results, p. 1, ESR, ESR.
Eyre, T.M. (2009) The
Sediment Dynamics of Ahuriri Estuary, Napier, New Zealand, University of
Waikato & Universitat Bremen, Hamilton, New Zeland.
Fenton, J.A. (1997)
Ahuriri Estuary Water Quality: Review of water quality in the estuary and
catchment area, p. 69, Blue Tear Environmental, Napier, New Zealabnd.
HBRC (2012) Hawke's
Bay Regional Coastal Environment Plan, HBRC.
Henriques, P.R.,
Binmore, H., Grant, N.E., Anderson, S.H., Duffy, C.A.J. (1990) Coastal Resource
Inventory First Order Survey: Hawke's Bay Conservancy, p. 78 + Department of
Conservation, Wellington.
Hooper, G. (1989)
Ahuriri Estuary Water Quality Study, p. 37 +, Hawke's Bay Regional Council.
Kilner, A.R. and
Akroyd, J.M. (1978) Fish and Invertebrate Macrofauna of the Ahuriri Estuary,
Napier, p. 79, Ministry of Agriculture and Fisheries, Wellington, New Zealand.
Knox, G.A. (1979) Ahuriri
Estuary: An Environmental Study, p. 84, University of Canterbury, Christchurch,
Canterbury.
Lee, J.W. (1977)
Hawke's Bay Harbour Board's Proposal to Dredge Humber Street Pond. Board,
H.s.B.C. (ed), p. 9, Wellington, New Zealand.
MfE (1994) Water Quality
Guidelines No. 2. Environment, M.f.t. (ed), Ministry for the Environment,
Wellington, New Zealand.
MfE and MoH (2003)
Microbiological Water Quality Guidelines for Marine and Freshwater Recreational
Areas, Ministry for the Environment, Wellington.
NZFSA (1995)
Microbiological Limits for Food. Authority, F.S. (ed).
Rycroft, C. (2000)
Napier Inner Harbour & Lower Ahuriri Estuary Point Source Discharges, p.
17, Hawke's Bay Regional Council, Napier, New Zealand.
Smith, S. (2010)
Monitoring of benthic effects of stormwater discharges at sites in the Ahuriri
Estuary: 2010 Survey, p. 52.
Smith, S. (2011) Fate,
transport and extent of sediment associated trace metal contaminants in Napier
urban waterways: Purimu Stream and County Drain, p. 39.
Strong, J. (2005) Antifoulant
and trace metal contamination of the sediments from the Napier Inner Harbour.,
p. 30, EAM Ltd, Napier.
Appendix
A Assessing microbiological water quality for
contact recreation
The
“Microbiological water quality guidelines for marine and freshwater
areas” (MfE and MoH, 2003) were developed to improve the communication of
risk to recreational water users. In a departure from earlier assessments
of recreational water quality, the 2003 guidelines required two related
activities to be undertaken in order to assess suitability for recreational
use:
§ risk grading, allowing a Sanitary Inspection Category
to be assigned to the water body and associated catchment, and
§ allocation of a Microbiological Assessment Category,
using routine monitoring data.
Combining these
indices allows an overall Suitability for Recreation Grade to be assigned,
which is the basis for informing the public regarding health risks associated
with recreation at a particular location.
Significant monitoring
is required to classify recreational water. A minimum of 20 data should be
acquired over the recreation season. Ideally the classification should be
based on data collected over a five year period. The classification makes
use of 95th percentile concentration values.
Weekly Monitoring
The MfE and MoH (2003)
guidelines also identify two tiers of surveillance activity. These
actions are based on maintaining the risks of infection below identified
thresholds. A “traffic light” coding system is used:
§ in surveillance mode (green), where
concentrations of indicator organisms in individual samples remain below
specific thresholds, routine monitoring continues.
§ where the surveillance concentration threshold is
exceeded by a single sample result:
− alert (amber) or
− action (red) monitoring modes
commence.
§ sampling frequency increases (to daily), the source of
pollution is investigated and warning signs may be erected.
The monitoring
thresholds for fresh and saline waters associated with these “traffic
light” are detailed in Table A-1.
Table A‑1: Status
levels and management actions associated with measured faecal indicators and
illness risk. Source
MfE&MoH, 2003
|
Colour code
|
Status
|
Marine waters
(enterococci
/100 mL)
|
Freshwaters
(E. coli
/100 mL)
|
Action
|
|
Green
|
Surveillance
|
All results <140
|
All results <260
|
Continue routine
weekly monitoring
|
|
Amber
|
Alert
|
Single sample result
>140
|
Single sample result
>260
|
Increase to daily
sampling, identify source of contamination
|
|
Red
|
Action
|
2 consecutive sample
results >280
|
Single sample
results >550
|
Increase to daily
sampling, identify source of contamination, erect signs, inform public
|
Suitability for Recreation
Grade (SFRG)
In
order to grade a recreational water body, two activities must occur:
§ the Microbiological
Assessment Category (MAC) must be established from existing or collected
microbiological data; definitions for the different categories are given in
Table 4-3
§ the Sanitary
Inspection Category (SIC) must be established (classifications are Very High,
High, Moderate, Low or Very Low; these refer to risk of contamination and are
determined for a specific water body by using the SIC flow chart provided in
the guidelines (MfE and MoH, 2003).
The
Suitability for Recreation Grade (SFRG) provides five grades (very poor to very
good) that summarise the potential health risk associated with primary
recreation (such as swimming or surfing) at a site. The process for generating
a SFRG is summarised schematically in Figure A-1.
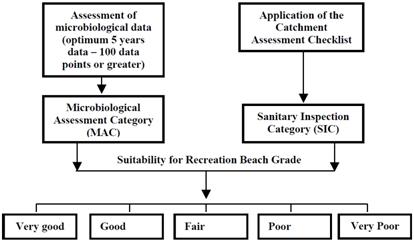
Figure A‑1: Suitability
for recreation grade schematic.
The grades can then be
used to communicate typical risk of contact recreation in a specific
water body to water uses as described in Table A-2.
Table A‑2: Explanation
of suitability for recreation grades.
|
SFRG
|
Description*
|
|
Very Good
|
The site has
generally excellent microbial water quality and very few potential sources of
faecal pollution. Water is considered suitable for swimming for almost all of
the time.
|
|
Good
|
The site is
considered suitable for swimming for most of the time. Swimming should be
avoided during or following heavy rain.
|
|
Fair
|
The site is
generally suitable for swimming, but because of the presence of significant
sources of faecal contamination, extra care should be taken to avoid swimming
during or following rainfall or if there are signs of pollution such as
discoloured water, odour, or debris in the water.
|
|
Poor
|
The site is
susceptible to faecal pollution and microbial water quality is not always
suitable for swimming. During dry weather conditions, ensure that the
swimming location is free of signs of pollution, such as discoloured water,
odour or debris in the water, and avoid swimming at all times during and for
up to three days following rainfall.
|
|
Very Poor
|
The site is very
susceptible to faecal pollution and microbial water quality may often be
unsuitable for swimming. It is generally recommended to avoid swimming at
these sites.
|
* from http://www.mfe.govt.nz/environmental-reporting/fresh-water/suitability-for-swimming-indicator/suitability-swimming-indicator.html).
|
The Tukituki, Waitangi and
Ahuriri Assessment of the Extent of Saltwater Influence in Hawke's Bay
Estuaries
|
Attachment 2
|
The
Tukituki, Waitangi and Ahuriri
Assessment
of extent of saltwater influence into Hawke's Bay estuaries
November 2013
HBRC Report No. RM 14/01 HBRC Plan
No. 4577
The Tukituki, Waitangi and
Ahuriri
Assessment
of extent of saltwater influence into Hawke's Bay estuaries
November 2013
HBRC Report No. RM 14/01 HBRC Plan No. 4577
Prepared
By:
Oliver Wade
Scientist –
Coastal Quality

Reviewed By:
Neale Hudson
Approved By:
Iain Maxwell

|
The
Tukituki, Waitangi and Ahuriri Assessment of the Extent of Saltwater
Influence in Hawke's Bay Estuaries
|
Attachment 2
|
Contents
Executive summary. 5
1 Introduction. 6
1.1 Project objectives. 7
1.2 Statutory context 7
2 Methodology. 7
2.1 Site selection. 7
2.2 Deployment 8
2.3 Data analysis. 9
3 Tukituki Estuary. 11
3.1 Results. 12
4 Waitangi Estuary. 17
4.1 Clive River 19
4.2 Ngarururo River 23
4.3 Tutaekuri River 26
5 Ahuriri Estuary. 28
5.1 Ahuriri Estuary Results. 29
6 Discussion. 34
7 Conclusion. 36
8 Acknowledgements. 36
9 References. 38
Appendix A Laboratory test results. 39
Tables
Table 2‑1: The Venice Classification System. 7
Table 3-1: Spearman correlation coefficients
for the Tukituki Estuary sites. 14
Table 4-1: Spearman Correlation Coefficients
for Clive River sites. 20
Table 4-2: Spearman Correlation Coefficients
for Ngarururo River sites. 23
Table 4-3: Spearman Correlation Coefficients
for Tutaekuri River sites. 26
Table 5-1: Spearman Correlation Coefficients
for Ahuriri Estuary sites. 32
Figures
Figure 2-1: Map showing the location of
estuaries within Hawke's Bay. 9
Figure 3-1: Tukituki estuary logger deployment
sites. 11
Figure 3-2: Maximum extent of saltwater
influence in the Tukituki Estuary. 12
Figure 3-3: Minimum extent of saltwater
influence in the Tukituki Estuary. 13
Figure 3-4: Scatter plot of median flow (X) and
median conductivity (Y) for the Tukituki Estuary. 15
Figure 3-5: Line plot of tide height
with associated median conductivity (Y1) and median flow (Y2) readings. 16
Figure 4-1: Waitangi estuary logger deployment
sites. 17
Figure 4-2: Maximum extent of saltwater
influence in the Waitangi Estuary. 18
Figure 4-3: Minimum extent of saltwater
influence in the Waitangi Estuary. 19
Figure 4-4: Scatter plot of median flow (X) and
median conductivity (Y) for the Clive River. 21
Figure 4-5: Line plot of tide height with
associated median conductivity (Y1) and median flow (Y2) readings. 22
Figure 4-6: Scatter plot of median flow (X) and
median conductivity (Y) for the Ngaruroro River. 24
Figure 4-7: Line plot of tide height with
associated median conductivity (Y1) and median flow (Y2) readings. 25
Figure 4‑8: Line plot of tide height with
associated median conductivity (Y1) and median flow (Y2) readings. 27
Figure 5-1: Ahuriri estuary logger deployment
sites. 29
Figure 5-2: Maximum extent of saltwater
influence in the Ahuriri Estuary. 30
Figure 5-3: Minimum extent of saltwater
influence in the Ahuriri Estuary. 31
Figure 5-4: Line plot of tide height with
associated median conductivity (Y1) and median rainfall (Y2) readings. 33
|
The
Tukituki, Waitangi and Ahuriri Assessment of the Extent of Saltwater
Influence in Hawke's Bay Estuaries
|
Attachment 2
|
Executive summary
This report documents
the mapping of the extent of saltwater influence in three Hawke’s Bay
estuaries, the Tukituki, the Waitangi and the Ahuriri.
The current report
provides a specific benchmark or reference point in time against which change
over time may be assessed. These changes may be driven either by Council
managed activities (such as those regulated through the resource consent
process), or natural events (e.g. climate change, change in shape and extent of
the estuary following an unusual hydrological event).
The extent of
saltwater influence was mapped using ArcGIS interpolating continuous
conductivity data collected using Odyssey CT loggers. The data collected
indicates that the individual estuaries have different saltwater regimes,
driven largely by their physical characteristics and the magnitude of
freshwater inflows. Correlations indicate that the dominant variable
influencing the extent of saltwater influence was flow in the Tukituki, flow and
tide height in the Waitangi estuary and tide height in the Ahuriri estuary.
The maximum extent of
saltwater influence in these estuaries was:
§ 1
km into the Tukituki Estuary;
§ 4.1
km into the Clive River arm of the Waitangi Estuary;
§ 5.1
km into the Ngarururo River arm of the Waitangi Estuary;
§ 2.9
km into the Tutaekuri River arm of the Waitangi Estuary;
§ 9.2
km into the Ahuriri Estuary;
|
The
Tukituki, Waitangi and Ahuriri Assessment of the Extent of Saltwater
Influence in Hawke's Bay Estuaries
|
Attachment 2
|
1 Introduction
Estuaries form a
transition zone (ecotone) between saline and fresh waters. Over tidal
cycles, saline water moves through estuaries and river mouth openings, the
larger the tidal coefficient (amplitude of the tide), the further the saltwater
pushes inland. Due to the density differences between saltwater and
freshwater, the saltwater often moves upstream in the form of a wedge, with the
denser saltwater pushing underneath
the fresh. Temperature differences between cooler seawater and river
water reinforce density differences during the summer period. As the freshwater
flow decreases, the wedge becomes longer and sharper, as flow increases, the
wedge becomes shorter and blunter until the freshwater pushes the saltwater
back toward the estuary mouth. In
addition to flow, the extent of saltwater influence in estuaries is affected by
four processes that determine the influence of physical characteristics of an
estuary on the tidal wave (Rijn 2010). These are:
§ amplification
(or shoaling) of the tidal wave as it is compressed as the width and
depth of the estuary decrease (convergence)
§ reduction
in the velocity of the tidal wave due to bottom friction
§ deformation
of the tidal wave leading to high tide occurring as a sharp transient event,
whereas low tide occurs as a long, smooth event
§ partial
reflection of the tidal wave by abrupt changes in the depth of the estuary or
at the landward end of the estuary (in the absence of a river).
Other meteorological factors
can also affect the extent of saltwater influence. Strong winds can push the
salt water in shallow estuaries. Strong onshore winds and large swells can
create a ‘storm surge’ effect where the sea level, and hence tide
level, is higher than it normally would be. Similarly, low barometric pressure
can cause an increase in water depth – tide heights are estimated for a
standard, 1013 hectopascals (hPa) pressure, and for every decrease in pressure
by of 1 hPa below the standard, tide height may be expected to increase by
about 1 cm[1].
Estuaries are highly
productive areas (P. Meire (2005)) driven by the constant supply of nutrients
provided by freshwater inputs. This productivity is not realised in an
especially large diversity of species but rather through large numbers of
individuals and a high biomass. These species include both freshwater and
marine species living at the maximum extent of their distribution areas, as
well as estuary-specific species. The distribution of species has been highly
correlated with salinity (J. Maes 1998). This high productivity results in a
high biomass of algae and phytoplankton, which in turn attract a large number
of invertebrates, fish and birds. Retaining the natural balance in these areas
is important to maintain the feeding and reproductive cycles of many species.
Additionally, the
extent of saltwater
penetration into rivers can have some important implications for jurisdictional
issues, claims under the Foreshore and Seabed Act (2004), and administration of
the Resource Management Act (1991).
The extent of saline
penetration in most New Zealand estuaries and rivers is largely unknown.
Within Hawke’s Bay, extensive work has been undertaken to describe these
zones, so that change driven either by Council managed activities (such as
those regulated through the resource consent process), or natural events (e.g.
climate change, change in shape and extent of the estuary following an unusual
hydrological event) may be detected. The current report provides a
specific benchmark or reference point in time against which change over time
may be assessed.
1.1 Project
objectives
This project will:
§ Describe
the spatial extent of Hawke’s Bay estuarine and riverine transition
areas;
§ Monitor
transition zones over time to provide an understanding of temporal change;
§ Provide
information regarding transitional zones to better target monitoring of
activities that may affect flora and fauna in these areas.
1.2 Statutory
context
Hawke’s Bay
Regional Council (HBRC) has a responsibility under the Resource Management Act
(1991) for the sustainable management of the coastal area. Sections 6 and
7 of the RMA outline the matters of national importance, and include the
‘preservation of natural character’ and ‘Maintenance and
enhancement of the quality of the environment’.
HBRC has demonstrated
commitment to increasing knowledge regarding the region's coastal resources by
funding investigation of estuarine processes (including saltwater influence)
over the life of the current long-term plan (Level of Service Statement, LTCCP
2009-2019).
2 Methodology
Odyssey conductivity
loggers (manufactured by Dataflow Systems Pty. Ltd.) were deployed in selected
estuaries in order to collect time series data that describe changes in
salinity at fixed points in the estuaries and to provide a spatial
characterisation of the saline transition zone. Water was classified as fresh,
brackish or salt as according to the Venice Classification System (Table 2‑1).
Table 2‑1: The
Venice Classification System.
|
Salinity
(ppt)
|
Conductivity
(mS/cm)
|
Classification
|
|
< 0.5
|
1.2
|
Fresh water
|
|
0.5 – 30
|
1.2 – 46
|
Brackish water
|
|
>30
|
>46
|
Salt water
|
2.1 Site
selection
Prior to logger
deployment, an initial survey of the estuary was conducted. Firstly, aerial or
satellite photos were inspected to see if there was an indication of where the
deeper channels may lie. Secondly, a physical reconnaissance of the estuary was
conducted at high tide, on a large tidal coefficient, by either kayak or boat.
Using a field conductivity meter, the extent of saltwater influence at the time
of survey was ascertained in order to guide placement of the loggers. A survey
of the types of shoreline vegetation gave further indications regarding the
extent of saltwater penetration.
Once the initial survey
was completed, conductivity loggers were deployed at the pre-determined sites
on the estuary. The location of the sites was determined by several factors:
§ Existence
of previous conductivity data.
§ Water
depth: the dense salt water moves up the channel that defines the deepest parts
of the estuary (thalweg); to ascertain the maximum extent of saltwater
influence, the loggers need to be deployed in the thalweg, where practicable.
§ Proximity
to areas of interest such as tributaries and potential Inanga spawning sites.
§ Distance
from the estuary mouth: placement of the loggers at even distances from the
estuary mouth allows for better interpolation of the data.
§ Location
of suitable attachment points. The
loggers were attached in a variety of ways: to manmade structures
(bridges/whitebait stands); to logs and root systems; anchored by concrete
blocks both freestanding and tethered to the bank. Loggers were attached
approximately 30 cm above the river bed in locations where they were
permanently covered by water.
2.2 Deployment
The loggers
were deployed under low
flow conditions with high tidal coefficients (spring tides) which are believed
to be the optimum conditions for determining the maximum extent of the
saltwater influence. The
loggers were deployed in the Tukituki Estuary once, and the larger Ahuriri and
Waitangi Estuaries twice. This was because of the size and complexity of the
latter two estuaries. Each deployment encompassed at least two periods of
spring tides that coincided with low flows. A tide was designated a spring tide
when the depth of water under high water conditions exceeded 1.7 meters.
While every
effort was made to map the maximum extent of the saltwater influence, the many
influencing variables involved means that it is possible the saline water could
intrude further into these estuaries than was observed during the periods of
study. Events such as large swells, strong onshore winds and low barometric pressure can create
‘storm surge’ conditions where tidal height dramatically exceeds
the forecast height, leading to an increase in the extent of saltwater
influence. The present study is considered to describe the typical
extent of saltwater influence.
Similarly,
it is not possible to map the ultimate minimum extent of saltwater influence,
because river conditions necessary (e.g. flood conditions with high velocity
flows) would probably lead to loss of loggers.
The extent of
saltwater influence recorded during this investigation has been mapped on an
estuary by estuary basis. The current report details work completed on the
Tukituki, Waitangi and Ahuriri Estuaries (see Figure 2-1).
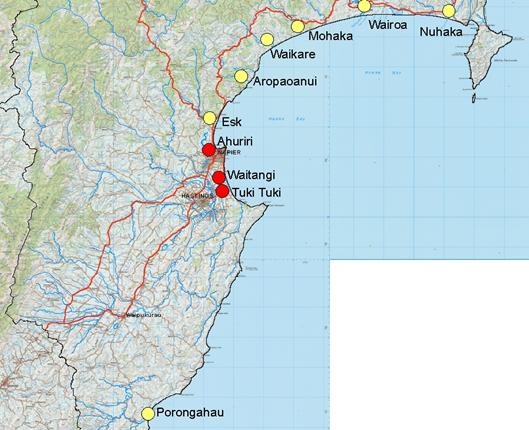
Figure 2-1: Map
showing the location of estuaries within Hawke's Bay.
The red
points denote the estuaries that have been included in this study to date, the
yellow points are estuaries that will be mapped during future surveys.
2.3 Data
analysis
The data retrieved
from the conductivity loggers was analysed using ArcGIS. Data were
interpolated to provide a conductivity gradient for each estuary at the time of
maximum and minimum saltwater influence.
Spearman correlations
were determined using Statistica V.11. These allow the influence of tidal
height and flow/rainfall on conductivity readings to be determined at sites
where saline or brackish water was recorded. The amount of data available for
the correlations was restricted by the tidal height information. The tide data
utilised[2]
gives only the time of the point of lowest and highest tide, whereas the
conductivity and flow data were collected at 15 minute intervals. Therefore the
median conductivity and flow values for a six hour period (three hours either
side of the tide time) were calculated and these values were used for the
correlations rather than the raw data.
Tidal influx is often
delayed in estuarine systems relative to the adjacent coastline. Typically the
delay for the tidal wave to reach a point in an estuary increases with distance
from the estuary mouth. This delay was accounted for at each logger site
by first examining the conductivity and tide height data graphically to
ascertain any lag between peak conductivity readings and time of high tide.
Where necessary, the high tide time was then adjusted to be synchronised with
peak conductivity readings. This temporal adjustment was confirmed using the
Spearman correlation - adjustment was accepted if the adjusted tide time
provided a higher correlation coefficient (r).
The correlation
coefficient (r) describes the relationship between conductivity and either flow
or tide height. The correlation coefficient can have a value of between 1 and
-1. A negative value means that as either flow or tidal height increase,
conductivity tends to decrease. A positive value means that as flow or tidal
height increases, conductivity tends to increase also. The closer the
correlation coefficient is to either 1 or -1, the stronger the relationship.
The p value describes whether this relationship is statistically significant.
The relationship is significant when p < 0.05.
3
Tukituki Estuary
The Tukituki River is
the fourth largest river in the region in terms of average flows. (Hume
2013), determined that residence times of waters within the estuary are short
and characterised the estuary as essentially an extension of the river that is
tidally influenced. The river bed within the estuary is predominantly gravel,
with a relatively steep gradient.
Conductivity
loggers were deployed at five sites (Figure
3-1) in the
Tukituki Estuary between 24/01/12 and 24/02/12. These loggers were attached to
concrete blocks placed on the river bed.
The initial
survey indicated that saltwater intruded as far as site 3 (1.8 m tide). The
logger at site 4 was placed in the thalweg where there was rapid flow and was
not expected to log any saline or brackish water. Bankside vegetation could not
be used as an indicator of the extent of saltwater influence because the area
is highly modified and characterized by introduced grasses, willows and
poplars. The saline and fresh water appeared to be highly stratified, with the
saltwater confined to the thalweg and minimal mixing with the upper freshwater
layer. Visual observations of the water clarity appeared to be the best
indicator of saline water, which was much more turbid than the freshwater.
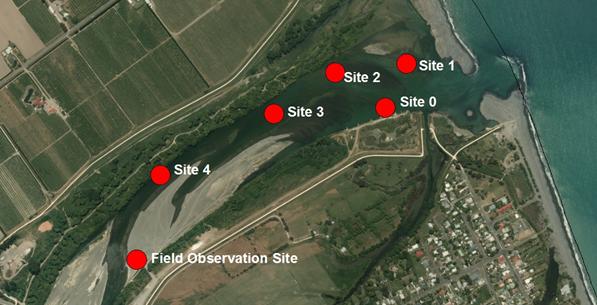
Figure
3-1:
Tukituki estuary logger deployment sites.
The hydrographic flow
site at Red Bridge, approximately 10 km
upstream of the estuary was used to estimate river flow (m3/sec)
data at the estuary. There is limited inflow between the Red Bridge site
and the river mouth.
The loggers
were deployed during a period of low flow (~ 12 m3/sec) that lasted
for two and a half weeks before the flow increased to over 50 m3/sec
on the 20/02/12. The loggers were retrieved three days later because of
concerns they would be buried by gravel or swept away. The logger at site 0 malfunctioned,
however field observations at this site indicated that it would be subject to
saltwater under all conditions. Sites 3 and 4 recorded brackish water at
certain periods, and sites 1 and 2 recorded saltwater the majority of the
time. Further observations were taken during periods of low flow (~ 5 m3/sec) at
the ‘Field Observation Site’ using a field meter. Conductivity readings
of 36 mS/cm (brackish – saltwater) were recorded here in 1.2 m water
depth. Of particular interest at this site was a localized phytoplankton bloom
of Cryptomenas sp. collected from the saline part of the water column
(see Appendix 1 for laboratory report).
3.1 Results
ArcGIS was used to
interpolate the data from the Odyssey loggers and generate graphical images of
the maximum (Figure 3-2) and minimum (Figure 3-3) extent of the saltwater
influence in the Tukituki Estuary. The maximum extent of saltwater influence
was approximately 1 km from the estuary mouth. At present the upper extent of
the saltwater influence is bounded by a steep riffle, approximately 100 metres
downstream from Black Bridge.
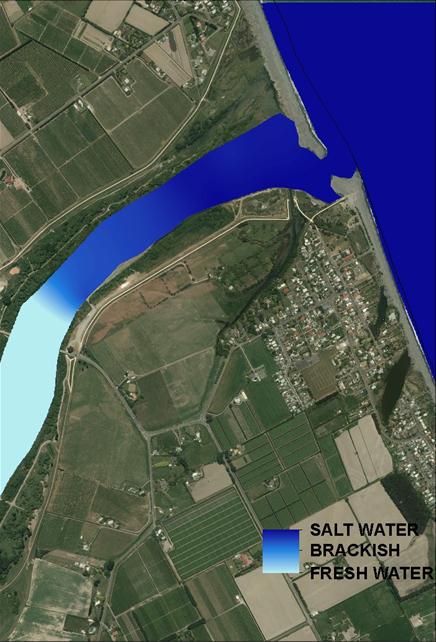
Figure
3-2:
Maximum extent of saltwater influence in the Tukituki
Estuary.
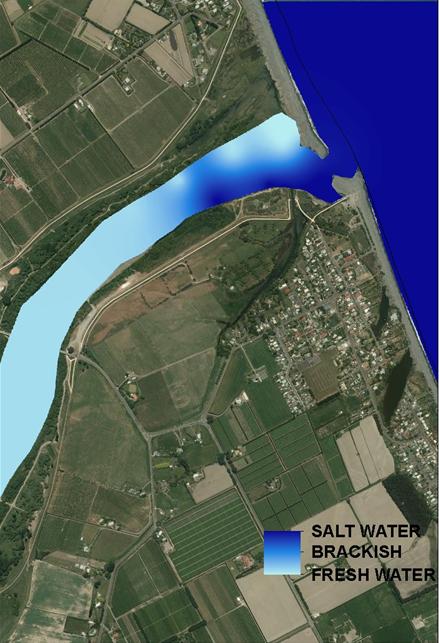
Figure
3-3:
Minimum extent of saltwater influence in the Tukituki
Estuary.
The median
conductivity was correlated with the median flow data and tidal height (Table 3-1).
The estuarine stretch of the Tukituki River is relatively short and straight
– accordingly, there is little tidal delay and it was only necessary to
adjust the data at Site 4 (Table 3-1).
Table 3-1: Spearman
correlation coefficients for the Tukituki Estuary sites.
Figures shown in bold are statistically significant (p<0.05).
|
|
Site
|
Period
of Deployment
|
Tidal
delay
|
Conductivity
vs. Flow
|
Conductivity
vs. Tide height
|
|
UPSTREAM
|
4
|
24/01/12 –
24/02/12
|
+ 2 hrs
|
-0.586
|
0.101
|
|

|
3
|
24/01/12 –
24/02/12
|
0 hrs
|
-0.676
|
0.105
|
|
2
|
24/01/12 –
24/02/12
|
0 hrs
|
-0.616
|
0.393
|
|
DOWNSTREAM
|
1
|
24/01/12 –
24/02/12
|
0 hrs
|
-0.478
|
0.469
|
Flow was significantly
negatively correlated with conductivity at all sites (Table 3-1). These
correlations are quite high for the natural environment and suggest a strong
relationship between an increase in flow and a decrease in conductivity. The
increase in flow required to reduce the influence of saltwater to all sites was
quite similar (between 35 and 45 m3/s) (see Figure 3-4). Tide
height had a strong positive correlation with conductivity at the lower sites
but no relationship at the upstream sites (Table 3-1). This suggests flow
limits conductivity at the upstream sites, while both flow and tide height have
a combined influence closer to the estuary mouth.
The increasing
influence of saltwater closer to the estuary mouth can be seen in Figure 3-5. At the upstream sites (3 & 4),
only brackish water was present on the largest tidal coefficients with
corresponding low flows. As might be expected, salinity was highest at the
sites closest to the mouth, and the point of highest salinity more frequently
coincided with the high tide.
|
Site 4
|
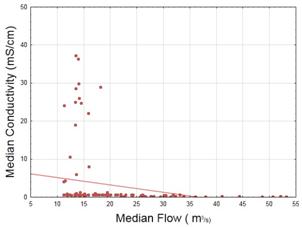
|
 Upstream Upstream
|
|
Site 3
|
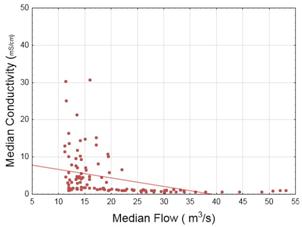
|
|
|
Site 2
|
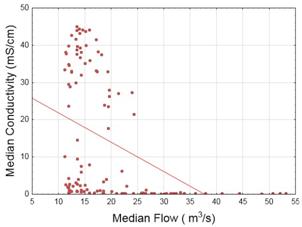
|
|
Site 1
|
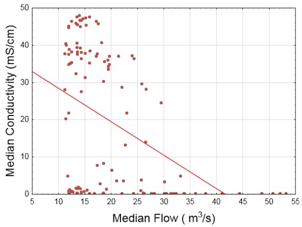
|
Downstream
|
Figure 3-4: Scatter
plot of median flow (X) and median conductivity (Y) for the Tukituki Estuary.
|
The
Tukituki, Waitangi and Ahuriri Assessment of the Extent of Saltwater
Influence in Hawke's Bay Estuaries
|
Attachment 2
|
|
Site 4
|
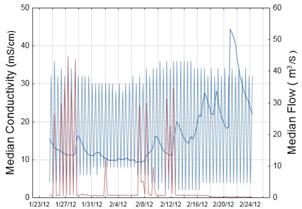
|
 Upstream Upstream
|
|
Site 3
|
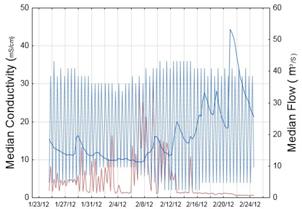
|
|
|
Site 2
|
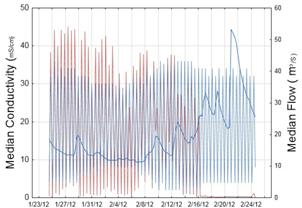
|
|
Site 1
|
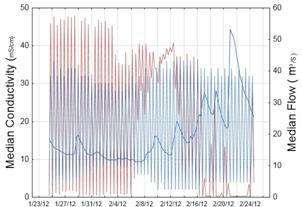
|
Downstream
|
|
 Tide Height Tide Height  Median Flow Median Flow  Median Conductivity Median Conductivity
|
Figure 3-5: Line
plot of tide height with associated median conductivity (Y1) and median flow
(Y2) readings.
|
The
Tukituki, Waitangi and Ahuriri Assessment of the Extent of Saltwater
Influence in Hawke's Bay Estuaries
|
Attachment 2
|
4 Waitangi
Estuary
The Waitangi Estuary
is the common mouth of the Tutaekuri River (north), Ngarururo River (centre)
and Clive River (south), and is the only multi-river estuary in Hawke’s
Bay. The rivers feeding into the Waitangi Estuary have been extensively
modified. Each river channel appears to have characteristics that effect
the extent of saltwater influence uniquely.
Conductivity loggers
were deployed within the Waitangi Estuary from the 18/12/12 to the 24/01/13 and
from the 27/02/13 till the 16/04/13 (Figure 4-1). The loggers were deployed
using a variety of methods, including attachment to concrete blocks, whitebait
stands, logs and the Brookfields Bridge. Despite efforts to conceal the
loggers, several were lost due to vandalism.
The initial survey of
the estuary found saltwater penetration 100 metres downstream of site 1T on the
Tutaekuri River, to site 2N on the Ngarururo River and to site 1C on the Clive
River. Similar to the Tukituki Estuary, the banks of the Waitangi are highly modified
with only replanted remnants of native vegetation, and the waters are similarly
stratified, making it difficult to visually determine the extent of saltwater
influence. Once again water clarity provided a better indication of the saline
content of the water. On retrieval of the loggers on the 16/04/13, a large
phytoplankton bloom was observed around logger site 3N. The bloom
was dominated by Cryptomonas sp, which can be fresh or saltwater species
(see Appendix 1 for laboratory report). This bloom was confined to the
saline part of the water and may therefore be a saline species.
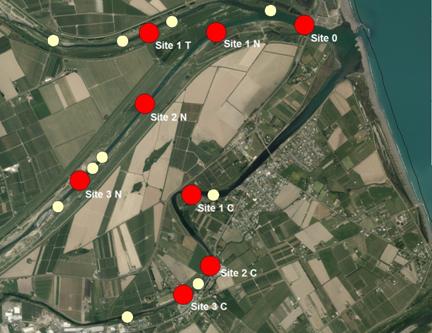
Figure 4-1: Waitangi
estuary logger deployment sites.
Red points
denote sites were logger data was correlated against flow and tide height;
white points denote sites of previous logger deployment
During the primary
period of deployment there was one rain event around the 26/12/13 that
increased flows in all the rivers. The second period of deployment was during
extreme low flow conditions. The purpose of the primary deployment was to
coarsely identify the extent of saline penetration into the estuary. The second
deployment focused on the areas of furthest extent of saline water found during
the primary deployment to increase the resolution at this level.
The different physical
attributes of these rivers (e.g., depth of thalweg, meanders, flow etc.) mean
that the saltwater influence into each is different. The estuary was treated as
a single system for the GIS interpolation but correlations were conducted
separately for each river.
The maximum extent of
saltwater influence in the Waitangi Estuary was approximately 5.2 km in the
Ngarururo River), 2.5 km in the Tutaekuri River and 4.1 km into the Clive River
(Figure 4-2).
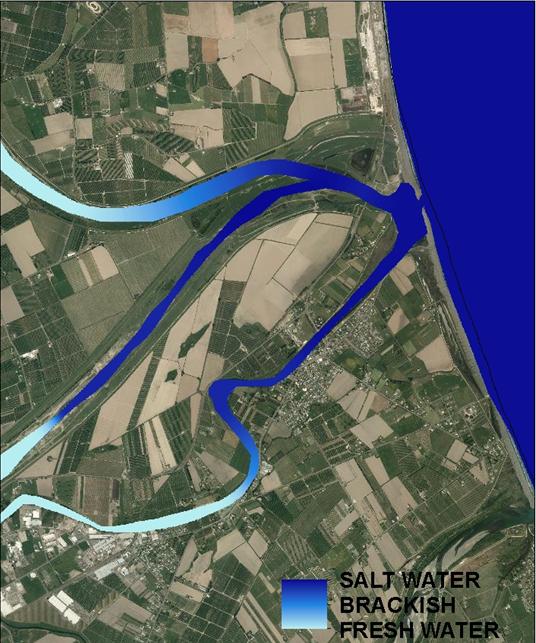
Figure 4-2: Maximum
extent of saltwater influence in the Waitangi Estuary.
The minimum extent of
saltwater influence in the Waitangi Estuary was shorter in the Tutaekuri and
Ngarururo arms than the Clive River (Figure 4-3). This is likely due to the
larger catchments and greater flows of water in the former that exert a greater
pressure on the salt water, particularly during rainfall events .
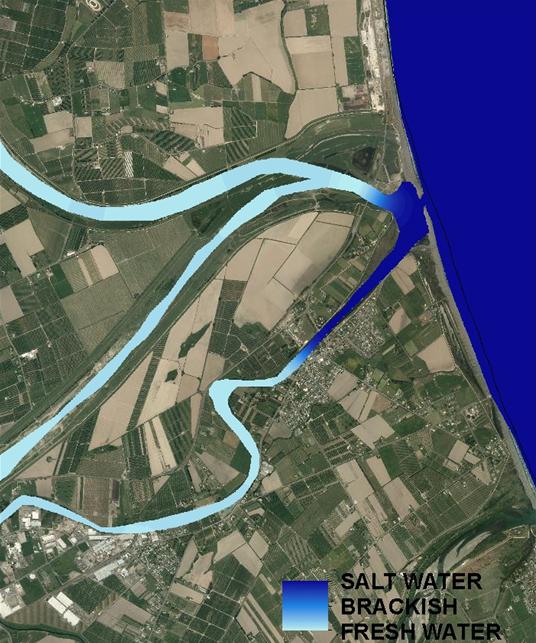
Figure 4-3: Minimum
extent of saltwater influence in the Waitangi Estuary.
4.1 Clive
River
The Clive River is the
southern-most arm of the Waitangi Estuary. The Clive River follows the original
path of the Ngarururo River prior to its channelization. The flows in the Clive
River are much smaller than would typically be found in a river channel of this
size. As a consequence, flows in the Clive River are slower than the
other rivers; this creates a depositional environment – as a consequence,
the river bed is characterised by soft sediments and extensive macrophyte
growth. Flow measurements from a hydrographic site in the Awanui Stream (one of
the tributaries of the Clive River) were used as a proxy for flow conditions in
the Clive River.
The maximum extent of
saltwater influence in the Clive River was 4.1 km from the mouth.
Data from loggers
collected during both periods of deployment were correlated against median flow
and tide conditions (Table 4-1).
Table 4-1: Spearman
Correlation Coefficients for Clive River sites.
Figures shown in bold are statistically significant (p<0.05).
|
|
Site
|
Period
of Deployment
|
Tidal
delay
|
Conductivity
vs. Flow
|
Conductivity
vs. Tide height
|
|
 UPSTREAM UPSTREAM
|
3 C
|
27/02/13–
16/04/13
|
+ 3 hrs
|
-0.578
|
0.047
|
|
|
2 C
|
27/02/13–
16/04/13
|
+ 3 hrs
|
-0.757
|
0.093
|
|
DOWNSTREAM
|
1 C
|
18/12/12-
24/01/13
|
0 hrs
|
-0.766
|
0.213
|
Flow had a significant
negative correlation with conductivity at all sites (Table 4-1). This suggests
a strong relationship between an increase in flow and a decrease in
conductivity. Towards the estuary mouth a higher flow is required to reduce the
influence of saltwater (see Figure 4-4). Tide height had a weak positive
correlation with conductivity at Site 1C but no relationship at the upstream
sites (Table 4-1). This suggests flow is the deciding factor limiting
conductivity at all sites, however at the estuary mouth tidal height
additionally has a small positive influence on conductivity levels. At all
sites the periods of highest conductivity were associated with the period of
highest tidal coefficient (Figure 4-5).
|
Site 3C
|
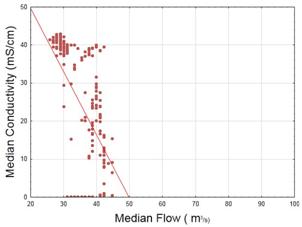
|
Upstream
|
|
Site 2C
|
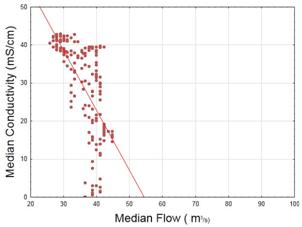
|

|
|
Site 1C
|
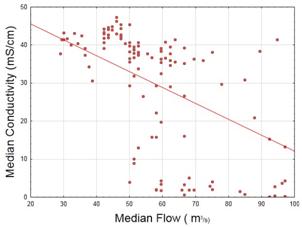
|
Downstream
|
Figure 4-4: Scatter
plot of median flow (X) and median conductivity (Y) for the Clive River.
|
Site 3C
|
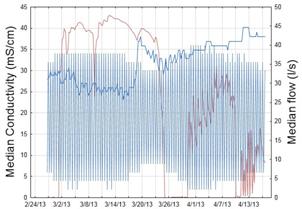
|
Upstream
|
|
Site 2C
|
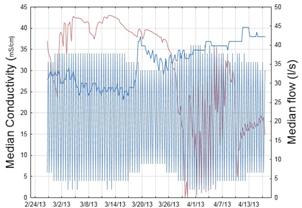
|

|
|
Site 1C
|
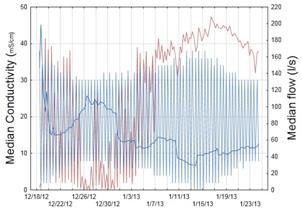
|
Downstream
|
|
Tide Height Median Flow Median Conductivity
|
Figure
4-5: Line
plot of tide height with associated median conductivity (Y1) and median flow
(Y2) readings.
Note
the different flow values (Y2) between the sites 3C and 2C and the site 1C,
corresponding to different periods of deployment.
4.2 Ngarururo
River
The Ngarururo River
forms the central arm of the Waitangi Estuary. It generally contributes the
greatest flow of the three rivers which flow into the Waitangi Estuary. Where
the river enters the estuary it is channelised with a deep thalweg. The bed of
the estuary is mainly comprised of river gravels.
The hydrographic site
at Fernhill was used to measure flow (m3/sec). Flows from 2 –
26 m3 /sec were recorded (annual mean = 33.12 m3/sec). Conductivity data collected
from the Odyssey loggers was correlated against flow and tide height (Table 4-2).
The maximum extent of
saltwater influence in the Ngarururo River was 5.1 km from the estuary mouth.
Table 4-2: Spearman
Correlation Coefficients for Ngarururo River sites.
Figures shown in bold are statistically significant (p<0.05).
|
|
Site
|
Period
of Deployment
|
Tidal
delay
|
Conductivity
vs. Flow
|
Conductivity
vs. Tide height
|
|
 UPSTREAM UPSTREAM
|
3 N
|
27/02/13–
16/04/13
|
+ 3 hrs
|
-0.563
|
0.146
|
|
|
2 N
|
18/12/12-
24/01/13
|
+ 2 hrs
|
-0.247
|
0.479
|
|
|
1 N
|
18/12/12-
24/01/13
|
0 hrs
|
-0.289
|
0.716
|
|
DOWNSTREAM
|
0
|
18/12/12-
24/01/13
|
0 hrs
|
-0.288
|
0.645
|
Flow and tidal height
have significant negative and positive correlations respectively with
conductivity (Table 4-2). Flow had a higher negative correlation at the most
upstream site (3 N), suggesting that the influence of flow on the extent of
saltwater influence increased with distance from the river mouth. Similarly,
the flow rate required to reduce saltwater influence at the lower sites was
much higher than that at the upper sites (Figure 4-6). The lower sites had a
higher positive correlation with tide height, suggesting that at these sites an
increase in tide height had a more important influence on conductivity than
flow. At all sites the periods of highest conductivity were associated with the
period of highest tidal coefficient (Figure 4-7).
|
Site 3N
|
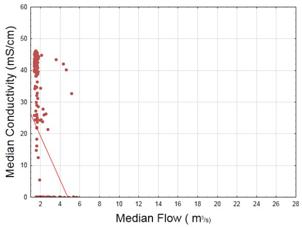
|
 Upstream Upstream
|
|
Site 2N
|
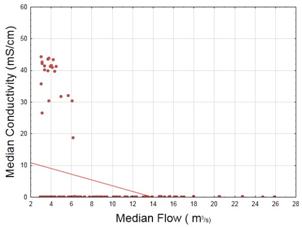
|
|
|
Site 1N
|
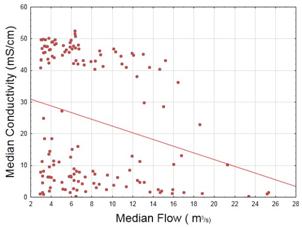
|
|
Site 0
|
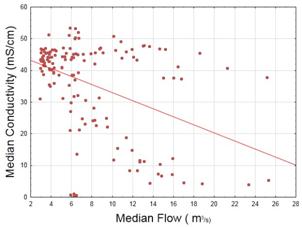
|
Downstream
|
Figure 4-6: Scatter
plot of median flow (X) and median conductivity (Y) for the Ngaruroro River.
|
Site 3N
|
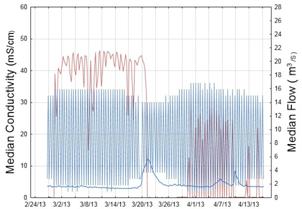
|
 Upstream Upstream
|
|
Site 2N
|
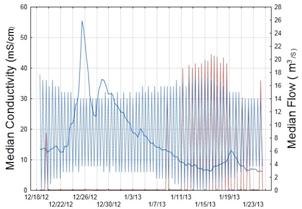
|
|
|
Site 1N
|
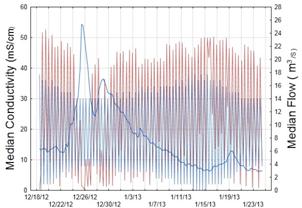
|
|
Site 0
|
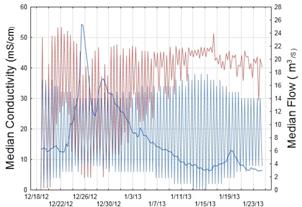
|
Downstream
|
|
Tide Height Median Flow Median Conductivity
|
Figure
4-7: Line
plot of tide height with associated median conductivity (Y1) and median flow
(Y2) readings.
Note
the different flow values (Y2) between the site 3N and the other sites corresponding
to different periods of deployment.
4.3 Tutaekuri
River
The Tutaekuri River
forms the northern arm of the Waitangi Estuary. The Tutaekuri River is the
shallowest of the three rivers running into the Waitangi Estuary and the bed is
predominantly clean river gravels.
The hydrographic site
at Puketapu was used as a proxy for flows into the estuary. Flows ranging
between 3 – 25 m3/sec were recorded during the period of
logger deployment (annual mean = 11.66 m3/sec).
The maximum extent of
saltwater influence in the Tutaekuri River was approximately 2.9 km from the
mouth.
Several of the loggers
placed in the Tutaekuri River malfunctioned, and the data from these loggers
failed quality control checks. Therefore data from only two loggers were
used in the assessment.
Table 4-3: Spearman
Correlation Coefficients for Tutaekuri River sites.
Figures shown in bold are statistically significant (p<0.05).
|
|
Site
|
Period
of Deployment
|
Tidal
delay
|
Conductivity
vs. Flow
|
Conductivity
vs. Tide height
|
|
UPSTREAM
|
1T
|
27/02/13–
16/04/13
|
+ 3 hrs
|
-0.088
|
0.308
|
|
DOWNSTREAM
|
0
|
18/12/12-
24/01/13
|
0 hrs
|
-0.288
|
0.645
|
Tide height was
positively correlated with conductivity at both sites (Table 4-3). This
suggests a strong relationship between an increase in tide height and conductivity
at site 0, and a moderate relationship at site 1T (Figure 4‑8).
Conductivity was
negatively correlated with flow at the downstream site only (Table 4-3). It was
expected that the saline wedge would act similarly in the Tutaekuri River as
was observed in the other rivers, with the negative correlation of conductivity
with flow increasing in an upstream direction. However no significant
correlation between flow and conductivity was observed - therefore the
scatterplot of flow (X) and conductivity (Y) has not been plotted for this
river.
|
Site 1T
|
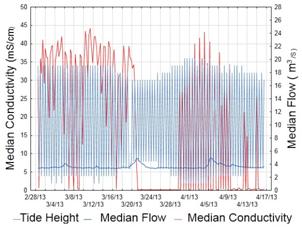
|
Upstream
|
|
Site 0
|
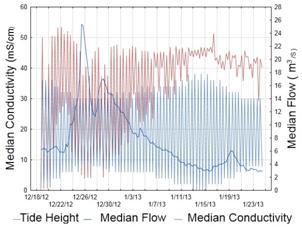
|
Downstream
|
Figure 4‑8: Line
plot of tide height with associated median conductivity (Y1) and median flow
(Y2) readings.
Note the different flow values (Y2) between the two sites indicating different
periods of deployment.
5 Ahuriri
Estuary
In a region dominated
by alluvial flood plain river mouths, the Ahuriri Estuary (Te
Whanganui-a-Orotu) represents one of the few tidal lagoon estuaries in
Hawke’s Bay. With an area of 470 ha it is also the region’s largest
estuary. Unlike the other estuaries, this estuary also has large areas of
associated wetlands (approx. 175 ha) (Madarasz-Smith, 2013).The Ahuriri Estuary
also differs from the other estuaries in the area as there are no large
riverine inputs. The bed of the estuary comprises of mainly soft sediments and
the water depth is generally much shallower than the other estuaries reported
here.
Figure 5-1 shows the
sites of logger deployment within the estuary. Placement of the loggers
was informed by conductivity data collected at a limited number of sites during
previous investigations on the estuary (HBRC unpublished) and an initial survey
of bankside vegetation. The initial survey of the Ahuriri Estuary used the
extent and location of native vegetation, especially the raupo (Typha
orientalis) as an indicator of the maximum extent of the saltwater
influence.
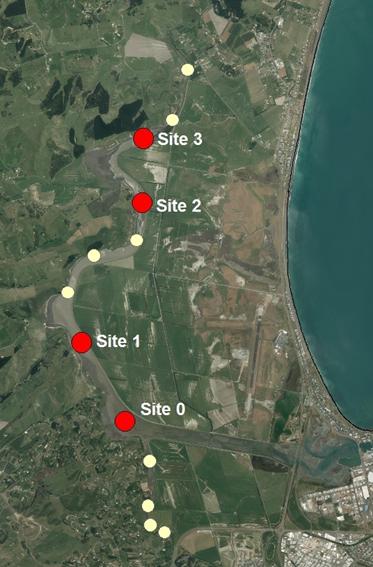
Figure 5-1: Ahuriri
estuary logger deployment sites.
Red points denote
sites where logger data was correlated against flow and tide height.
Conductivity loggers
were deployed in the Ahuriri Estuary (Figure 5-1) for two periods, first
between the 17/08/12 and the 25/09/12 and then between the 23/04/13 and the
6/06/13. During the first deployment, several of the loggers malfunctioned and
the data gathered from these loggers failed quality control checks and were
therefore not used in the assessment. The second period of deployment was at
the end of an extended period of drought. Loggers were attached to existing structures
and warratahs driven into the soft sediment.
There was no
operational flow site within the Ahuriri Estuary during the time of logger
deployment so rainfall at a nearby site (Newstead) was used as a proxy for flow
in the estuary. There were two periods of low rainfall during the time of
deployment but these seemed to have little effect on conductivity measurements
(Figure 5-4).
5.1 Ahuriri
Estuary Results
ArcGIS was used to
interpolate the logger data and generate graphical images of the maximum (Figure
5-2) and minimum (Figure 5-3) extent of saltwater influence in the Ahuriri
Estuary. The maximum extent of saltwater influence into the Ahuriri Estuary was
approximately 9.2 km (Figure 5-2).
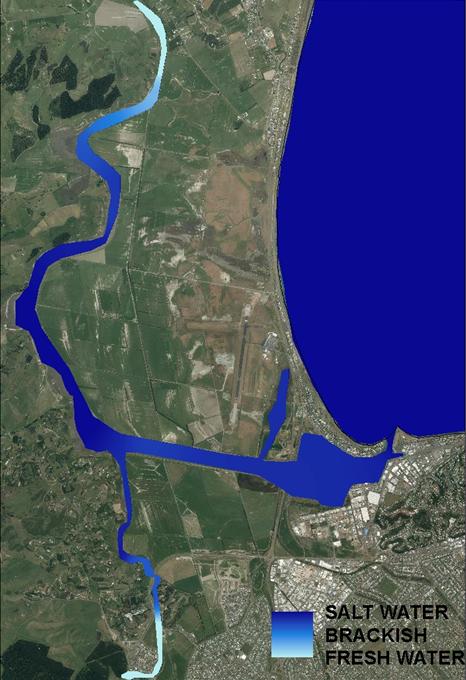
Figure 5-2: Maximum
extent of saltwater influence in the Ahuriri Estuary.
The ArcGIS
interpolation for the minimum extent (Figure 5-3) utilised data collected
during previous surveys of the estuary and shows the saline water pushed back
almost to the mouth of the estuary.
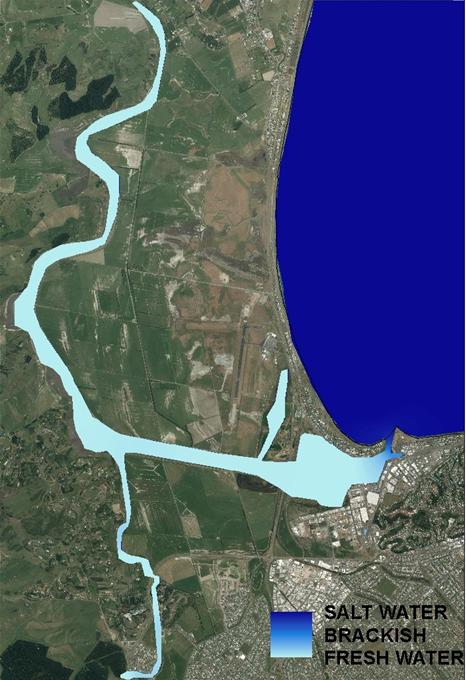
Figure 5-3: Minimum
extent of saltwater influence in the Ahuriri Estuary.
Conductivity was not
significantly correlated with rainfall at any of the sites (Table 5-1). Due to
this lack of correlation the scatter plots of conductivity (Y) and rainfall (X)
have not been plotted.
Table
5-1: Spearman
Correlation Coefficients for Ahuriri Estuary sites.
Figures shown in bold are statistically significant (p<0.05).
|
|
Site
|
Period
of Deployment
|
Tidal
delay
|
Conductivity
vs. Rainfall
|
Conductivity
vs. Tide height
|
|
UPSTREAM
|
3
|
23/04/13 –
06/06/13
|
+ 6 hrs
|
- 0.089
|
0.279
|
|

|
2
|
23/04/13 –
06/06/13
|
+ 6 hrs
|
0.103
|
0.312
|
|
1
|
23/04/13 –
06/06/13
|
+ 3 hrs
|
0.005
|
0.339
|
|
DOWNSTREAM
|
0
|
23/04/13 –
06/06/13
|
+ 3 hrs
|
-0.011
|
0.338
|
At all sites,
conductivity was positively correlated with tide height (Table 5-1). This suggests
that tide height is the significant factor influencing the extent of saltwater
influence in the Ahuriri Estuary. There was less variation in conductivity
readings between the low and high tides (Figure 5-4) than the Tukituki and
Waitangi Estuaries due to a higher degree of vertical mixing through the water
column, and much smaller inflows of freshwater into the estuary.
|
Site 3
|
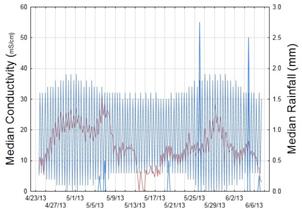
|
 Upstream Upstream
|
|
Site 2
|
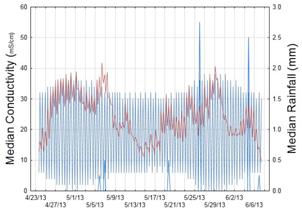
|
|
|
Site 1
|
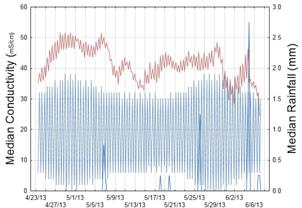
|
|
Site 0
|
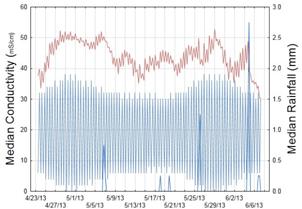
|
Downstream
|
|
Tide Height Median Flow Median Conductivity
|
Figure
5-4: Line
plot of tide height with associated median conductivity (Y1) and median
rainfall (Y2) readings.
6 Discussion
The data collected
from the Tukituki, Waitangi and Ahuriri Estuaries indicate that the individual
estuaries have different salinity regimes, driven largely by their physical
characteristics and the magnitude of freshwater inflows.
Data from the Tukituki
Estuary indicate that it is the most stratified of the three estuaries. The correlations
suggest that flow is the dominant force governing the extent of saltwater
influence, with all conductivity values at all sites displaying a stronger
relationship with flow than tide height (Table 3-1). Under the conditions
encountered, the Tukituki acted as a classic ‘saline-wedge’ estuary
(Pritchard, 1989), with the salt water pushing up under the fresh water with
little mixing between the two layers. Since flow appears to be the dominant
force influencing the extent of saltwater influence at this site, any changes
in flow are likely to affect the extent of saltwater influence. However,
the relatively steep gradient of the upper Tukituki Estuary appears to act as a
physical barrier as the estuary bed rapidly rises above sea level. The bed of
the estuary is dynamic and this physical barrier can move up or downstream in
responses to changes to the river bed following flood events. During the
initial survey it was hoped to use bankside vegetation as an indicator of the
extent of saltwater influence; the strong stratification and limited mixing of
fresh and saline water has little impact on the vegetation, which only comes
into contact with the surface freshwater layer. This is evident in the fact
that willows are present almost down to the estuary mouth.
As a common mouth for
three river systems, the characteristics of the extent of saltwater influence
in the Waitangi Estuary were different in each of the rivers. The Clive River
is highly stratified and acted as a ‘saline-wedge’ estuary where
flow had a stronger correlation with conductivity than tide height (Table 4-1).
In the Ngarururo River although both flow and tide height appeared to strongly
influence the extent of saltwater influence (Table 4-2), the water still
appeared stratified. The Tutaekuri River, as the shallowest of the three arms
of the Waitangi Estuary, did not appear to be as stratified as either the Clive
or Ngarururo arms. For the Tutaekuri arm, tide height was significantly
correlated with conductivity (Table 4-3). As for the Tukituki Estuary, the
Waitangi Estuary is susceptible to changes in low flows affecting the maximum
extent of saltwater influence, however, this extent is also bounded by the
physical barrier of the river beds rising above sea level.
The Ahuriri Estuary
has different physical characteristics to the Tukituki and Waitangi Estuaries.
There are no large riverine inputs, and the estuary itself is relatively
shallow and meandering with extensive wetlands. The lack of riverine inputs is
reflected in the salinity regime, with
tide height the significant variable affecting salinity at all sites (Table 5-1).
Unlike the Tukituki and Waitangi Estuaries, conductivity remains high in the
estuary throughout the tidal cycle (Figure 5-4) (Figure 3-5, Figure 4-5, Figure 4-7). The
limited freshwater inflow, generally shallow water and meandering nature of the
channel, combined with wind mixing, limit the stratification of the water in
the estuary. This lower degree of stratification means that the extent of
saltwater influence is more likely to have an impact on the bankside vegetation
than in the Waitangi or Tukituki Estuaries.
It is possible that
the extent of saltwater influence recorded in the Ahuriri Estuary was unusual
as large diebacks of the saltwater intolerant plant raupo were observed
upstream of Site 2 during the summer of 2013. The presence of raupo suggests
that under typical conditions, saline or brackish water does not travel this
far toward the head of the estuary. Another factor that could have caused some
of the dieback of the Raupo was input of heavily brackish water (measured at 35
mS/cm) from a pump station 500m up-stream from site 3. The reason for this pump
station to be discharging heavily brackish water is unknown but could be due to
the disturbance of previously static marine silts or an increased level of
seawater ingress into the groundwater due to the drought conditions.
Data collected in the
Tukituki and Waitangi Estuaries suggest that Council-managed activities are
unlikely to influence the maximum extent of saltwater influence in these
estuaries appreciably, because of the dominant effect of the physical barrier
caused by the riverbed rising above sea level, regardless of flow. This has the
potential to affect the distribution of species that do not have a high degree
of salt tolerance. Further monitoring over longer time periods and through
different flow conditions is required to verify this. The limited inflow of
freshwater into the Ahuriri Estuary means that while it is likely to be less
susceptible to changes in low flows than other estuaries, the relatively low
gradient makes it more susceptible to issues such as sea level rise caused by
global warming.
Initial surveys of the
estuaries prior to logger deployment showed that bankside vegetation was of
little use as an indicator of the extent of saltwater influence, primarily
because these estuaries are generally highly modified (channelised and denuded
of native vegetation). An exception was the upper reaches of the Ahuriri
Estuary. Secondly, the water in the estuaries (especially the Tukituki and
Waitangi Estuaries) is highly stratified, generally confining the saltwater to
the deepest parts of the channel (the thalweg), limiting contact with and
therefore effect on the bankside vegetation. The best broadscale indicator of
the saltwater wedge appeared to be water clarity. Under low flow conditions the
river waters appeared less turbid than the associated marine waters. This
resulted in a visually identifiable change in the waters that was verified
using a field conductivity meter.
The initial surveys of
the estuaries, carried out on spring tides (>1.7m), led to under-estimation
of the extent of the saltwater influence because of the unexpectedly large
delay in the tidal wave reaching the upper parts of the estuaries. Previously
the tidal delay in the Ahuriri estuary was believed to be +2.5 hours
(Madarasz-Smith, pers. comm.). The data collected during this investigation
shows the tidal delay to vary between 3 hrs at Site 0 at the mouth of the Taipo
Stream, to as much as 9 hrs at the at the head of the estuary (the maximum
extent of saltwater influence). It was only by deploying static continuous
recording devices such as those used in this investigation that it was possible
to determine the extent of this tidal wave delay.
The interface between
saline and freshwater is highly productive, characterised by effects such as
phytoplankton blooms (J. Lobry 2003). During these surveys, extensive
phytoplankton blooms were observed in the Clive (24/01/13) and Ngarururo
(15/04/13) rivers, and small localised blooms were observed in the Tukituki
(27/02/13) and Tutaekuri (27/02/13) Rivers. Samples collected from both the
Ngarururo and Tukituki Rivers were dominated by Cryptomonas sp. For
blooms to persist in estuaries, warm temperatures and stable flow conditions
are required. A similar bloom of Cryptomonas sp. was observed by
Robertson and Stevens (Stevens 2008) in the upper areas of the Motupipi Estuary
(Tasman) which was caused by a combination of excessive nutrient
concentrations, a stable salt wedge, warm water temperatures, stable base-flows
and limited turbulent mixing. The conditions in the Hawke’s Bay estuaries
where blooms occurred generally mirrored the conditions observed in the
Motupipi estuary: Water temperatures were high, flows were extremely low and
stable, causing little turbulence and a stable salt wedge. These conditions may
be regarded as atypical because the region was in the middle of a prolonged
drought, with uncharacteristically low flows that persisted over a longer
period of time than usual. Under normal conditions when flows are
generally higher and more varied, it is unlikely that blooms would have a
chance to form. Further study of the extent and frequency of bloom formation in
the regions estuaries will be required to understand the dynamics involved, or
whether Council-managed activities influence the extent or persistence of these
blooms.
|
The
Tukituki, Waitangi and Ahuriri Assessment of the Extent of Saltwater
Influence in Hawke's Bay Estuaries
|
Attachment 2
|
7 Conclusion
This report describes
the extent of saltwater influence in the Tukituki, Waitangi and Ahuriri
Estuaries. The maximum extent of saltwater influence in these estuaries was:
§ 1
km into the Tukituki Estuary;
§ 4.1
km into the Clive River arm of the Waitangi Estuary;
§ 5.1
km into the Ngarururo River arm of the Waitangi Estuary;
§ 2.9
km into the Tutaekuri River arm of the Waitangi Estuary;
§ 9.2
km into the Ahuriri Estuary;
These values provide a
reference point against which temporal changes in the extent of saltwater
influence in these estuaries may be compared.
8 Acknowledgements
Shane Gilmer for
invaluable assistance during logger deployment and retrieval.
|
The
Tukituki, Waitangi and Ahuriri Assessment of the Extent of Saltwater
Influence in Hawke's Bay Estuaries
|
Attachment 2
|
9 References
Hume, T. (2013). Key
Statistics and Flushing Time for the Tukituki Estuary, NIWA.
J. Lobry, L. M., E. Rochard and P.
Elie (2003). "Structure of the Gironde estuarine fish assemblages: a
comparison of European estuaries perspective." Aquatic Living Resources
16: 47-58.
J. Maes, A. T., P. A. Van Damne, K.
Cottenie and F. Ollevier (1998). "Seasonal Patterns in the Fish and
Crustacean Community of a Turbid Temperate Estuary (Zeeschelde Estuary,
Belgium)." Estuarine, Coastal and Shelf Science 47: 143-151.
P. Meire, T. Y., S. Van Damme, E.
Van den Bergh, T. Maris and E. Struyf (2005). "The Scheldt Estuary: a
description of a changing ecosystem." Hydrobiologia 540:
1-11.
Rijn, L. C. V. (2010). Tidal
phenomena in the Scheldt Estuary. LTV Zandhuishuoding Schelde Estuarium 2010,
Deltares.
Stevens, B. R. a. L.
(2008). Motupip Estuary: Vulnerability Assessment and Monitoring
Recommendations
|
The
Tukituki, Waitangi and Ahuriri Assessment of the Extent of Saltwater
Influence in Hawke's Bay Estuaries
|
Attachment 2
|
Appendix A Laboratory
test results
Tukituki estuary bloom report
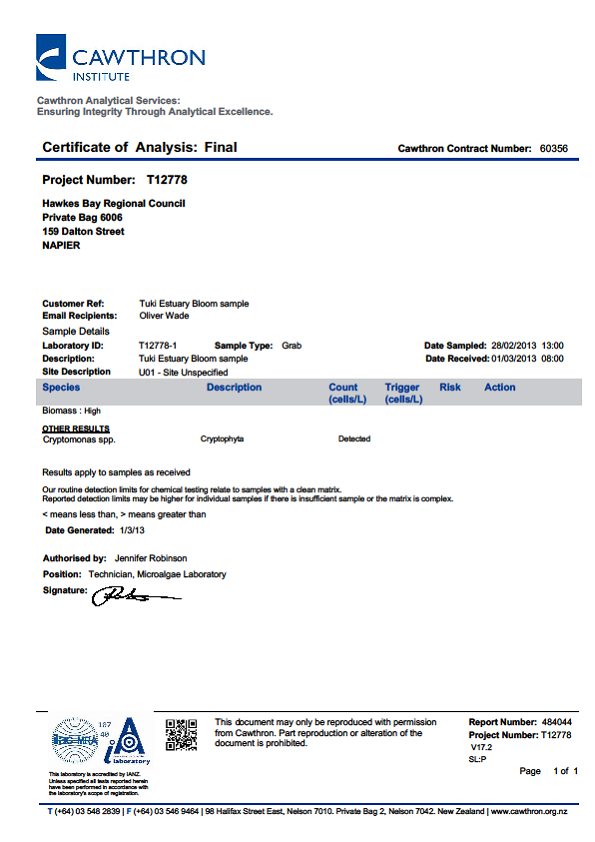
Ngarururo bloom laboratory
report
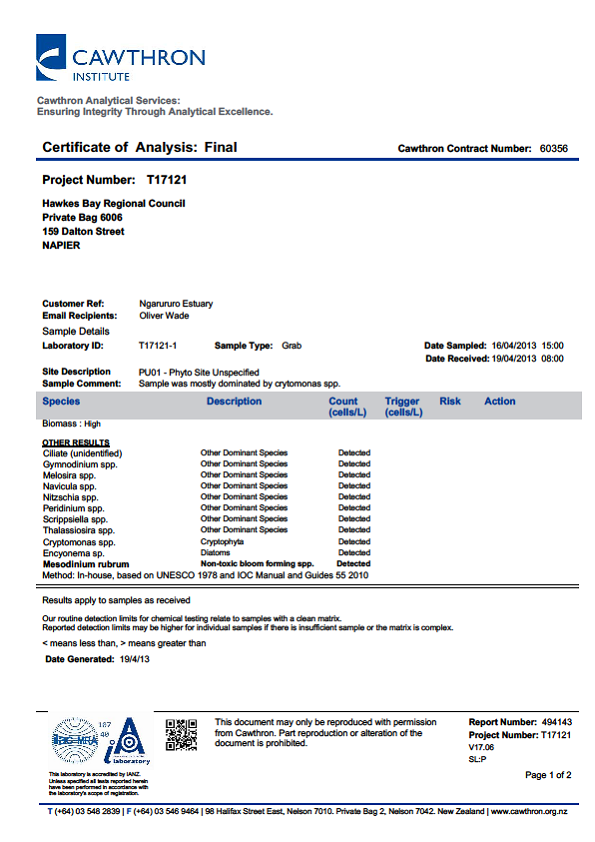
Hume, T.
(2013). Key Statistics and Flushing Time for the Tukituki Estuary, NIWA.
J. Lobry, L.
M., E. Rochard and P. Elie (2003). "Structure of the Gironde estuarine
fish assemblages: a comparison of European estuaries perspective." Aquatic
Living Resources 16: 47-58.
J. Maes, A.
T., P. A. Van Damne, K. Cottenie and F. Ollevier (1998). "Seasonal
Patterns in the Fish and Crustacean Community of a Turbid Temperate Estuary
(Zeeschelde Estuary, Belgium)." Estuarine, Coastal and Shelf Science
47: 143-151.
P. Meire, T.
Y., S. Van Damme, E. Van den Bergh, T. Maris and E. Struyf (2005). "The
Scheldt Estuary: a description of a changing ecosystem." Hydrobiologia
540: 1-11.
Rijn, L. C. V.
(2010). Tidal phenomena in the Scheldt Estuary. LTV Zandhuishuoding Schelde
Estuarium 2010, Deltares.
Stevens,
B. R. a. L. (2008). Motupip Estuary: Vulnerability Assessment and Monitoring
Recommendations.
HAWKE’S BAY REGIONAL COUNCIL
Maori
Committee
Tuesday 24 June 2014
SUBJECT: RMA Section 35a Requirements
Reason
for Report
1. The purpose of
the paper is twofold. Firstly, it is to provide an overview of the
requirements in section 35A of the Resource Management Act 1991 to keep and
maintain records of iwi and hapu in the region. Secondly, it is to update
the Committee on how the region’s local authorities led by the Regional
Council, are working together to build a GIS-based application for improved
s35A RMA record-keeping.
Background
2. Section 35A of
the RMA requires councils to keep and maintain records about iwi authorities
and any groups that represent hapu for RMA purposes. Similar requirements
are also placed on the Crown. Such records may include statutory areas
defined by legislation (RMA or others such as the Fisheries Act 1996); organisations
recognised in statutes; and Post Settlement Entities recognised by the Crown
for RMA purposes.
3. Specifically,
councils must keep and maintain:
3.1. the contact
details of each iwi authority and any groups that represent hapu for RMA
purposes;
3.2. planning documents
recognised by each iwi authority and lodged with the council; and
3.3. any area
where iwi or hapu exercise kaitiakitanga.
4. The local
authority must include in its records all the information provided to it by the
Crown, but may seek and hold other information from other sources. The
duty to keep and maintain records in relation to hapu is only applicable if
that hapu requests the Crown or local authority to include the relevant
information. Any such records of iwi and hapu groups must only be used
for RMA purposes.
5. Other RMA
requirements associated with records of iwi authorities and hapu groups
include:
5.1. Schedule 1
Clause 3(1)(d) - councils shall consult “with tangata
whenua of the area who may be so affected, through iwi authorities”
during preparation of policy statements and plans [emphasis added]
5.2. Schedule 1
Clause 3(1)(e) - councils may consult with anyone else during
preparation of policy statements and plans [emphasis added]
5.3. S36A –
explicitly states that an applicant and council do not have any duty to consult
any person regarding the preparation, processing or decision-making in relation
to a resource consent.
6. Hawke's Bay
Regional Council already keeps records of iwi authorities and marae/hapu
groups. Those records are currently in spread sheet form. From time
to time, additional references may be made to online resources from other
organisations such as:
6.1. Te Kahui
Mangai provided by Te Puni Kokiri on behalf of the Crown (www.tkm.govt.nz)
6.2. Maori Maps
provided by Te Potiki National Trust (www.maorimaps.com)
and
6.3. Tuhono iwi info provided by the Tūhono Trust (formerly known as
the Tautoko Māori Trust) (www.tuhono.net).
7. Currently, each
of the main city and district councils in Hawke's Bay holds variable
information about iwi authorities and hapu groups in their respective
Districts.
Development of a GIS-based
application
8. In
May 2014, planning and GIS staff from each of the four TLAs and Hawke's Bay
Regional Council met and discussed development of a digital repository of
information regarding iwi and hapu groups in the Hawke's Bay region.
Those present agreed that a regional GIS-based application that spatially
records location of marae and contact details would complement improvements to
how councils meet the requirements of s35A RMA. Improvements can be made
collectively and made available through a GIS/web-based application covering
the whole Hawke's Bay region, rather than each council continuing to hold
individual sets of records for s35A RMA purposes.
9. In
addition to data required to fulfil councils’ obligations under s35A RMA,
the following was considered to be additional useful capability to potentially
build into a regional data repository over time:
|
Information
|
Details
|
|
Areas of
interest/significance relating to kaitiakitanga
|
Hapu
‘precincts’
Buffer zones
|
|
Filtered public information
|
‘Swiss Bank’ of
site/area information
e.g. sensitive waahi tapu information.
|
|
Hapu/marae contact details
|
Websites, postal, phone,
contact personnel
|
|
Marae locations
|
Maps and photos
|
|
Publicly available
cultural/heritage sites
Waahi Tapu sites
|
Heritage New Zealand
NZ Archaeological
Association
District Plans
Regional Plans
|
|
Related hapu/iwi planning
documents
|
Hapu Management Plans
MOUs; Protocols;
Agreements, etc.
|
|
Website links
|
Hapu/iwi websites
Hapu Management Plans
|
Next Steps
10. In
relation to iwi authorities, data already exists and has been obtained from Te
Kahui Mangai – the Crown’s dataset of iwi authorities and groups
representing hapu for RMA purposes.
11. In
relation to marae locations and associated hapu contacts, the Regional Council,
Hastings District Council and Wairoa District Council have various existing GIS
datasets. Central Hawke's Bay District Council and Napier City Council
would require further resources to develop datasets for marae location and
contact information. At the May meeting of council staff representatives,
it was agreed that the collation of additional information should start with
the engagement of marae/hapu. Details of any such engagement are yet to
be planned.
12. As the
majority of spatial and contact information is already readily available
online, the council staff representatives considered that it was appropriate to
publish information in a regional GIS-based application. The development
of a ‘pilot’ application can be undertaken by the Regional Council
in the short-term using existing datasets supplied by the TLAs. Further
discussion will be required regarding on-going maintenance of the datasets.
13. Planning
and GIS staff will have further discussions about development of the GIS-based
application to keep and maintain records for s35A RMA purposes; and
medium-term, keep and maintain records of marae and hapu for broader local
government engagement and decision-making purposes.
Decision
Making Process
14. Council is required to
make a decision in accordance with Part 6 Sub-Part 1, of the Local Government
Act 2002 (the Act). Staff have assessed the requirements contained within
this section of the Act in relation to this item and have concluded that, as
this report is for information only and no decision is to be made, the decision
making provisions of the Local Government Act 2002 do not apply.
|
Recommendation
1. That
the Maori Committee receives the report.
|
|
Esther-Amy Bate
Planner
|
Gavin Ide
Manager,
Strategy and Policy
|
|
Helen Codlin
Group
Manager Strategic Development
|
|
Attachment/s
There are no
attachments for this report.
HAWKE’S BAY REGIONAL
COUNCIL
Maori
Committee
Tuesday 24 June 2014
SUBJECT: Statutory Advocacy Update
Reason for Report
1. This paper reports on proposals forwarded to the Regional Council
and assessed by staff acting under delegated authority as part of the
Council’s Statutory Advocacy project between 4 February and 1 April 2014.
2. The Statutory Advocacy project (‘Project 196’) centres
on resource management-related proposals upon which the Regional Council has an
opportunity to make comments or to lodge a submission. These include, but
are not limited to:
2.1. resource consent applications publicly notified by a territorial
authority
2.2. district plan reviews or district plan changes released by a
territorial authority
2.3. private plan change requests publicly notified by a territorial
authority
2.4. notices of requirements for designations in district plans
2.5. non-statutory strategies, structure plans, registrations, etc
prepared by territorial authorities, government ministries or other agencies
involved in resource management.
3. In all cases, the Regional Council is not the
decision-maker, applicant nor proponent. In the Statutory Advocacy
project, the Regional Council is purely an agency with an opportunity to make
comments or lodge submissions on others’ proposals. The Council’s
position in relation to such proposals is informed by the Council’s own
Plans, Policies and Strategies, plus its land ownership or asset management
interests.
4. The summary plus accompanying map outlines those proposals that the
Council’s Statutory Advocacy project is currently actively engaged in.
Decision Making
Process
5. Council is required to make a decision in accordance with Part 6
Sub-Part 1, of the Local Government Act 2002 (the Act). Staff have
assessed the requirements contained within this section of the Act in relation
to this item and have concluded that, as this report is for information only
and no decision is to be made, the decision making provisions of the Local
Government Act 2002 do not apply.
|
Recommendation
1. That
the Maori receives the Statutory Advocacy Update
report.
|
|
Helen Codlin
Group
Manager Strategic Development
|
|
Attachment/s
|
1
|
Statutory Advocacy Map
|
|
|
|
2
|
Statutory Advocacy update
|
|
|
|
Statutory
Advocacy Map
|
Attachment 1
|
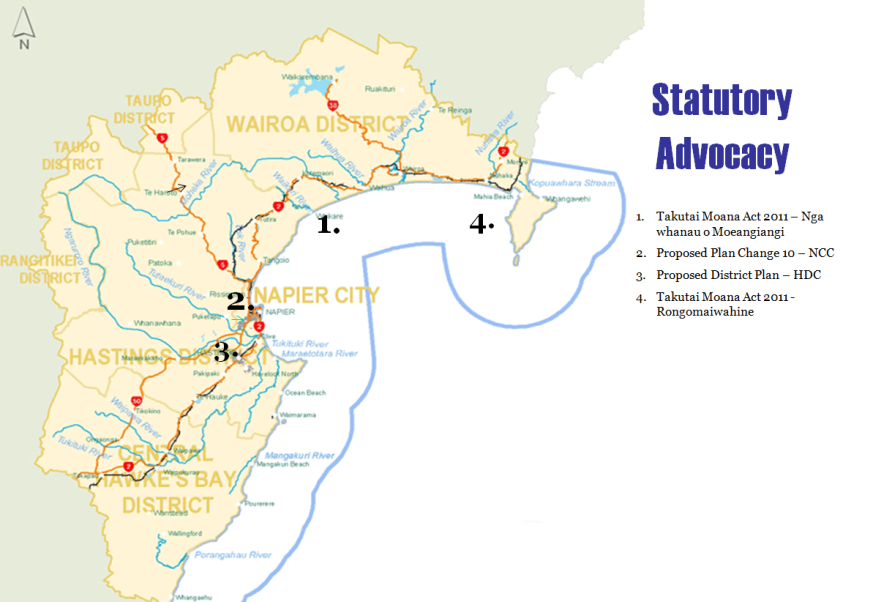
|
Statutory Advocacy update
|
Attachment 2
|
Statutory Advocacy Update (as at 1 April 2014)
|
Received
|
TLA
|
Map Ref
|
Activity
|
Applicant/
Agency
|
Status
|
Current Situation
|
|
21 January
2014
|
NA
|
1
|
Application
under Coastal and Marine (Takutai Moana) Act 2011
Nga whanau o Moeangiangi Pt 42N has
made an application for a Protected Customary Rights Order and a Customary
Marine Title Order for an area lying between Waipatiki and Mohaka. This
application is made under section 100 of the Marine and Coastal Area (Takutai
Moana) Act 2011.
|
Nga whanau o
Moeangiangi
Pt 42N
(Wayne T Taylor)
|
Notified
|
1
April 2014
· Not
considered necessary for HBRC to join High Court proceedings. No
further response required.
|
|
5 December
2013
|
NCC
|
2
|
Plan Change
10 to the Operative City of Napier District Plan.
A community
driven Plan Change to harmonise district wide provisions between the Napier
District Plan with the Hastings District Plan, incorporate the Ahuriri
Subdistrict Plan and update provisions as a result of recent Napier City
Council policy changes and decisions into the Napier District Plan.
|
NCC
|
Notified
|
1
April 2014
· HBRC lodged
submission on Change 10 in February 2014.
· Napier CC are
currently summarising submissions. Further submissions yet to be
invited.
|
|
8 November
2013
|
HDC
|
3
|
Proposed
Hastings District Plan
Review of the
Hastings District Plan in its entirety. Includes the harmonisation of
district wide provisions between the Napier District Plan with the Hastings
District Plan where relevant..
|
HDC
|
Notified
|
1
April 2014
· HBRC lodged
submission on proposed Hastings District Plan in February 2014.
· Hastings DC
are currently summarising submissions. Further submissions yet to be
invited.
|
|
1 August 2013
|
NA
|
4
|
Application
under Coastal and Marine (Takutai Moana) Act 2011
Rongomaiwahine has made an
application for a Protected Customary Rights Order and a Customary Marine
Title Order in the general Mahia Peninsular area under section 100 of the
Marine and Coastal Area (Takutai Moana) Act 2011.
|
Rongomaiwahine
(Pauline Tangiora)
|
Notified
|
1
April 2014
· Council has
opposed the grant of the orders unless the nature and geographical extent of
the orders is specified with sufficient detail to enable the Council to
appropriately understand the effect of the orders sought.
· High Court
has been assessing validity of other parties joining these proceedings.
No additional actions or responses have been required from HBRC since joining
proceedings in late 2013.
|
HAWKE’S BAY REGIONAL COUNCIL
Maori
Committee
Tuesday 24 June 2014
SUBJECT: Minor Items Not on the Agenda
Reason for Report
This document has been
prepared to assist Committee members note the Minor Items Not on the Agenda to
be discussed as determined earlier in Agenda Item 6.
|
Item
|
Topic
|
Councillor/Committee
member / Staff
|
|
1.
|
|
|
|
2.
|
|
|
|
3.
|
|
|
|
4.
|
|
|
|
5.
|
|
|