Meeting of the Environment and Services Committee
Date: Wednesday 11 June 2014
Time: 9.00am
|
Venue:
|
Council Chamber
Hawke's Bay Regional Council
159 Dalton Street
NAPIER
|
Agenda
Item Subject Page
1. Welcome/Notices/Apologies
2. Conflict
of Interest Declarations
3. Confirmation of
Minutes of the Environment and Services Committee held on 9 April 2014
4. Matters Arising
from Minutes of the Environment and Services Committee held on 9 April 2014
5. Call for any Minor
Items Not on the Agenda 3
6. Follow-ups from
Previous Committee Meetings 5
Decision Items
7. Biosecurity
Operational Plans 7
Information or Performance Monitoring
8. River Gravel Update 53
9. Update on Open
Space Area Plans 57
10. Science Report Updates 61
11. Statutory Advocacy Update 135
12. Minor Items Not on the Agenda 141
HAWKE’S BAY REGIONAL COUNCIL
Environment
and Services Committee
Wednesday 11 June 2014
SUBJECT: Call for any Minor Items Not on the Agenda
Reason for Report
1. Under standing orders, SO 3.7.6:
“Where an item is not on the agenda
for a meeting,
(a) That item
may be discussed at that meeting if:
(i) that
item is a minor matter relating to the general business of the local authority;
and
(ii) the
presiding member explains at the beginning of the meeting, at a time when it is
open to the public, that the item will be discussed at the meeting; but
(b) No
resolution, decision, or recommendation may be made in respect of that item
except to refer that item to a subsequent meeting of the local authority for
further discussion.”
2. The Chairman will request any items councillors wish to be added for
discussion at today’s meeting and these will be duly noted, if accepted
by the Chairman, for discussion as the final Agenda Item.
|
Recommendation
That the
Environment and Services Committee accepts the following minor items not on
the agenda, for discussion:
|
|
Paul Drury
Group
Manager Corporate Services
|
|
HAWKE’S BAY REGIONAL
COUNCIL
Environment
and Services Committee
Wednesday 11 June 2014
SUBJECT: Follow-ups from Previous Committee
Meetings
Reason for Report
There were no follow up items from the Previous Committee
meeting.
Attachment/s
There are no
attachments for this report.
HAWKE’S BAY REGIONAL COUNCIL
Environment
and Services Committee
Wednesday 11 June 2014
SUBJECT: Biosecurity Operational Plans
Reason
for Report
1. Council is the
management agency for the Hawke’s Bay Regional Pest Management Strategy
(now Regional Pest Management Plan – RPMP) and Regional Phytosanitary
Pest Management Strategy (now Regional Phytosanitary Pest Management Plan -
RPPMP). Section 100B of the Biosecurity Act 1993 requires that the management
agency for a pest management plan prepare and review the operational plan for
each Plan annually. Operational Plans have been prepared for both the RPMP and
RPPMP and are appended to this paper for Committee reference and are available
to other parties on request.
2. Staff believe
that the current operational plans have proven to be effective and therefore
only minor changes from the 2013/14 plans are proposed.
3. HBRC Regional
Pest Management Plans are under review and a councillor working group has been
formed to provide staff guidance on the future direction of the Plans. Subject
to the outcome of the Regional Pest Management Plan review changes may be made
to the 2015-16 operational plans.
4. This agenda
item seeks Council adoption of the 2014/15 operational plans.
Comment
Regional Pest
Management Plan
5. Key RPMP work
programmes included in the 2014/15 operational plan include:
5.1. The control of possums within
urban areas. This programme is proving to be very successful with bellbird
numbers doubling and Tui trebling within the urban areas monitored.
5.2. The assessment of wide scale
predator control stage one approved by Council in October 2013 is nearing
completion. The results of stage one are programmed to be reported to Council
in September / October 2014.
5.3. The transition of approximately
84,000 ha of TBFree New Zealand possum control vector management areas to
ongoing maintenance under HBRC’s Possum Control Area programme.
6. Attached are
the Plant and Animal Pest Operational Plans 2014/15.
Regional Phytosanitary
Pest Management Plan
7. There has been
no requirement for Council to undertake any activities under the Regional
Phytosanitary Pest Management Plan. No changes are proposed to this operational
plan. The Regional Phytosanitary Pest Management Operational Plan is attached.
Decision Making Process
8. Council is
required to make every decision in accordance with Part 6 Sub-Part 1, of the
Local Government Act 2002 (the Act). Staff have assessed the requirements
contained within this section of the Act in relation to this item and have
concluded the following:
8.1. The decision
does not significantly alter the service provision or affect a strategic asset.
8.2. The use of the
special consultative procedure is not prescribed by legislation.
8.3. The decision
does not fall within the definition of Council’s policy on significance.
8.4. Under the
Biosecurity Act 1993 (sec 100B), Council is required to review its operational
plans annually.
8.5. The operational
plans must be consistent with the pest management strategy they are prepared
for, and therefore will only affect persons to an extent that has already been
considered by Council through the process of developing the existing pest
management strategy.
8.6. The decision
is not inconsistent with an existing policy or plan.
8.7. Given the
nature and significance of the issue to be considered and decided, and also the
persons likely to be affected by, or have an interest in the decisions made,
Council can exercise its discretion and make a decision without consulting
directly with the community or others having an interest in the
decision.
|
Recommendations
The Environment and Services Committee recommends that Council:
1. Agrees that the decisions to be made are not significant under the
criteria contained in Council’s adopted policy on significance and that
Council can exercise its discretion under Sections 79(1)(a) and 82(3) of the
Local Government Act 2002 and make decisions on this issue without conferring
directly with the community and persons likely to be affected by or to have
an interest in the decision due to the nature and significance of the issue
to be considered and decided.
2. In accordance with the requirements of the Biosecurity Act 1993
adopts, after the inclusion of any amendments made as a result of the
Committee’s consideration, the:
2.1. Animal Pest Operational Plan 2014/15
2.2. Plant Pest Operational Plan 2014/15
2.3. Phytosanitary Operational Plan 2014/15.
|
|
Campbell Leckie
Manager
Land Services
|
Mike Adye
Group
Manager Asset Management
|
Attachment/s
|
1
|
Animal Pest
Operational Plan 2014 - 15
|
|
|
|
2
|
Plant Pest
Operational Plan 2014 - 15
|
|
|
|
3
|
Phytosanitary
Operational Plan 2014 - 15
|
|
|
|
Animal
Pest Operational Plan 2014 - 15
|
Attachment 1
|

HAWKE’S BAY REGIONAL COUNCIL
operational plan
animal pests
JULY 2014 TO 30 JUNE 2015
|
Animal
Pest Operational Plan 2014 - 15
|
Attachment 1
|
TABLE OF CONTENTS
1.0...... Introduction.. 1
2.0...... Background.. 1
3.0...... Measuring Performance.. 1
4.0...... Animal Pest categories.. 1
5.0...... Regional Control Animal Pests.. 2
Possums.. 2
Rabbits.. 8
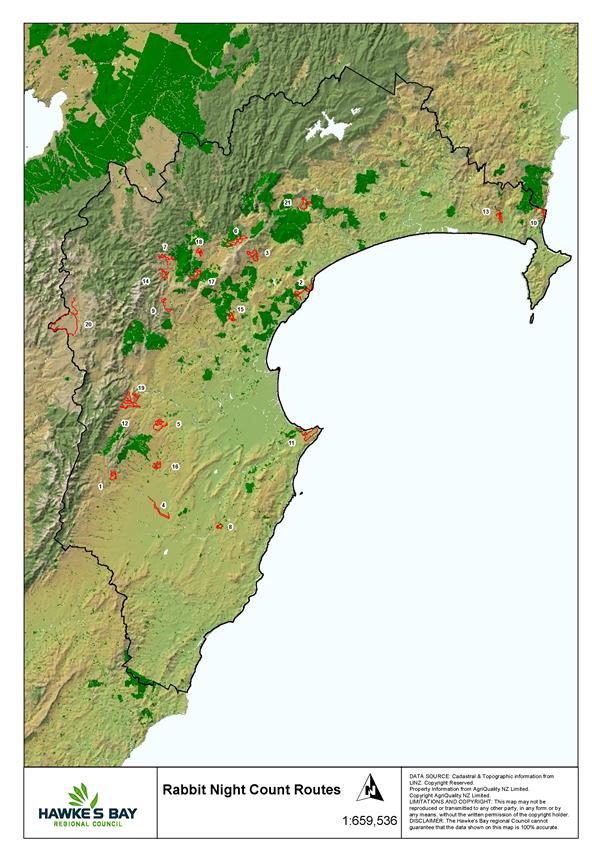
Map 1: Annual
rabbit night count routes.. 10
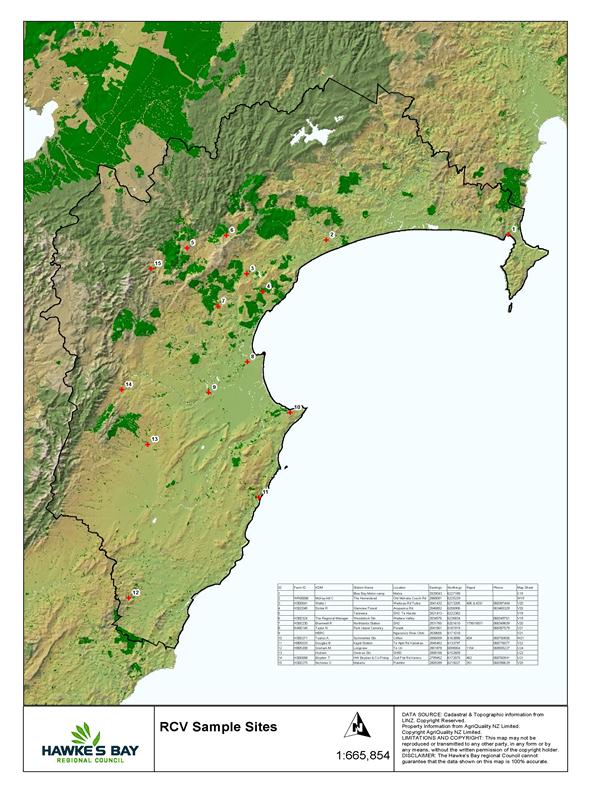
Map 2: Annual RCV
sample sites. 11
Rooks.. 12
Map 3: Aerial
Rook Programme.. 15
Map 4: Extinct
Rookeries.. 16
6.0...... Education.. 17
7.0...... Site Specific Pests.. 17
8.0...... QEII Covenanted Land.. 17
9.0...... Research Initiatives.. 17
10.0.... Advice And Information.. 18
11.0.... Argentine ants.. 18
12.0.... Wide Scale predator (Feral Cat and
Mustellid) Control (Cape to City) 18
13.0.... Regional pest management strategy
review... 18
|
Animal
Pest Operational Plan 2014 - 15
|
Attachment 1
|
1.0 Introduction
This
operational plan sets out how Hawke’s Bay Regional Council will implement
the animal pest objectives for the control of animal pests as set out in the
Hawke’s Bay Regional Pest Management Plan (RPMP). This operational
plan is effective from 1 July 2014 to 30 June 2015.
2.0 Background
Hawke’s
Bay Regional Council is the management agency for the RPMP. As the
management agency, Council is required to prepare an annual operational plan
that sets out how the strategy is to be implemented. Following the
end of each financial year, staff will report to Council on the implementation
of the operational plan.
This
operational plan focuses on the objectives for the control of animal pests as
set out in the RPMP. HBRC’s draft 2014/15 Annual Plan details the
expected level of expenditure by Council in working towards achieving the
objectives set out in the RPMP.
3.0 Measuring
Performance
Staff will
report to Council by 30 November each calendar year on the animal pest control
programmes undertaken over the previous financial year. This report will
indicate the level of achievement towards the RPMP objectives that has been
made during the past year. Specifically the report will cover:
· The programmes
undertaken compared to the approved programme as set out in the Operational
Plan;
· Results from any
trend monitoring undertaken, and an assessment of these results;
· The number of
complaints and enquires received, and an assessment of those complaints and
enquires;
· The education
initiatives undertaken during the year — the number of presentations and
publications or press releases on pest management issues;
· The number of
direction notices issued, the level of compliance with those notices, and any
follow-up activity undertaken;
· The outcomes of
all service delivery operations undertaken;
· All research
initiatives to which contributions have been made during the year; and
· Any cross boundary
issues that arose and how they were resolved.
4.0 Animal Pest
categories
The RPMP
contains two classes of animal pests, Regional Control Animal Pests and Site
Specific Animal Pests.
|
RPMS
Classification
|
Animal
Species
|
|
Regional control
animal pests
|
Possums;
Rabbits; and
Rooks.
|
|
Site specific control
animal pests
|
Feral goats;
Feral deer, Feral pigs;
Mustelids (weasels, ferrets,
and stoats);
Feral cats; and
Rats (Norway and ship rats).
|
The operational
plan details the strategy objective for the control of the animal pests and
provides a brief description of what activities HBRC will undertake to achieve
the stated objective.
5.0 Regional Control
Animal Pests
Regional
control animal pests are pests that have management programmes which cover the
entire region. The main focus of this programme is the control of possums
through the implementation of Self-help Possum Control Areas (PCAs).
Possums
The control of
possums is the major focus of Council’s animal pest control
programme. The strategy objective for possum control is:
That
by 30 June 2016 possum control measures will be operating over 900,000 hectares
of land, ensuring that possum density on that land is below 5% trap catch.
To achieve this objective HBRC established
Possum Control Areas (PCAs) with the support and assistance of land occupiers.
Within PCAs, Council arranged for initial possum control to 3% residual trap
catch (rtc) using pest control contractors. Occupiers of land which has
received such control are now required to maintain possum numbers at 5% rtc.
When an Animal Health Board (AHB) possum
control programme is withdrawn from an area, the Council requires land
occupiers within that area to form a PCA.
Total area of productive land with
low possum numbers is
· PCA’s
507,740
· AHB 400,000
(approximately)
· Remaining productive
land still to be treated 24,998ha’s
This area is made up
of the Nuhaka, Mahanga and Papuni operations within which land occupiers have
declined participating in the PCA programme.
With this exception
HBRC have achieved the possum control objective.
The Animal Health Board (now trading as Tbfree NZ)
have advised HBRC that they will be withdrawing control over 84,716ha of
productive land in the 2014/15 year. Biosecurity staff will visit
each individual property within this area and ensure that occupiers are fully
aware of the following:
· The
relevant content of the RPMP including the requirement for landowners and
occupiers to keep possum numbers below 5% rtc;
· The
process of establishing a PCA;
· The
availability of Council assistance to land occupiers from the Biosecurity
Advisory Team;
· Council’s
approach to compliance including different levels of monitoring; and
· The
consequences of non-compliance, which includes Council undertaking possum
control work to meet the 5% rtc requirement through a contractor; and billing
the occupier for the cost of that control.
Initial
Contact:
Land owners and
occupiers are also briefed on control methods and are encouraged to engage a
contractor to carry out the required maintenance work. Occupiers in PCAs are encouraged
to carry out maintenance in a three-month period in order to gain maximum
benefit from maintenance efforts and reduce the risk of reinvasion from
untreated neighbours within the same PCA.
Subsequent
Contact:
Follow-up
contact regarding maintenance in subsequent years is greatly reduced and will
involve reminder letters and phone calls.
Monitoring:
Trend
monitoring will be carried out over PCAs to provide an indication of the
success of the programme and to provide an early warning of any possible problem
areas. Monitors will be undertaken over individual properties to
determine the success of individuals control methods, and where it is suspected
that the occupier is not meeting the required 5% rtc.
Maintenance
Contractors:
The Advisory
Team will recommend the use of maintenance contractors to land occupiers in
PCAs, audit their work, assist with training opportunities and receive reports
from them regarding the work that they are carrying out on behalf of
landowners.
Boundary
control
Currently the southern
regional boundary is subject to an agreement between Horizons and HBRC
Biosecurity staff for possum control to be undertaken as necessary to
complement HBRC’s PCA programme.
In the 2014/15
financial year staff will undertake discussions with the Gisborne District
Council to put in place a boundary control programme to assist ratepayers in
the northern part of the region on the PCA programme.
Urban pest
management
Possum control
in an urban environment brings a range of biodiversity and amenity benefits.
The Hawkes Bay Urban Biodiversity project commenced with the highly successful
Napier hill possum control operation which was completed in June 2009. Bird
monitoring has shown significant increases within the urban environment in a
range of bird species. Bellbirds have doubled and Tui has trebled in number.
Table 4:
Completed Urban & Semi Urban Projects.
|
Urban Pest
Management Operational Areas
|
Hectares
|
|
Napier Hill
|
282
|
|
Havelock North Stage 1
|
461
|
|
Havelock North Stage 2
|
578
|
|
Havelock North Stage 3
|
630
|
|
Pakipaki
|
3,523
|
|
Mangateretere
|
4,866
|
|
Poraiti Park Island
|
1,146
|
|
Pukekura (Taradale)
|
452
|
|
Karamu (Hastings)
|
1,575
|
|
Total Hectares
|
13,513
|
Table 5: Proposed Semi Urban Pest Management Operational
Areas 2014/2015
|
Urban Pest Management Operational
Areas
|
Hectares
|
|
Otatara (Taradale)
|
345
|
|
Waiohiki (Taradale Fernhill)
|
1,953
|
There is
approximately 8000 ha of urban or semi urban areas in the broader Napier and
Hastings urban area that are still to receive initial control. Control will be
programmed at 300-1000 ha per annum.
Product
Subsidy Scheme:
HBRC provides a
subsidy on a range of possum control products. All land occupiers who are
part of a possum control area will be given the opportunity of training and
advice in the best methods of possum control on their land as part of their
ongoing possum control programme. Advice will cover such things as
potential possum food sources, suitable possum control methods and appropriate
timing of control methods. The subsidised products will be available to all
ratepayers, whether they are in a PCA or not.
Bait
Stations:
A range of bait
stations will be supplied to occupiers in PCAs who engage the services of a
maintenance contractor. Numbers will be limited and contractors are required to
install them to a prescribed protocol and all bait station locations must be
recorded by Global Positioning Systems (GPS) with that data provided to
Council.
QEII:
Landowners who
have a QEII block less than 20 hectares on their property are eligible to
receive free possum bait sufficient to control possums within the QEII area.
For landowners with QEIIs greater than 20 hectares, or where several small
QEIIs are collectively greater than 20 hectares, HBRC arranges and pays for
possum control.
Table 6 shows
those PCAs that will receive initial contact regarding possum maintenance:
Table 6: First Round of Maintenance 2014/2015
|
Self-Help Possum Control
Areas
|
Hectares
|
Maintenance
Time Frames
|
|
Waihua River GS2
|
5,829
|
|
|
Wairoa Buffer GS1 & GS2
|
10,4750
|
|
|
Totals
|
110,579
|
|
The PCAs in
Table 6 have already received the first intensive round of visits from the
Advisory Team and will be contacted reminding them of the need to carry out
maintenance.
Trend
Monitoring
Council
monitors 10% of the PCA programme annually. Of this area monitored no
more than 10% of monitoring lines should exceed a 5% trap catch. Where
lines over 5% are identified, staff visit the land occupier(s) and discuss what
actions they should be taking to reduce possum numbers.
Rabbits
The RPMS long
term goal and strategy objective for rabbits is:
Long
Term Goal: To minimise the adverse effects
of rabbits on the region’s biodiversity and economic prosperity.
Strategy
Objective: To ensure that rabbits are
maintained below level 4, on the McLean Scale.
To achieve
this, the Strategy states that HBRC will:
· Conduct targeted
surveillance of rabbit prone areas;
· Conduct periodic
monitoring of rabbits at known or suspected Rabbit Haemorrhagic Disease (RHD)
areas;
· Provide advice and
education to land occupiers, including occupiers of small blocks, to help them
control rabbits by the most efficient and effective means.
· Monitor for
compliance with the rabbit control rule; and
· At its discretion,
and as set out in an approved management programme, meet up to 50% of the cost
of rabbit control on rateable land where rabbit numbers exceed 4 on the McLean
Scale.
Monitoring
HBRC implements the following monitoring regimes:
(a) Density
Monitoring
Density monitoring will
involve spotlight counts every 1 to 2 years along 21 predetermined rabbit
monitoring lines. These lines have been selected based on historical
spotlight count routes with approximately 80% of the lines in “rabbit
prone areas” and the remainder outside those areas. These lines are
to be counted over two nights using national protocols.
(b) RHD
Monitoring
In accordance with nationally accepted guidelines, HBRC conducts the
sampling of rabbits from at least 15 different sites around the region on a 1
to 2 year basis and tests for RHD. This monitoring will be used to confirm the
presence or absence of RHD, or any levels of immunity that may be building in
the rabbit population. The information gathered from this monitoring will
be entered on the Rabbit Database and will provide information that may be used
to assess the need for greater intervention in rabbit control.
(c) Compliance
Monitoring
If Biosecurity staff receive a complaint or enquiry about a property
with high rabbit numbers then staff or a contractor commissioned by HBRC will
visit the property and carry out an assessment of rabbit numbers. If
densities are found to be greater than 4 on the McLean scale, the occupier may
be issued with a notice of direction under section 122 of the Biosecurity Act
to comply with the RPMP rule which requires landowners to maintain rabbit
populations below 4 on the McLean scale from mid- January to
mid-August. Complaints will only be acted on from mid- January to
mid-August as temporary spikes in the population can occur outside these
times. The RPMP states that HBRC will at its discretion meet up to 50% of
the cost of rabbit control.
Education
Hawke’s
Bay Regional Council will provide advice and education to land occupiers,
including occupiers of small blocks, to encourage them to control rabbits by the
most efficient and effective means. This work will comprise advising and
educating individual land occupiers on ways of minimising the risk of rabbits
impacting on their properties, participating in discussion groups, field days,
preparing pamphlets and using media opportunities to convey relevant
information.
Incentive
Scheme
Where there are incidents of rabbit populations exceeding 4 on the
McLean Scale, the occupier of that land may qualify for financial assistance
from HBRC to assist with the cost of rabbit control. Before any such
assistance is agreed to by HBRC, the occupier will be required to have an
agreed management programme, which will specify the method of rabbit control
and set out a long-term management programme aimed at limiting rabbit
populations in the future. The HBRC contribution to any control work
shall be funded from the rabbit reserve fund.
Service
Delivery
HBRC
do not use staff to conduct any rabbit control operations. The major
focus is on monitoring rabbit populations to ensure rabbit populations are
maintained at or below level four on the McLean Scale, and to provide
information and advice to occupiers. In certain circumstances the incentive
scheme will be used to assist land occupiers with rabbit control, with Council
providing an advisory or contract management role.
Map 1: Rabbit night count
routes.
Map 2: RCV sample sites.
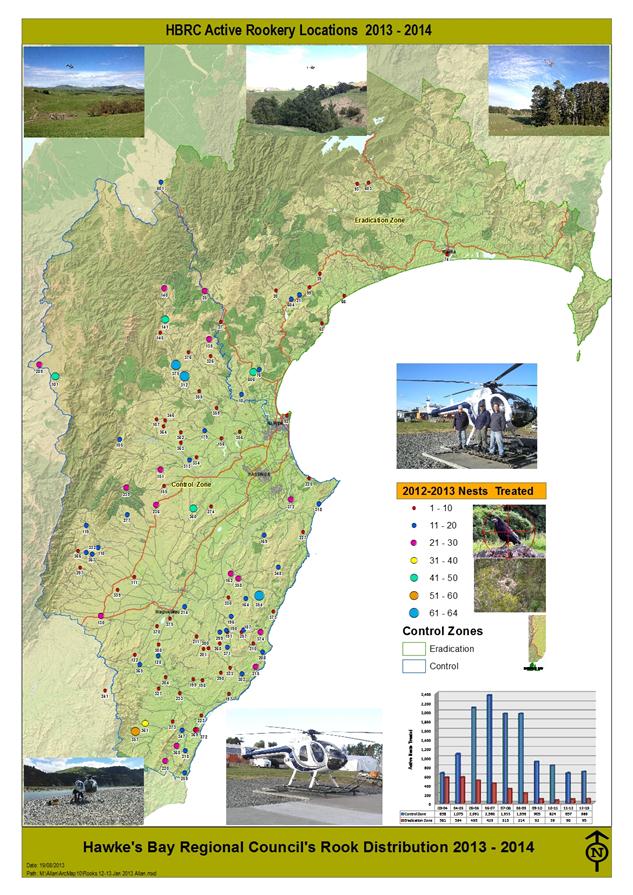
Rooks
The RPMS long
term goal and objective for rooks is:
Long
Term Goal: To eradicate rooks from
Hawke’s Bay.
Strategy
Objective: From north of the ‘rook
clear line’ destroy all known rookeries by 30 June 2016. From south
of the ‘rook clear line’ reduce rook numbers to 4,000 birds by 31
December 2016 and maintain rooks, such that numbers do not exceed that amount
in the future.
The rook clear
line is defined by SH5.
To achieve
this, the Strategy states that:
· Hawke’s Bay
Regional Council will provide information to land occupiers on rook
identification, the potential adverse effects that they cause, who to contact
for rook control, and the risks of inappropriate control.
· North of the ‘rook
clear line’, all known rookeries will be destroyed by Hawke’s Bay
Regional Council by 30 June 2016, subject to climatic conditions being
suitable.
· South of the ‘rook
clear line’, as described in Figure 5, Hawke’s Bay Regional Council
will provide an annual rook control service, when climatic conditions are
suitable, to reduce the population to a maximum of 4,000 birds by 31 December
2016. Rook numbers will then be kept at or below this level.
Service
Delivery
Hawke’s
Bay Regional Council will arrange for all rook control operations.
Eradication
Zone
In the northern
half of the region, it is intended to eradicate rooks by 30 June 2016.
HBRC will
employ suitable contractors to undertake annual control work over all rookeries
in the eradication zone. HBRC will conduct an annual rookery count in
this part of the region to determine the effects of the control contract.
Operations will be co-ordinated with Gisborne District Council in this zone
where low numbers of rooks are present.
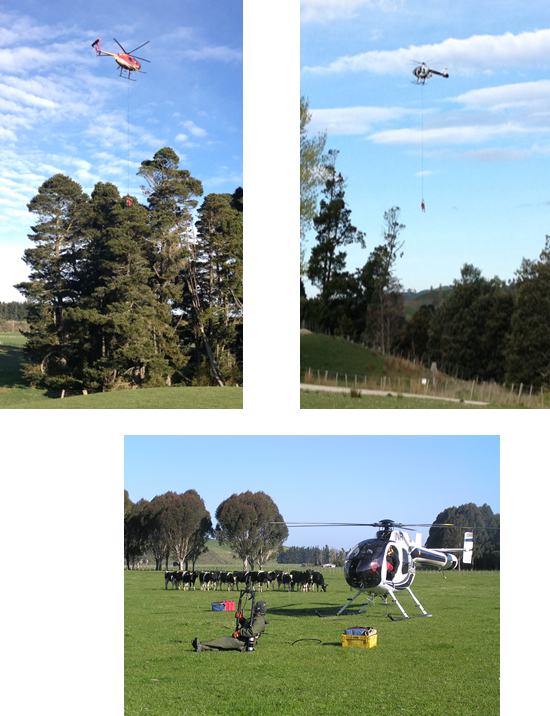
Aerial
Rook Control in Action:
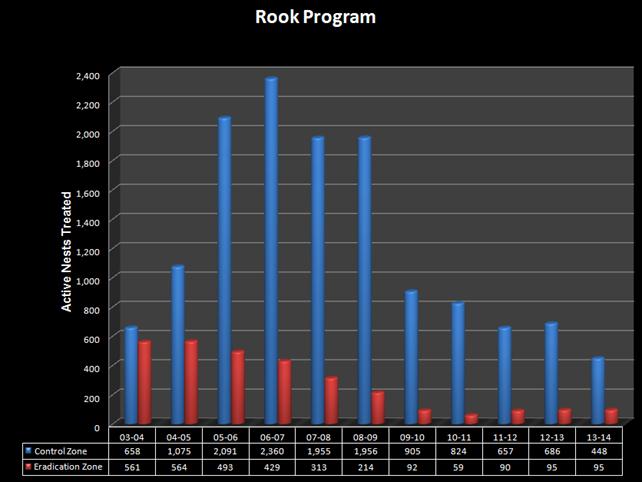 Map 3: Aerial
Rook Programme
Map 3: Aerial
Rook Programme
Note: It is estimated that there are approx 2.5 rooks
for each active nest.
Map 4: Extinct Rookeries
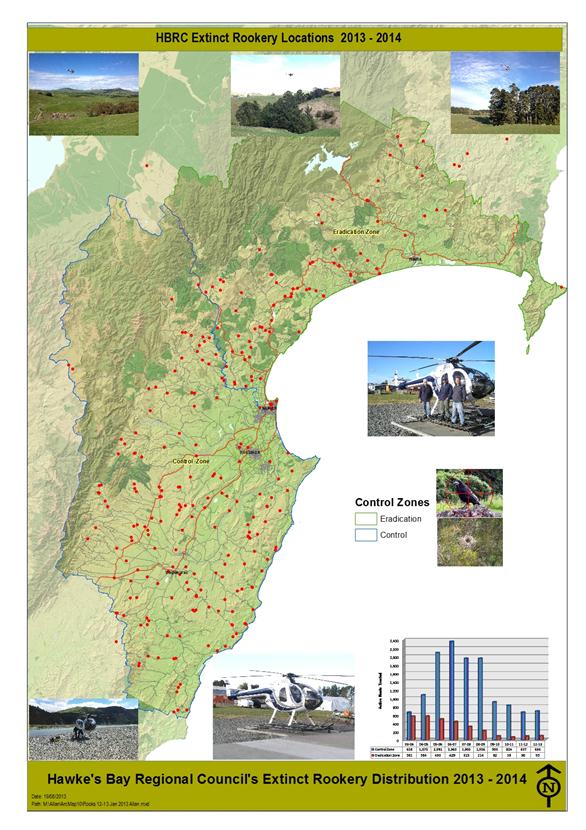
Control Zone
In the southern
half of the region, it is intended to reduce rook numbers to below 4000 by 31
December 2016, and then maintain rook numbers below this level. Council
will arrange for suitable contractors to undertake annual control work.
The main control work will be conducted during spring and summer.
Biosecurity
staff will respond to complaints or enquires about rooks in the Control
Zone. Where rooks appear to be causing damage to agricultural crops or
causing a general nuisance, Council will arrange for control work to be
conducted, if Biosecurity staff believe that a successful result is
possible. This decision will be based on the weather and availability of
other food sources.
6.0 Education
Advice and
information on identifying rooks will be provided to ratepayers on
request. Specific information about rooks, the difficulty of control and
how best to manage rooks will be made available to specific grower
organisations in late winter, to assist farmers identify potential problems and
provide possible solutions before crops are planted.
7.0 Site Specific Pests
Site Specific
Pests will only have management programmes in place in specific sites and under
certain criteria. There are 30 site specific animal pest community groups
currently being supported. The RPMP lists feral goats, feral deer, feral pigs,
mustelids (weasels, ferrets, and stoats), feral cats, and rats (Norway and ship
rats) as Site Specific Animal Pests. Where there are sufficient benefits
to doing so, and upon land user request, HBRC may meet up to 50% of the cost of
control to any land occupier. HBRC will provide “Environment
Topics” on the best methods to control these pests in response to public
enquires.
8.0 QEII Covenanted Land
Site specific
animal pest control on QEII blocks outside PCA’s will be in accordance
with an approved management plan with individual occupiers.
HBRC may
consider treatment of pests on QEII blocks less than 20 hectares or other land
with high ecological value where the conservation values of that land justify
such control. Financial assistance for the control of animal pests on
covenanted land smaller than 20 hectares may be available on request from the
land occupier. Before any assistance is provided HBRC must assess the
land, and a management plan be agreed between the occupier and HBRC.
9.0 Research
Initiatives
There are a
range of research initiatives under way as part of HBRC’s approved stage
one for wide scale predator control. These include chew card operational
maximisation, minimum predator control area modelling, benefits from reducing
toxoplasmosis, farmer WSPC value proposition / uptake and “green
credentials” for farm products where farm management delivers
environmental outcomes.
Bird count
monitoring
Monitoring has
been completed on one urban site (Napier hill) and one rural site (Kuru range)
to assess native bird numbers after possum control taking place. Follow up
monitoring will continue to assess the changes in bird numbers over time.
10.0 Advice And
Information
Public inquires
regarding the control of animal pests listed in the RPMP will be dealt with as
noted in this Plan. For inquires regarding control of magpies, HBRC has a
limited number of traps which it can make available to occupiers to conduct
their own control. For all other animals of concern information will be
provided to assist people undertake their own control. This information
may be by way of sending them Environment Topics or providing people with a
list of pest control contractors who could assist them control the animal of
concern.
11.0 Argentine ants
HBRC is currently
undertaking surveillance activities to access the extent of the argentine ant
infestation in the region. In addition to thispublic awareness of this
pest is being built and best practice control and guidelines provided to
occupiers who may want to undertake control.
12.0 Wide Scale predator
Control (Cat and Mustelid) - Cape to City
HBRC is currently involved in a multi agency initiative. The Cape to
City project is a community based initiative with strong backing from several
agencies including HBRC, DOC, Landcare Research and land users.
The project is ambitious and hopes to achieve positive biodiversity
and social outcomes over 26,655 hectares encompassing both DOC reserves and
private farmland. The vision of this project is to have “native species
co-exist with human habitation, food production and recreation.”
Longer term, the HBRC’s
main objectives in regard to Wide Scale predator control are to:
- Identify a pest control regime that
substantially reduces the current cost of top predator (cats and mustelids)
control within a rural landscape containing significant bush fragments
- Provide additional protection to important
habitat or sites of regional significance and native species that will benefit
from top predator control.
- Support and empower the local community to
set and attain achievable biodiversity protection goals.
Stage one which is to assess the
feasibility of the project will be completed by November 2014. Subject to
council approval and funding stage two (predator initial control) will commence
later in the 14/15 financial year.
13.0 Regional pest
management Plan review
The RPMP
2013 must be review before 2018. It is likely however that a National
Policy Direction prepared in accordance with the Biosecurity Law Reform Act
2013, will require the Plan to be reviewed before this date.
A Councillor
working party has been established and will consider what changes could be made
to HBRC’s current approach to animal pest management early in the 2014/15
financial year to enable some public comment to be received prior the development
of the draft Long term plan 2015/25, and to consider the adequacy of current
funding arrangements which provide for the implementation of pest management
activities.
.
|
Animal
Pest Operational Plan 2014 - 15
|
Attachment 1
|
Appendix 1: Possum Control Area
Self Help Agreement

Possum
Control Area
Self
Help Agreement
1) The Hawke’s Bay Regional Council will, in
accordance with the Hawkes Bay Regional Plant Pest and Animal Pest Management
Plan, carry out initial possum control operations to reduce possum levels to 3%
residual trap catch on your property.
2) I, the occupier will:
· Maintain
possum numbers at or below 5% residual trap catch in accordance with the rule
in the Hawkes Bay Regional Plant Pest and Animal Pest Management Plan.
3) The Hawke’s Bay Regional Council will, in
accordance with the Hawkes Bay Regional Pest Management Plan, provide an
advisory service to occupiers to assist in maintaining possum numbers at or
below 5% residual trap catch once initial control has been carried out.
4) Please indicate preferred maintenance option
□ Will
use a contractor to carry out maintenance
□ Will carry out own maintenance
(Must meet HSNO Act requirements)
|
Occupier
|
|
Owner
|
|
|
|
First Name:
|
|
First Name:
|
|
|
|
Surname:
|
|
Surname:
|
|
|
|
Property
Address:
|
|
Property
Address:
|
|
|
|
|
|
|
|
|
|
|
|
|
|
|
|
Postal
Address:
|
|
Postal Address:
|
|
|
|
|
|
|
|
|
|
|
|
|
|
|
|
Phone Number:
|
|
Phone Number:
|
|
|
|
Mobile Phone:
|
|
Mobile Phone:
|
|
|
|
j Key
Decision Maker
|
j Key
Decision Maker
|
|
Signature:
|
|
|
|
|
|
(Occupier)
|
|
(Owner)
|
|
|
|
|
|
|
|
(Date)
|
|
(Date)
|
|
|
|
|
|
|
(Hawkes
Bay Regional Council)
|
|
(Date)
|
|
|
|
|
|
|
|
|
Animal
Pest Operational Plan 2014 - 15
|
Attachment 1
|
Hawke’s Bay Regional
Pest
Management Plan
POSSUM
CONTROL AREAS
Enforcement
Where
a land occupier does not adhere to the requirements of this Plan, an authorised
person may issue directions for the control or eradication of possums under
section 122 of the Biosecurity Act.
On default, Hawke’s Bay Regional Council may carry
out work and recover the costs from the land occupier under sections 128 and
129 of the Biosecurity Act.
(a) Previously
controlled areas
When an Animal
Health Board (AHB) possum control programme is withdrawn from an area, HBRC
require the land occupiers within that area to form a Possum Control Area.
Where a Possum Control Area is formed HBRC will either use relevant recent
monitoring data or where that is not available, monitor the area to determine
the possum densities. If required, HBRC will undertake any initial possum
control work necessary to achieve possum densities at or below 5% trap catch
and the land occupiers within the Possum Control Area will then be bound by the
possum control rule in the Plan. Where land occupiers do not wish to establish
a Possum Control Area, HBRC will use its powers under Section 122 of the
Biosecurity Act to direct the land occupiers to maintain possum densities at or
below 5% trap catch.
Rule: Possum (Trichosurus vulpecula)
Every land occupier whose property has had initial possum
control work carried out as part of either a Hawke’s Bay Regional Council
or Animal Health Board programme since 1 July 1999, such that possum densities
over his or her land are below 5% trap catch, at the completion of that initial
control or at the time of withdrawal of AHB, shall maintain possum densities on
that land at or below 5% trap catch in accordance with Possum Control Areas
– section (c) Maintenance. A breach of this rule is an offence under
section 154 of the Biosecurity Act 1993.
|
Plant Pest Operational Plan
2014 - 15
|
Attachment 2
|

HAWKE’S BAY REGIONAL COUNCIL
operational plan
plant pests
july 2014 to 30 june 2015
|
Plant
Pest Operational Plan 2014 - 15
|
Attachment 2
|
TABLE OF CONTENTS
1.0 Introduction.
2.0 Background.
3.0 Measuring
performance.
4.0 Total control
plant pests.
5.0 Boundary control
plant pests.
6.0 Biodiversity
plants.
7.0 DIDYMO..
8.0 Biological control
of plant pests.
9.0 General advice and
information.
10.0 Press releases and
general information.
11.0 Monitoring methods
for Total Control plant pests.
12.0 High Risk and QE11
Areas.
13.0 National Pest
Plant Accord.
14.0 Management
Programmes
15.0 Enforcement.
16.0 Subsidy scheme.
17.0 Site Specific.
|
Plant
Pest Operational Plan 2014 - 15
|
Attachment 2
|
1.0 Introduction
This
operational plan sets out how HBRC will implement the objectives for the
control of plant pests as set out in the Hawke’s Bay Regional Pest
Management Plan (RPMP). This operational plan is effective from 1 July
2014 to 30 June 2015.
2.0 Background
HBRC is the
management agency for the RPMP. As the management agency HBRC is required
to prepare an operational plan that sets out how the Plan is to be
implemented. At the end of each financial year, staff will report to
Council on the implementation of the operational plan.
This
operational plan focuses on the methods of implementing the objectives for the
control of plant pests as set out in the RPMP. HBRC’s annual plan details
the expected level of expenditure by HBRC in working towards achieving the
objectives set out in the RPMP. The operational plan details the methods
used to achieve those objectives.
3.0 Measuring performance
Staff will
report to Council by 30 November each calendar year on the plant pest control
programmes undertaken over the previous financial year through the annual
report. This report will indicate the level of achievement towards the
RPMP objectives that has been made during the past year. Specifically the
report will cover:
· The programmes undertaken compared to the proposed programme as set
out in the Operational Plan;
· A summary of all subsidy fund applications received and the outcome
of all subsidised work;
· The education initiatives undertaken during the year and the number
of presentations and publications or press releases on pests management issues;
· The number of direction notices issued, the level of compliance with
those notices, and any follow-up activity undertaken;
· The outcomes of all service delivery operations undertaken;
· The results of biological control research and monitoring, and the
number of bio-control releases undertaken;
· Any cross boundary issues that arose and how they were resolved.
4.0 Total control plant pests
The RPMP
defines a Total Control plant pest as one that is of limited distribution in
the region, and the long-term goal is its eventual eradication. Seventeen
plants are listed as Total Control plant pests. The RPMP places these
into two categories, Service Delivery and Occupier Responsibility.
For each of
these plant categories the operational plan provides a brief description of
what activities HBRC will undertake to achieve the RPMP objectives.
(i) Table
1: Plant Pests
|
Total
Control (Service Delivery)
|
Management
Regime
|
|
African feather grass
|
HBRC will at its discretion
control every known infestation before seeds reach maturity
|
|
Goats rue
|
HBRC will at its discretion
control every known infestation before seeds reach maturity
|
|
Nassella tussock
|
HBRC will at its discretion
control every known infestation before seeds reach maturity
|
|
Phragmites
|
In accordance with the contract
between HBRC and Ministry of Primary Industries, HBRC will control every
known infestation of this plant annually
|
|
Privet
|
HBRC has altered the delivery of
the privet programme to service delivery by a contractor. The contractor
should be able to control Privet on most properties within at least six weeks
of a legitimate complaint.
However, this does not apply to
Privet found in rural areas. In these situations, Occupiers are responsible
and may qualify for a subsidy under the incentive scheme. The Standard
Operating Procedures for managing Privet are attached to this paper.
(Appendix 1)
|
|
Spiny emex
|
HBRC will at its discretion
control every known infestation before seeds reach maturity
|
|
White edged nightshade
|
HBRC will at its discretion
control every known infestation before seeds reach maturity
|
|
Yellow water lily
|
HBRC will at its discretion
control every known infestation before seeds reach maturity
|
|
Total
Control (Occupier Responsibility)
|
Management
Regime
|
|
Apple of Sodom
|
Occupiers are responsible for the
control of Apple of Sodom on their land, and may qualify for a subsidy under
the incentive scheme. HBRC will at its discretion control some known
infestations before seeds reach maturity where it is practical to do so
|
|
Australian sedge
|
Occupiers are responsible for the
control of Australian sedge on their land, and may qualify for a subsidy
under the incentive scheme. HBRC will at its discretion control some known
infestations before seeds reach maturity where it is practical to do so
|
|
Chilean needle grass
|
Occupiers are responsible for the
control of Chilean Needle grass on their land, and may qualify for a subsidy
under the incentive scheme. Chilean needle grass has been identified in
summer dry areas of the region — west of Napier, and on land at
Maraekakaho, Poukawa, Waipawa, Wakarara, Omakere and Porangahau. There
are infestations on river berm land and roadsides. Biosecurity staff
will arrange for the control of Chilean needle grass on public land. On
private land occupiers are required to control Chilean needle grass in
accordance with their agreed management programmes. HBRC will at its
discretion control some known infestations before seeds reach maturity where
it is practical to do so.
HBRC will support Environment
Canterbury in raising awareness of CNG within New Zealand and to help achieve
milestones in the Sustainable Farming Fund CNG Project.
HBRC will encourage the
use of the new control tool, Flupropanate as required. HBRC will assist
Marlborough and Canterbury Regional Councils in undertaking further
Flupropanate trials to provide residue and efficacy data to the Environmental
Protection Agency
|
|
Cotton thistle
|
Occupiers are responsible for the
control of Cotton thistle on their land, and may qualify for a subsidy under
the incentive scheme. HBRC will at its discretion control some known
infestations before seeds reach maturity where it is practical to do so
|
|
Japanese honeysuckle
|
Occupiers are responsible for the
control of Japanese Honeysuckle on their land in the designated control area,
and may qualify for a subsidy under the incentive scheme. HBRC will at its
discretion control some known infestations before seeds reach maturity where
it is practical to do so
|
|
Pinus contorta
|
Occupiers are responsible for the
control of Pinus contorta on their land, and may qualify for a subsidy under
the incentive scheme. HBRC will at its discretion control some known
infestations before seeds reach maturity where it is practical to do so
HBRC will continue to work with
its partners in Nature Central to achieve operational efficiencies and to
target strategic infestations
HBRC will continue the clearing
of Pinus contorta on multiple ownership land in the Rangitaiki area as
resources allow.
|
|
Old man’s beard
|
The RPMP
states that North of SH 5 Old man’s beard is not as widespread as it is
South of this area, and it is therefore still worthwhile to require occupiers
to continue to control OMB north of SH5.
South of SH5
staff will respond to complaints.
South of SH5 Council will still
encourage the control of OMB but will not enforce compliance. Landusers
below SH5 will still be eligible for the incentive scheme for the control of
OMB. HBRC will at its discretion control some known infestations before seeds
reach maturity where it is practical to do so
There are
major infestations along the river-berms, especially in Central Hawke’s
Bay and the lower reaches of the Ngaruroro River. This land is
administered as part of the Upper Tukituki Flood Control Scheme and the
Heretaunga Plains Flood Control Scheme respectively.
|
|
Saffron thistle
|
Occupiers are responsible for the
control of Saffron thistle on their land, and may qualify for a subsidy under
the incentive scheme. HBRC will at its discretion control some known
infestations before seeds reach maturity where it is practical to do so
|
|
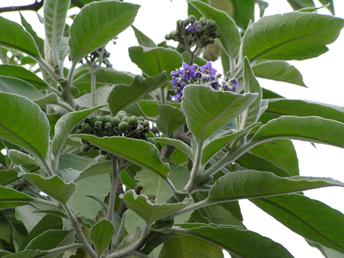
Woolly nightshade
|
Occupiers are responsible for the
control of Woolly nightshade on their land, and may qualify for a subsidy
under the incentive scheme. HBRC will at its discretion control some known
infestations before seeds reach maturity where it is practical to do so
|
5.0 Boundary control plant pests
The RPMP
defines a Boundary Control plant pest as one that is abundant in suitable habitats
in the region. The long-term goal is to prevent these plant pests
spreading to new areas or neighbouring properties. The RPMP requires land
occupiers to keep their property boundary free of the Boundary Control plant
pest, if it is not present within a defined distance on their neighbour’s
property.
Biosecurity
staff will respond to a complaint from an affected occupier regarding the
control of Boundary Control plant pests. On getting a complaint, a
Biosecurity Officer will visit the property of the complainant and adjoining
property, to confirm the identity of the plant, and what if any control needs
to be carried out. Should control work be necessary the occupier of the
property on which the infestation originates will be asked to carry out the necessary
control work. A follow up inspection will be carried out to ensure work has
been completed and if necessary, enforcement action will be undertaken.
|
Boundary
Control
|
Management
Regime
|
|
Bathurst bur
|
Occupiers are responsible for the
control of Bathurst bur on their land. Where necessary all plants need to be
cleared within 5m of the boundary of adjoining clear land.
|
|
Blackberry
|
Occupiers are responsible for the
control of Blackberry on their land. Where necessary all plants need to be
cleared within 10m of the boundary of adjoining clear land.
|
|
Gorse
|
Occupiers are responsible for the
control of Gorse on their land. Where necessary all plants need to be cleared
within 10m of the boundary of adjoining clear land.
|
|
Nodding thistle
|
Occupiers are responsible for the
control of Nodding thistle on their land. Where necessary all plants need to
be cleared within 20m of the boundary of adjoining clear land.
|
|
Ragwort
|
Occupiers are responsible for the
control of Ragwort on their land. Where necessary all plants need to be
cleared within 20m of the boundary of adjoining clear land.
|
|
Variegated thistle
|
Occupiers are responsible for the
control of Variegated thistle on their land. Where necessary all plants need
to be cleared within 5m of the boundary of adjoining clear land.
|
|
Plant
Pest Operational Plan 2014 - 15
|
Attachment 2
|
6.0 Biodiversity plants
These are
plants that have a negative ecological effect, and staff believe that they can
be successfully controlled, at some sites, without being included in the RPMP.
The cost for control of these plants will be borne by HBRC. Plants that
presently fall into this category are African love grass, Boneseed, Climbing
spindleberry, Cathedral bells, Darwins barberry, Blue passion flower, Asiatic
knotweed, Giant knotweed, Banana passionfruit, Cotoneaster, Himalayan honeysuckle,
Mothplant, Pennisetum villosum, Purple ragwort and Chilean rhubarb.
7.0 DIDYMO
A Didymo advocate will be employed by HBRC over the months of
November 2014 – February 2015 to carry out Didymo advocacy on
Hawke’s Bay freshwater waterways, subject to a $20,000 grant from the
Ministry of Primary Industries which will fully fund these activities. They
will also be required to liaise with any clubs using these waterways, visit
sports stores, camping grounds and information centres and to contact tourist providers
associated with freshwater activities. . Any organizers of activities involving
freshwater waterway use will be contacted throughout the year to ensure any
equipment in contact with water will be “Checked, Cleaned, Dried”
8.0 Biological control of plant pests
HBRC continues
to support research into biological control of plant pests. HBRC’s
priorities for further research into bio-control agents during the life of the
RPMP are Chilean needle grass, Nassella tussock, and Japanese
honeysuckle. Biological agents will be purchased for the control of
Broom and Californian thistle. Biological control agents for Ragwort, Nodding
thistle, and Gorse are widespread and active in the region.
If an occupier
requests a bio-control agent, Biosecurity staff will investigate the property
to ensure the bio-control agents are not already present and active on their
land. If the Bio-control agents are required, HBRC will arrange for their
release, if they are available.
9.0 General advice and information
Biosecurity
staff will provide general advice on appropriate methods to control plant
pests. The information is intended to assist occupiers meet their
obligations under the RPMP. Where chemical control is advocated, then
safe use, storage, and disposal of all herbicides will be promoted. Other
methods of control may include mechanical methods, grubbing, stock management,
or biological control.
Biosecurity
staff will also assist with the general identification of plants, and provide
information and education material about poisonous plants.
Information and
advice on plant pests may also be provided at field days and A&P shows.
10.0 Press releases and general
information
During the
financial year, Biosecurity staff will produce press releases targeting
specific plant pests. The press releases will provide information to
occupiers to allow them to identify the plants concerned and encourage them to
report its location. The plant pests to be targeted and likely timing of
the press release are indicated in the table below:
|
Plant
pest
|
Time of
press release
|
|
Chilean needle
grass
|
November 2014
|
|
Didymo
|
January 2015
|
|
Saffron
thistle
|
January 2015
|
|
Woolly
nightshade
|
April 2015
|
|
Mothplant
|
March 2015
|
|
Phragmites
|
March 2015
|
|
|
|
Press releases
relating to other Total Control plant pests may be issued during the year
depending on interest or growing conditions. In addition, the discovery of any
new infestations will be reported if appropriate. Publicity material will be
prepared using Weedbusters principles. Weedbusters is a national weed awareness
programme involving the Department of Conservation and regional councils. HBRC
is part of the Weedbusters network.
11.0 Monitoring methods for Total
Control plant pests
Staff are undertaking a monitoring programme for total control plant
pests using the following guidelines. The objective is to develop a
better picture of the effects of control over the duration of the
strategy. This monitoring programme will use an estimated 20 days of
staff resource and can be completed within existing programmes.
· The two main techniques to be used will be random transects of
random properties and plant counts. These are to be done before any
control work for the season has been started for that plant pest. They will
also be done at the same time each year.
· Transects will vary from 10-100mts in length (depending on terrain)
and 1mt wide. All plants that fall within the transect will be counted and the
length calculated on GPS. This will represent a portion of a hectare.
· Where multiple transects are used then these will be added together
to find the overall number of plants per hectare.
· Where it is practical, plant counts will be done on selected
properties of some Total Control Plants which are more than a very limited
infestation. These will be done on the same properties each year. Biosecurity
staff believe plant counts give a better guide than transects.
· For Total Control Plants of very limited infestation, a plant count
will be done to get totals for all of Hawke’s Bay.
· These methods will be used on known infestations only as at 1 July
2006.
12.0 High Risk and QE11 Areas
High-risk areas
are defined as picnic sites; old and current dump sites, old homestead sites,
recreational areas, rivers, beaches, areas close to a Total Control plant infestation,
and native bush areas. These areas are to be inspected as time allows.
13.0 National Pest Plant Accord
The Ministry of
Primary Industries manages the National Pest Plant Accord, which has declared
132 plants as unwanted organisms under the Biosecurity Act. HBRC has
agreed to be responsible for ensuring that people selling plants are conforming
to the requirements of the Act, and not selling or propagating these plants.
All plant pests and unwanted organisms are banned from sale and propagation under
the Biosecurity Act. All retail outlets that are known to sell plants
will be visited at least once per year, to ensure that they are not selling any
plant pests listed in the RPMP or any plants on the Pest Plant Accord.
14.0 Management Programmes
Biosecurity
staff will negotiate and agree a management programme with Transit NZ and
Kiwirail. The management programme will specify how plant pests on their land
will be managed.
Management
programmes for the control of most Total Control plant pests will be negotiated
and agreed with private land occupiers during surveillance and compliance
monitoring visits.
Biosecurity
staff will negotiate and agree a management programme with the Asset Management
section of Council for the control of specific Total Control plant pests that
occur on land managed for flood control. The management programme will
specify how the Asset Management section will control these plant pests.
15.0 Enforcement
Should a
Biosecurity officer observe that an occupier is either in breach of their
agreed management programme, or a rule in the RPMP then that officer will issue
a direction under section 122 of the Biosecurity Act requiring them to comply
with the Plan. If after the reasonable period of time indicated in the
direction notice, the required work has not been completed then Biosecurity
staff will provide the occupier with written notice that HBRC will arrange for
the necessary control work to be carried out. The occupier will meet the
cost of this control work.
16.0 Subsidy scheme
The incentive
scheme subsidy budget for the 2014/15 financial year is $50,000. It is
intended that the incentive scheme will be mainly targeted at the following
plant pests: Chilean needle grass, Japanese honeysuckle, Old
man’s beard, Cotton thistle and Saffron thistle.
The standard
operating procedures detailing how the incentive scheme will be operated are
attached to the operational plan (Appendix 2).
17.0 Site Specific
Please refer to the Animal Pest operational plan for information on
site specific control.
Appendix 1: Standard Operating Procedures For The
Control Of Privet
(a) Introduction
These
procedures set out in detail how Biosecurity staff will enforce the Privet rule
in the Regional Pest Management Plan.
(b) Comment
Biosecurity staff will
only respond to valid complaints[1].
An occupier with privet would then be advised of the effects of privet and the
privet rule. Complaints will be responded to in the following order of
priority:
1st priority
– Privet is in complainant’s/ enquirer’s property or on a
neighbouring property.
2nd
priority – privet is not in a neighbouring property but is within 100
metres of the complainant’s/enquirer’s house, or adjacent to or on
public land.
3rd
priority – all other complaints/enquiries.
(c) Dealing with
Privet hedges
Where a valid
complaint is about a privet hedge, Biosecurity staff will:
Advise the occupier of
the property (or properties if the hedge is a boundary fence) about the effects
of privet flowers.
The occupier(s) will
agree to a management programme, which would require them to keep the hedge
trimmed so as to stop flowering. If the occupier will not trim the hedge
Biosecurity staff will arrange a contractor to trim the hedge at Councils cost.
|
Plant
Pest Operational Plan 2014 - 15
|
Attachment 2
|
Appendix
2: Plant Pest Subsidy Scheme Standard Operating Procedures
Standard
Operating Procedures for Implementing The Plant Pest Subsidy Scheme
(a) Introduction
These
procedures set out in detail how Biosecurity staff will operate the plant pest
subsidy scheme that is provided for in the Regional Pest Management Plan.
(b) Comments
Plant pests
having a serious economic impact on farming operations provide their own
incentive to occupiers to control them. The subsidy scheme is therefore
only available to assist with the control of those plant pests which are either
very expensive to control, or whose density has become so low that they no
longer cause a significant economic impact to the occupier of the land.
HBRC provides the control work for some total control plant pests with limited
distribution. Those plants for which HBRC conducts the control measures
are not eligible for subsidy scheme assistance.
The following
table lists the plant pests that subsidy scheme money is available for, and
indicates the rationale for the subsidy scheme.
|
Plant pest
|
Limited
distribution
|
Difficult
to control
|
Non-economic
benefits
|
|
Apple of Sodom
|
√
|
|
|
|
Australian
sedge
|
√
|
|
|
|
Chilean needle
grass
|
|
√
|
|
|
Cotton thistle
|
√
|
|
|
|
Japanese
honeysuckle
|
|
√
|
|
|
Old
man’s beard
|
|
√
|
|
|
Pinus contorta
|
|
√
|
|
|
Privet
|
|
|
√
|
|
Saffron
thistle
|
√
|
|
|
|
Woolly
nightshade
|
√
|
|
√
|
|
|
|
|
|
|
|
|
|
|
|
Plant
Pest Operational Plan 2014 - 15
|
Attachment 2
|
Organisation of Subsidy Budget
The budget will be split up and allocated towards the control of
each plant pest. The Plant Pest Team Leader will determine the actual
amount of money allocated to each plant pest each year, based on the size of
infestations and the range of management programmes operating.
This will ensure that subsidy scheme money is available during the
year, so that effective control can be conducted at the most appropriate time
for each plant pest.
An indicative split of the total budget for each total control plant
pest is provided in the following table.
|
1-5% of
budget
|
5-10% of
budget
|
>10% of
budget
|
|
Privet
|
Australian
sedge
|
Old
man’s beard
|
|
Cotton thistle
|
|
Pinus contorta
|
|
Japanese
honeysuckle
|
|
Saffron
thistle
|
|
Apple of Sodom
|
|
Chilean needle
grass
|
Type of
Assistance
Where there is a very limited distribution of the plant pest then
the subsidy scheme will be made available to the occupier of that land to
assist with the destruction of all the plants each year, until no more
emerge. Biosecurity staff will continue to
monitor these sites.
As set out in the Strategy, subsidy scheme money can meet up to 50%
of the cost of the work required, with a maximum contribution of $3,000 being
paid except for Chilean needle grass. However this amount also does not
apply to Privet hedges and Privet in rural areas, only a maximum contribution
of $500 will be paid. Privet in a rural area is defined by being outside a 50km
speed zone area. In the case of Chilean needle grass, 100% of the cost of the
chemical Taskforce and 50% of the cost of contractor application will be met
through the subsidy scheme. The maximum contribution for Chilean needle grass
will still be $3,000.
Japanese honeysuckle subsidy scheme money is available for the few
private land occupiers within the control areas listed in the RPMP.
Old man’s beard subsidy scheme is only available for land
occupiers on private rateable land. The majority of infestations of Old
Man’s Beard occur along rivers (controlled by the Council); in DoC
reserves; or along the State highways (where Transit NZ has responsibility for
control). The control of Old Man’s Beard on Council land, DoC land
and along the State highway will be managed via the agreed management
programmes.
The subsidy scheme will therefore be used to assist occupiers to
remove Old Man’s Beard from their properties. It is expected that
the majority of subsidy scheme money for Old Man’s Beard will be spent in
the Wairoa district, as this is where control operations
have been carried out for a number of years.
Accessing
Subsidy Scheme Money
No subsidy scheme money will be provided to any occupier unless
there is an agreed management programme, which clearly specifies what action
the occupier is to carry out. Before Council will pay an occupier any
subsidy scheme money the following steps must be taken:
· The plant pest must be clearly identified. The occupier must
be clearly informed of what work is expected and the timeframe Council expects
work to be completed by.
· The application form for an incentive scheme grant must be completed
by the occupier and returned to Council.
· The Biosecurity Team Leader Plant Pests will determine whether the
application is approved or not. All applicants will be informed of the
outcome of their application for financial assistance.
· Any work completed before the application has been approved will not
qualify for financial assistance.
· A Biosecurity team member will inspect the property to ensure that
the work has been completed to the agreed standard.
· Payment of the agreed amount will only be made once Council is
satisfied that work has been completed to the agreed standard.
Appendix
3:
GUIDELINES
FOR THE CONTROL OF CHILEAN NEEDLE GRASS (effective 1 July 2004)
· Boundary clearance to be 5mts on ALL properties
except where dense on both sides of boundary, then do nothing.
· If dense one side and medium to sparse on the other side of
boundary, clear 5mts both sides.
· Boundary clearance of 5mts is a MINIMUM only. If necessary
a larger boundary clearance distance or Total control can be enforced.
· Particular attention is to be placed on properties that have road
frontages. These to be cleared back 5mts in ALL cases.
· Should a property owner not comply then we have the option to
prosecute.
· Where grazing is used as a management tool, all satellite plants
left within the control area must be removed or sprayed before they set hard
seed.
· Management options can include grazing, mowing, spot spray, weed
eater or grubbing.
· ALL properties WILL have a current management plan.
· Boundary control distances are a MINIMUM only and
Total control is still an option if needed.
· Plant densities are, Dense= 5+/m2, Medium= 2-4/m2 and Low= 0-1/m2
|
Phytosanitary Operational
Plan 2014 - 15
|
Attachment 3
|
HAWKE’S BAY REGIONAL COUNCIL
operational plan
Regional Phytosanitary Pest Management
july 2014 to 30 june 2015
|
Phytosanitary
Operational Plan 2014 - 15
|
Attachment 3
|
TABLE OF CONTENTS
1.0 Introduction
2.0 Background
3.0 Measuring
Performance
4.0 Phytosanitary
Pests to be Controlled
4.1 Apple black spot (Venturia
inaequalis)
4.2 Codling moth (Cydia pomonella)
4.3 European Canker (Nectria
galligena)
4.4 Fireblight (Erwinia
amylovora)
4.5 Lightbrown apple moth (Epiphyas
postvittana)
5.0 Flowchart -
implementing the Operational Plan
6.0 Occupiers
Responsibilities
7.0 Hawke’s Bay
Fruit Growers Responsibility
8.0 Hawke’s Bay
Regional Council Responsibilities
9.0 Management Options
for Controlling Phytosanitary Pests
10.0 Enforcement
|
Phytosanitary
Operational Plan 2014 - 15
|
Attachment 3
|
1.0 Introduction
This Operational Plan focuses on the methods for implementing the
control of Phytosanitary Pests as set out in the Regional Phytosanitary Pest
Management Plan.
Hawke’s Bay Fruit Growers Association is responsible for
monitoring of the Regional Phytosanitary Pest Management Plan. They will be the
initial facilitator in responding to enquiries, and ensuring monitoring
information is gathered in response to landowners’ complaints.
The
Hawke’s Bay Regional Council will assist Hawke’s Bay Fruit
Grower’s Association to achieve a satisfactory conclusion when their
involvement and discussions have failed to resolve the issue.
2.0 Background
HBRC will be the management agency for the Regional Phytosanitary
Pest Management Plan. As the management agency HBRC is required to
prepare an Operational Plan that sets out how the Plan is to be implemented.
The Operational Plan will be reviewed annually. At the end of each
financial year, Pipfruit New Zealand, and Hawke’s Bay Fruit Growers
Association in consultation with HBRC will report to council on the
implementation of the Operational Plan.
3.0 Measuring
Performance
HBRC staff will report to Council by 30 November each calendar
year. These reports will document the performance of HBRC in achieving
the objectives of this Regional Photosanitary Pest Management Plan including
whether:
· A complaints and enquiries register has been maintained, and follow
up action has been taken as appropriate;
· Any phytosantitary pest management control has been undertaken;
· The cost of implementing this strategy.
4.0 Phytosanitary Pests to be
Controlled
4.1 Apple black spot (Venturia
inaequalis)
Description
Apple black
spot is a fungal disease, often referred to as apple scab outside of New
Zealand. It is a wet weather disease, and rainy and humid conditions
provide ideal conditions for infection. Even the smallest black spot is
unacceptable for export.
Rule for
Control
Every
occupier of an unmanaged pipfruit production site in Hawke’s Bay is
required to control Apple black spot (Venturia inaequalis) on their
land from the presence of green tips until fruit harvest by applying Apple
black spot fungicides on a calendar basis as per the fungicide label
instructions.
A breach of
this rule is an offence under section 154 of the Biosecurity Act 1993.
Fruit so
treated will not be available for export sale.
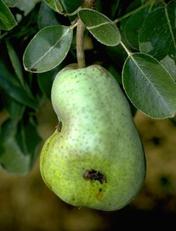
4.2 Codling moth (Cydia pomonella)
Description
Codling moth is
a small speckled, grey moth, hosted by apple, pear and walnut trees. The larvae
of Codling moth burrows into fruit leaving small holes. The Frass
(droppings) indicates the presence of the larva. The moth over-winters as
a dormant caterpillar in a cocoon under the bark of the tree or in the soil.
Rule
for Control
Every
occupier of an unmanaged pipfruit production site in Hawke’s Bay is
required to control Codling moth (Cydia pomonella) on their land if five
(5) or more Codling moths are caught in any one Codling moth pheromone trap
during any calendar week on their land.
A breach of
the rule is an offence under the section 154 of the Biosecurity Act 1993.
Occupiers of
pipfruit production sites are therefore required to monitor for and
control Codling moth.
4.3 European Canker (Nectria galligena)
Description
Initial
symptoms of European canker are a small sunken area around a bud, leaf
scar, or at the base of a small dead shoot or open wound. Concentric
rings of a canker growth then appear. The sunken area increases in size
with the centre becoming flaky, eventually it will girdle the stem and
shoots above the canker die.
Rule
for control
Every
occupier of an unmanaged pipfruit production site in Hawke’s Bay is
required to control European Canker (Nectria galligena) by inspecting all
pipfruit trees on their land at least once during winter (May to August), and
removing and burning all pipfruit trees showing any presence of European Canker.
A breach in
this rule is an offence under section 154 of the Biosecurity Act 1993.
Occupiers of
the pipfruit production sites are therefore required to monitor for and control
European Canker.
4.4 Fireblight (Erwinia amylovora)
Description
Blossom infection
can result in “shepherds crook” of the shoot. Blossom appear
water soaked then turn brown and finally black. Young fruit if
infected turn brown, then black, wilt then drop off.
Rule for
control
Every
occupier of an unmanaged pipfruit production site in Hawke’s Bay is
required to control Fireblight (Erwinia amylovora) on their land during the
pipfruit bloom period (from pink to petal fall) by applying Fireblight
bactericides as per the bactericide label instructions.
A breach in
this rule is an offence under section 154 of the Biosecurity Act 1993.
Occupiers of
pipfruit production sites are therefore required to monitor for and control
Fireblight.
4.5 Lightbrown apple moth (Leafroller) (Epiphyas
postvittana)
Description
Lightbrown
apple moth adults are variable in colour and may be confused with other leaf
rollers. Males have a forewing length of 6-10 mm with a light brown area
at the base distinguishable from a much darker, redbrown area at the
tip. The latter may be absent, the moth appearing uniformly light brown,
as in the females, with only a slightly darker oblique markings distinguishing
the area at the tip of the wing. Females have a forewing length of 7-13
mm, and colour varies from a uniform light brown, with almost no distinguishing
markings.
Larval first
instar has a dark brown head, while all other instars have a light fawn head
and prothoracic plate (plate behind head). Overwintering larva are darker,
while the mature larva is medium green with a darker green central stripe and
two side stripes. Pupae are at first green, but become medium brown after
rapid hardening.
Rule for
control
Every
occupier of an unmanaged pipfruit production site in Hawke’s Bay is
required to control Lightbrown apple moth (Leafroller) (Epiphyas postvittana)
on their land once thirty (30) Lightbrown apple moths are caught in any one
Lightbrown apple moth pheromone trap on their land from 15th
December until fruit harvest.
A breach in
this rule is an offence under section 154 of the Biosecurity Act 1993.
Occupiers of
pipfruit production sites are therefore required to monitor for and control
Lightbrown apple moth.
5.0 Flowchart
- implementing the Operational Plan


|
|
|
|
|
|
|
|
|
|
Affected party monitors increased
management inputs
and reports issue to local independent
third party (eg HBFGA).
|
|
|
|
 |
|
|
|
|
|
 |
|
Independent third party advises
affected grower on what needs to be monitored and what data will be needed
|
|
Crop dependent monitoring advice
checklist
|
|


|
|
|
|
|
|
|
|
|
|
|
|
|
|
|
|
Monitoring over next month shows clear
difference in management inputs to previous 3 years data from affected
production site
|
|
|
|
Independent third party advises
landowner that production site meets the criteria as an ‘abandoned
production site’ and gives 14 calendar days notice to reach a
satisfactory conclusion with affected neighbours. At the end of the
14 calendar days the case will be handed to the HBRC for action under their
Regional Plan.
|
|
|
|
|
|
 |
|
|
|
|
Independent third party assesses
checklist and agrees with affected party regarding impact and
notifies HBRC of the issue by fully supported letter
|
|
|
|
|
|
 |
|
|
 |
|
|
|
6.0 Occupiers
Responsibilities
All occupiers of pipfruit production sites are expected to monitor
for and control phytosanitary pests over their property.
Following an increase in presence of pests the affected occupier
will contact the occupier of the adjacent unmanaged pipfruit production site to
seek agreement that they will control phytosanitary pests on their land in
accordance with the Regional Phytosanitary Pest Management Plan management
regime.
When the adjacent pipfruit production site occupier does not agree
to control phytosanitary pests, the affected occupier may contact Hawke’s
Bay Fruit Grower’s Association advising them of the problem when
monitoring confirms:
· There is a clear difference in the management inputs required to
control Phytosanitary pests compared to the previous three years.
· Or monitoring results indicate that the Phytosanitary pest outbreak
is more severe along the boundary with the adjacent unmanaged pipfruit
production site.
7.0 Hawke’s Bay Fruit
Growers Responsibility
Hawke’s Bay Fruit Growers Association has the following
responsibilities:
· Determining whether the adjacent pipfruit production site occupier
has been affected by an increase of the presence of Phytosanitary Pests.
· Assessing monitoring data on the affected managed pipfruit
production site to confirm there is a clear difference in the management inputs
required to control the phytosanitary pests compared to the previous three years,
and/or that the pest outbreak is more severe along the boundary with the
adjacent unmanaged pipfruit production site.
· Advising the occupier of the unmanaged pipfruit production site that
a complaint has been received regarding their inaction to control phytosanitary
pests on the their land, and that Hawke’s Bay Fruit Growers Association
are now investigating the issue in accordance with this operational plan and
the Hawke’s Bay Regional Phytosanitary Pest Management Plan.
· Investigating and seeking agreement for the control of phytosanitary
pests.
· Advising the occupier of the unmanaged pipfruit production site(s),
that they are deemed to be an exacerbator of phytosanitary pests.
· Assisting occupiers to reach an agreement regarding the control of
phytosanitary pests within 14 days, and providing technical support to monitor
that the necessary control measures are undertaken.
8.0 Hawke’s
Bay Regional Council Responsibilities
HBRC will direct and enforce the provisions of the Regional
Phytosanitary Pest Management Plan when all steps have been taken to reach a
satisfactory agreement by an independent third party (eg Hawke’s Bay
Fruit Grower’s Association), and a satisfactory conclusion has not been
achieved.
9.0 Management
Options for Controlling Phytosanitary Pests
There are three management options proposed for the control of
Phytosanitary Pests:
· The occupier of the pipfruit production site manage at their cost
the phytosanitary pests on their land in accordance with current pipfruit
industry pest management best practice for either organic or integrated
fruit production.
· The occupier of an unmanaged pipfruit production site allows an
affected adjacent pipfruit production site to manage their pipfruit production
site in a manner that reduces the level of risk. Costs of control are to
be agreed between the two occupiers.
· The occupier of an unmanaged pipfruit production site, at no cost to
adjacent managed pipfruit sites, removes their pip fruit trees.
10.0 Enforcement
When a satisfactory conclusion cannot be reached between occupiers
HBRC will consider a detailed report prepared by Hawke’s Bay Fruit
Growers Association on the unmanaged pipfruit production site.
When a landowner does not adhere to the requirements of the Regional
Phytosanitary Pest Management Plan, an authorised person may issue directions
for the control of Phytosanitary Pests under Section 122 (Notice of Direction)
of the Biosecurity Act 1993.
On default, HBRC may arrange for the work to be carried out and
recover the costs from the land occupier under sections 128 of the Biosecurity
Act 1993 (Notice of Intention to Act on Default) and section 129 of the
Biosecurity Act 1993 (Liens).
Criteria for enforcement is set out
in each rule for each Phytosanitary Pest. Notices will be set out as per
the rule in the Regional Phytosanitary Pest Management Plan.
.
HAWKE’S BAY REGIONAL COUNCIL
Environment
and Services Committee
Wednesday 11 June 2014
SUBJECT: River Gravel Update
Reason for Report
1. This report is to update the Environment and Services Committee on
progress with the Review of Riverbed Gravel Management. This is review being
managed by the Engineering Section as part of the Gravel Management Project
(Project 369).
Background
2. Gravel extraction forms an integral part of ongoing flood protection
to both the Heretaunga and Ruataniwha Plains scheme areas, with gravel being
extracted such that the flood capacity of the schemes is maintained, and the
potential for the rivers to undermine edge protection is minimised.
3. The Hawke’s Bay river-borne gravel resource is increasingly
under pressure for construction use particularly in the proximity of the
Heretaunga Plains where the transport cost to the main centres is significantly
less than gravel sourced further away.
4. The majority of the easily accessible rivers are now effectively
managed through the process of targeted gravel extraction. However gravel
stocks are limited in many of the areas closest to the market and as a result
pressure is placed on gravel extractors to win their resource at greater
distances (eg Ruataniwha Plains rivers) from their markets putting pressure on
their competitiveness.
5. With the understandable reluctance to source gravel from further
afield due to the high transport costs there is a risk that gravel management
for flood control purposes in these areas will become an expense on scheme
ratepayers that may be unaffordable.
6. In addition there is increasing concern being expressed by the
public that river gravel extraction is aggravating coastal erosion,
particularly in Haumoana and Te Awanga. More research being undertaken to fully
understand and manage the potential effects.
7. The Asset Management section believes it is imperative for Council
to have an effective framework for the ongoing management of the gravel
resource within the region, supported by robust science and processes. This was
the subject of a paper to Council on 09 November 2010 where a scoping report
was presented that outlined the issues and proposed a way forward.
8. The scoping report identified the issues associated with the current
management of the region’s river bed gravel resource that when completed
would:
8.1. Improve Council’s understanding of riverbed gravel transport
and the impact of gravel extraction on flood protection works and coastal
processes.
8.2. Enable Council to review its management regime for assessing the
gravel resource and for managing its extraction.
8.3. Examine the future demand for the resource working with the
extraction industry.
8.4. Inform co-management discussions with regard to the gravel resource
and its management with Treaty Claimant Groups.
9. The scoping report adopted by Council included a prioritised
programme of work that could be accommodated in a 6 year time span. This
2013/2014 financial year is the third year of the programme. Completion is
programmed for 2016/2017.
10. In order
to carry out the review and obtain a wide view of community concerns and ideas
on the gravel resource a number of meetings have been arranged, (and are
ongoing) to discuss the issues. A separate meeting was held with the key people
in the gravel supply industry to hear their views as they have a different
perspective on the resource than other interested parties. These meetings with
the industry are continuing as they are a vital part of gravel
management.
11. A meeting
has been held with DOC, Fish & Game and the TLA’s. A hui was widely
advertised and held at Kohupatiki Marae to inform and discuss with hapu
associated with the rivers the issues relating to gravel management. In
addition a number of specialists working in the fields of coastal and river
gravel processes have been interviewed for their expert knowledge.
12. HBRC has
a number of responsibilities that have a direct bearing on the management of
gravel resources in the region:
12.1. It has
the jurisdiction to manage and authorise activities in riverbeds
12.2. It has
the jurisdiction to manage and authorise activities in the coastal area
12.3. It has
responsibility for flood control and protection of assets.
13. There is
an ongoing demand for gravel and aggregate for a range of activities in the
roading and construction industry. There is a need to balance the allocation of
gravel between supply demand and the need to maintain the flood capacity of
flood protection schemes. This balance should also take account of the
environmental effects of gravel extraction, Māori views and the river
ecology.
14. Extensive
flood protection schemes have been established throughout the Heretaunga Plains
and the Ruataniwha Plains, managed by HBRC. These schemes are currently
designed and constructed to a standard (1% Annual Exceedance Probability,
AEP). This standard is maintained through maintenance of the channel
carrying capacity and design riverbed levels.
15. The main
population areas and therefore gravel demand are on the Heretaunga Plains.
However the gravel resources are spread between the Northern area, Heretaunga
Plains and Ruataniwha Plains. As noted above there is a tension between the
gravel supply and the gravel demand areas due to the extra transport costs.
This has implications for HBRC’s management of the flood protection
schemes as too high a cost to extract the gravel may result in gravel
extractors preferring to establish land based sources. HBRC currently has little
ability to manage these land based areas, although land based mining is covered
in the Hastings District Plan.
16. There is
uncertainty over the potential effects of riverbed gravel extraction,
specifically in relation to the following aspects:
16.1. Long-term
riverbed morphology
16.2. Long-term
riverbed gravel supply from the high country
16.3. Sediment
supply to the coast and the effect on coastal stability
16.4. Riverbed
ecology and biodiversity
16.5. Sites
and issues of significance to tangata whenua.
17. The
review includes work to investigate and/or quantify these effects and determine
what further work, if any is needed to provide HBRC with robust information
necessary to manage the gravel resource as well as confirming or otherwise
whether the current management regime and processes are appropriate for long
term sustainability. The information will improve the understanding of gravel
transport and therefore also enhance the understanding for other interested
parties.
18. The
review is divided into 13 separate but related issues that require
investigation. The order presented in the table below begins with the highest
priority first and some of the later issues are dependent on the outcome and/or
data from the earlier studies. Rough order costs to carry out the work have
been assigned to each issue. In addition there are annual costs associated with
Tangata Whenua involvement and a steering group.
|
|
Issue
|
Total Indicative cost
|
Stage
|
Current
Status
|
|
1
|
Hydrological Review
|
$40,000
|
Stage 1
|
Complete
|
|
2
|
Gravel Supply & Transport
|
$110,000
|
In Progress
|
|
3
|
Gravel Resource Inventory
|
$60,000
|
|
|
4
|
Implications for Flood Protection
|
$40,000
|
|
|
5
|
Gravel Demand & Forecast
|
$30,000
|
|
|
6
|
Gravel Monitoring & Resource Availability
|
$40,000
|
|
|
7
|
In-stream Ecological Effects
|
$75,000
|
Stage 2
|
In Progress
|
|
8
|
Riverbed Birds & Flora
|
$45,000
|
In Progress
|
|
9
|
Tangata Whenua Values
|
$20,000
|
Ongoing
|
|
10
|
Effectiveness of Beach-raking
|
$40,000
|
Stage 2
|
Complete
|
|
11
|
RMA Issues
|
$30,000
|
Stage 3 (RMA issues sooner)
|
|
|
12
|
Allocation & Financial Mechanisms
|
$30,000
|
|
|
13
|
Riverbed Gravel Management Plan
|
$75,000
|
Final Stage
|
|
|
|
Total
|
$635,000
|
|
|
|
|
Tangata Whenua consultation
|
$10,000/year
|
|
Ongoing
|
|
|
Steering Group
|
$10,000/year
|
|
Ongoing
|
19. The terms
of reference for the review were to consider the costs spread over a number of
years at about $100,000 per year. This of course is subject to a suitable
source of funding and could be expanded or reduced to suit. At present 6 years
is the time period considered. A work programme has been prepared to enable each
of these issues to be studied and reported on in a final report by 2017.
20. Possible
options for funding the work were discussed with gravel extractors and Council.
The option chosen to fund the work is from increased Resource Management
charges currently levied on a per cubic metre rate on all river bed gravel
extracted. With the previous level of extraction averaging approximately
600,000 cubic metres per annum this required an increase of the levy charged
from $0.60/m3 to approximately $0.80/m3.
21. In the
past year gravel extraction from the region’s rivers has reduced
significantly as the market demand has dropped off. There are two consequences
of this if the trend continues;
21.1. The
lesser consequence is that funding to continue the research will need to be
topped up from another source or the programme will need to be extended. This
latter action is least preferred owing to the urgent nature of some of the
issues.
21.2. The
more serious consequence with reduced demand is that gravel build-up in the
rivers will be a problem for the flood protection system. Already some river
reaches in the Ruataniwha Plains (e.g. Makaretu River) have excessive gravel
deposits causing problems.
22. Staff
will give a short presentation to Councillors outlining the research done to
date, highlighting some of the more pertinent findings and provide some comment
on future work.
Decision Making
Process
23. This
paper is to update Council on a programme of work that has already been
approved and as such no decisions are required to be made. Likewise there
are no recommendations to consider.
|
Recommendation
1. That the Environment and Services
Committee receives the report “Gravel Resource Review: Update”.
|
|
Gary Clode
Manager
Engineering
|
Mike Adye
Group
Manager
Asset
Management
|
Attachment/s
There are no
attachments for this report.
HAWKE’S BAY REGIONAL
COUNCIL
Environment
and Services Committee
Wednesday 11 June 2014
SUBJECT: Update on Open Space Area Plans
Reason for Report
1. To provide an update on HBRC’s Individual Park Plan review
process covering Pekapeka, Pakowhai, Waitangi and Tutira Regional Parks.
2. To update Council on potential park developments.
Background
HBRC Regional Park
Network Plan
3. At its meeting on 20 November 2013 the Environment and Services
Committee (E&SC) adopted the Regional Park Network Plan (RPNP) as the
guiding document for managing and improving HBRC’s open space / regional
park assets.
4. The RPNP recognises the evolution of HBRC open space from areas of
limited public use (often acquired for reasons other than to become parks), to
areas of increasing public use and community value. The RPNP identifies some of
our open space as regional parks, reflecting what they have become and
acknowledging the need to manage them collectively.
5. By HBRC definition a regional park is “an area of land
recognized for its natural, cultural & heritage and recreation value, or
other reason, and under administration of the HBRC”.
Individual Park Plan Review
6. A requirement of the RPNP is to draft 10 year Individual Park Plans
to guide the management, maintenance and development of each regional park
asset.
7. At the November
2013 meeting it was identified that a program of management plan review had
commenced and that Council endorsement for these plans would be sought during
the 2014 calendar year.
8. This paper
provides an update on where the Individual Park Plan review process is at.
Open
Spaces Projects and Funding
9. On 6 March 2008 Council resolved to establish a $7.5m borrowing
facility for the purposes of funding projects identified in Council’s
Open Space programme and also to fund capital projects of regional significance
under the Community Facilities Fund criteria.
10. There is
approximately $800,000 available in that borrowing facility.
11. At the
November 2013 meeting, Council agreed not to commit that money to additional
projects. This money could then be available to fund an expansion of the
Regional Parks Network or improvements within existing open space areas.
Discussion
Individual Park Plan Components
12. Individual
Park Plans consist of a narrative, asset management spreadsheet, recreation
activity summary and status (encouraged, limited, discouraged), existing
inventory and concept development plans. The narrative includes a brief
overview of the park as well as detail on the park values, vision and
management objectives. The asset management spreadsheet sets out management,
maintenance and proposed capital development items and associated costs over a
10 year period. These are to be prioritised on the basis of community
interest/response, need and added value.
13. The
intent of the concept development plans is to provide vision for each park to
enable individual initiatives within each park to be developed consistently and
in alignment with the overarching Regional Parks Network Plan. It is not
the intent that all or any proposed developments are to occur in any one
financial year. Developments are proposed on the basis that capital works may
be completed
13.1. when
funds are allocated by Council or
13.2. when
funds are raised through external sources.
14. The
fundamental point is that when development does occur it is completed to an
approved park plan.
Individual Park Plan Review
Progress
15. Individual
Park Plans are in draft for Pekapeka, Pakowhai and
Waitangi Regional Parks.
16. Consultation
has been undertaken on the draft plan for Pekapeka Wetland including kaitiaki
from Pakipaki, Forest and Bird (Hastings - Havelock North), Department of
Conservation, Fish and Game New Zealand and Kiwirail. These groups are
generally supportive of the project and draft plan.
17. Public
and visitors to the wetland have been invited to provide comment and feedback
on the wetland restoration and the draft plan. While formal feedback has been
limited (2 responses), what has been received is supportive. The most common
informal comment or request is for the installation of a toilet and rubbish bin
at the interpretation site.
18. Cost
estimates have yet to be completed.
19. The
drafting of an Individual Park Plan for Tutira Regional Park is on hold. Preliminary scoping work was
undertaken, however, on request and advice from the Maungaharuru Tangitu Trust
(MTT), drafting is on hold until such a time MTT can appropriately engage in
the project. This is likely to be September 2014. Initially, staff were looking
to include Lake Tutira within the “Tutira Regional Park” boundary.
This is now unlikely due to the complexities of land ownership surrounding Lake
Tutira.
20. The table
below provides an overview of the Individual Park Plan review process covering plan drafting, consultation, capital
development & maintenance costing, Council approval and plan
implementation.
21. At the meeting staff will
deliver a presentation outlining some of the key issues associated with each
Park and the draft vision for each of them
|
Regional Park
|
Draft IPP
|
Consultation
|
Costing / funding
|
Council Approval
|
Implementation
|
|
Pekapeka Wetland
|
95% complete
|
complete
|
Due September 2014
|
8th October 2014
|
TBC
|
|
Pakowhai Country Park
|
80% complete
|
July / August 2014
|
Due September 2014
|
8th October 2014
|
TBC
|
|
Waitangi Wetlands
|
80% complete
|
July / August 2014
|
Due September 2014
|
8th October 2014
|
TBC
|
|
Tutira Country Park
|
20% complete
|
Late 2014
|
Late 2014
|
TBC
|
TBC
|
Park Maintenance Requirement
22. Funding priority should be given to maintaining and protecting
existing park assets. This includes:
22.1. maintaining park infrastructure (pathways, tables, seats, signage,
fencing, carparks)
22.2. plant and animal pest control
22.3. community engagement provision
22.4. maintaining plantings (restorative, conservation, investment,
enhancement, amenity)
22.5. providing for capital expenditure to protect, promote and enhance
park values
funding
depreciation of the park assets
Potential
Park Development
23. Potential
park developments are based on historical management objectives, ecological
monitoring recommendations, anecdotal feedback and consultation where
completed.
24. The table
below identifies key potential developments.
|
Regional Park
|
Key Potential Developments
|
|
Pekapeka Wetland
|
- Land acquisition &
enhancement (Waireporepo Pa, northern carpark, southern secondary arrival
area)
- Island Pa site enhancement
- Toilet installation
- Western wetland enhancement
(community provision)
- Northern walkway & carpark
(loop track)
- Native planting program around
perimeter of wetland (community provision)
- Update / replace / install
signage (interpretive and gateway)
- Open water and bittern habitat
enhancement (northern end)
- Resource consent for aerial
application of selective herbicide
- Landscape predator control
program
|
|
Pakowhai Country Park
|
- Park expansion / land aquisition
- Walkway bridge abutment
protection
- Installation of stream crossing
structure for dogs near bridge approaches
- Service track relocation
- Lake creation near the old
Raupare bridge
- Entrance and parking
reconfiguration in conjunction with HDC
- Foot bridge (Raupare Stream)
- Planting Program (community
provision)
- Update interpretive and gateway
signage
- Establishment of dog agility
area and infrastructure
- Pedestrian overbridge (over
Pakowhai Rd linking Ruahapia with the park)
|
|
Waitangi Wetlands
|
- Upgrade / replace vehicle
barriers onto the beach at East Clive
- Upgrade Richmond Rd primary
arrival area (carpark)
- Upgrade Ferry Rd secondary
arrival area
- Upgrade Awatoto primary arrival
area
- Coastal erosion control planting
program (Muddy Creek wetland protection)
- Amenity and restoration planting
program (community provision)
- Signage installation (gateway,
interpretive and educational)
|
|
Tutira Country Park
|
- To be confirmed
|
Decision Making
Process
25. Council is required to
make a decision in accordance with the requirements of the Local Government Act
2002 (the Act). Staff have assessed the requirements contained in Part 6
Sub Part 1 of the Act in relation to this item and have concluded the
following:
25.1. The decision does not significantly alter the service provision or
affect a strategic asset.
25.2. The use of the special consultative procedure is not prescribed by
legislation.
25.3. The decision does not fall within the definition of Council’s
policy on significance.
25.4. No persons affected by this decision.
25.5. Options will be considered as part of the development of each
individual park plan.
25.6. The decision is not inconsistent with an existing policy or plan.
25.7. Given the nature and significance of the issue to be considered and
decided, and also the persons likely to be affected by, or have an interest in
the decisions made, Council can exercise its discretion and make a decision
without consulting directly with the community or others having an interest in
the decision.
|
Recommendation
26. That the Environment and Services
Committee receives the report.
27. That the Environment and Services Committee recommends that
Council:
27.1. Agrees
that the decisions to be made are not significant under the criteria
contained in Council’s adopted policy on significance and that Council
can exercise its discretion under Sections 79(1)(a) and 82(3) of the Local
Government Act 2002 and make decisions on this issue without conferring
directly with the community and persons likely to be affected by or to have
an interest in the decision due to the nature and
significance of the issue to be considered and decided.
27.2. Notes
that the development of Individual Park Plans for Pakowhai, Pekapeka and
Waitangi Regional Park areas is well advanced and that the final plans are
programmed to be brought to Council for endorsement following public consultation
later in 2014.
27.3. Notes
that the development of an Individual Park Plan for Tutira will be progressed
in conjunction with Maungaharuru – Tangitu Trust later in 2014.
|
|
Steve Cave
Manager,
Open Space Development
|
Mike Adye
Group
Manager Asset Management
|
Attachment/s
There are no
attachments for this report.
HAWKE’S BAY REGIONAL
COUNCIL
Environment
and Services Committee
Wednesday 11 June 2014
SUBJECT: Science Report Updates
Reason
for Report
1. Hawke’s Bay Regional Council (HBRC) has a responsibility under
the RMA, the New Zealand Coastal Policy Statement and the Regional Coastal
Environment Plan to safeguard the integrity, functioning and resilience of the
coastal environment and to sustain its ecosystems.
2. These reports and the associated summaries will update Council
regarding the outcomes of an ongoing targeted investigation into the extent of
saltwater influence in the region’s estuaries. The report also outlines
the conclusions of a review of relevant data into the state of the Ahuriri
Estuary for contact recreation and shellfish gathering purposes.
The Tukituki, Waitangi
and Ahuriri: Assessment of the extent of saltwater influence in Hawke’s
Bay estuaries. RM 14/01 – Plan No: 4577.
3. This report describes the mapping of the extent of saltwater
influence in the Tukituki, Waitangi and Ahuriri estuaries.
4. Electrical conductivity was used as a proxy for salinity. Following
preliminary surveys of conductivity gradients in each of the estuaries using
field meters, Odyssey conductivity loggers collecting continuous data were
deployed. These deployments coincided with periods of low flows and spring
tides, which were expected to be the periods of the maximum extent of saltwater
influence.
5. The data collected by the loggers was then interpolated using ArcGIS
to generate maps of the salinity gradient through the estuaries.
6. The data collected by the Odyssey loggers was correlated against
median flow and tide height. At most of the sites tide height was strongly
correlated with salinity (the higher the tide the higher the salinity). River
flow often had a relationship (the higher the flow the lower the salinity) with
salinity, especially at those sites furthest from the mouth of the estuary.
7. The maximum extent of saltwater influence from the sea was:
7.1. 1 km into the Tukituki estuary
7.2. 4.1 km into the Clive River arm of the Waitangi estuary
7.3. 5.1 km into the Ngarururo River arm of the Waitangi Estuary
7.4. 2.9 km into the Tutaekuri River arm of the Waitangi Estuary
7.5. 9.2 km into the Ahuriri Estuary.
8. Since the
writing of this report, the extent of saltwater influence into the Porongahau,
Mohaka and Nuhaka estuaries has been established. The Odyssey loggers are
currently deployed in the Waikari estuary. These estuaries will be the subject
of a future report.
Ahuriri Estuary:
Contact Recreation and Food Gathering Review. EMT13/10 – Plan Number
4483.
9. The Ahuriri Estuary, Napier is a significant ecological and
recreational resource for the Hawke’s Bay community. It is recognised as
a nationally significant wildlife and fisheries habitat, and a nationally
important example of tectonic processes. Natural and human-induced changes to
the estuary over the last century have considerably changed the estuary form.
10. As one of
the few sheltered tidal lagoon estuaries within Hawke’s Bay, Pandora Pond
provides for a number of recreational opportunities including swimming,
kayaking, sailing, and waka ama. These activities can however be compromised by
the presence of faecal contaminants that have the potential to cause illness.
Faecal indicator organisms sampled within the Ahuriri Estuary may stem from
stormwater, overland flow or accidental sewage discharges.
11. The
estuary is currently classified as being in ‘Fair’ condition
(grades range from Very Good to Very Poor) in terms of contact recreation, due
to the influence of inflows with elevated bacterial concentrations –
these may increase the risk of illness to recreational users of the estuary.
Other metrics, such as clarity and algal growth do not indicate impairment of
recreational opportunities as a consequence of nuisance algal growths.
12. The
Ahuriri Estuary also provides food gathering opportunities, most commonly
cockle and various species of flounder. Current information suggests that
shellfish gathered from the estuary may be unsuitable for human consumption
because of elevated faecal indicator bacteria concentrations.
13. If the
community regards the water and sediment quality within the estuary as impaired
for contact recreation and food-gathering purposes, techniques such as faecal
source tracking may assist in identifying the sources of faecal contamination
in targeting appropriate management strategies.
Decision
Making Process
14. Council is required to
make a decision in accordance with Part 6 Sub-Part 1, of the Local Government
Act 2002 (the Act). Staff have assessed the requirements contained within
this section of the Act in relation to this item and have concluded that, as
this report is for information only and no decision is to be made, the decision
making provisions of the Local Government Act 2002 do not apply.
|
Recommendation
1. That the Environment and Services
Committee receives the reports “The Tukituki, Waitangi and
Ahuriri: Assessment of the Extent of Saltwater Influence in
Hawke’s Bay Estuaries” and “Ahuriri
Estuary: Contact Recreation and Food Gathering Review”.
|
|
Oliver Wade
Environmental
Scientist WQ&E
|
Anna Madarasz-Smith
Senior
Scientist, Water Quality & Ecology
|
|
Stephen Swabey
Manager,
Science
|
Iain Maxwell
Group
Manager
Resource
Management
|
Attachment/s
|
1
|
The Tukituki,
Waitangi and Ahuriri: Assessment of the Extent of Saltwater Influence in
Hawke's Bay Estuaries
|
|
|
|
2
|
Ahuriri
Estuary: Contact Recreation and Food Gathering Review
|
|
|
|
The
Tukituki, Waitangi and Ahuriri: Assessment of the Extent of Saltwater
Influence in Hawke's Bay Estuaries
|
Attachment 1
|
The
Tukituki, Waitangi and Ahuriri
Assessment of extent of
saltwater influence into Hawke's Bay estuaries
November 2013
HBRC Report No. RM 14/01 HBRC Plan
No. 4577
The Tukituki, Waitangi and
Ahuriri
Assessment
of extent of saltwater influence into Hawke's Bay estuaries
November 2013
HBRC Report No. RM 14/01 HBRC Plan No.
4577
Prepared
By:
Oliver Wade
Scientist –
Coastal Quality

Reviewed By:
Neale Hudson
Approved By:
Iain Maxwell

|
The
Tukituki, Waitangi and Ahuriri: Assessment of the Extent of Saltwater
Influence in Hawke's Bay Estuaries
|
Attachment 1
|
Contents
Executive summary
1 Introduction
1.1 Project objectives
1.2 Statutory context
2 Methodology
2.1 Site selection
2.2 Deployment
2.3 Data analysis
3 Tukituki Estuary
3.1 Results
4 Waitangi Estuary
4.1 Clive River
4.2 Ngarururo River
4.3 Tutaekuri River
5 Ahuriri Estuary
5.1 Ahuriri Estuary Results
6 Discussion
7 Conclusion
8 Acknowledgements
9 References
Appendix A Laboratory test results
Tables
Table 2‑1: The Venice Classification System.
Table 3-1: Spearman correlation coefficients
for the Tukituki Estuary sites.
Table 4-1: Spearman Correlation Coefficients
for Clive River sites.
Table 4-2: Spearman Correlation Coefficients
for Ngarururo River sites.
Table 4-3: Spearman Correlation Coefficients
for Tutaekuri River sites.
Table 5-1: Spearman Correlation Coefficients
for Ahuriri Estuary sites.
Figures
Figure 2-1: Map showing the location of
estuaries within Hawke's Bay.
Figure 3-1: Tukituki estuary logger deployment
sites.
Figure 3-2: Maximum extent of saltwater
influence in the Tukituki Estuary.
Figure 3-3: Minimum extent of saltwater
influence in the Tukituki Estuary.
Figure 3-4: Scatter plot of median flow (X) and
median conductivity (Y) for the Tukituki Estuary.
Figure 3-5: Line plot of tide height
with associated median conductivity (Y1) and median flow (Y2) readings.
Figure 4-1: Waitangi estuary logger deployment
sites.
Figure 4-2: Maximum extent of saltwater
influence in the Waitangi Estuary.
Figure 4-3: Minimum extent of saltwater
influence in the Waitangi Estuary.
Figure 4-4: Scatter plot of median flow (X) and
median conductivity (Y) for the Clive River.
Figure 4-5: Line plot of tide height with
associated median conductivity (Y1) and median flow (Y2) readings.
Figure 4-6: Scatter plot of median flow (X) and
median conductivity (Y) for the Ngaruroro River.
Figure 4-7: Line plot of tide height with
associated median conductivity (Y1) and median flow (Y2) readings.
Figure 4‑8: Line plot of tide height with
associated median conductivity (Y1) and median flow (Y2) readings.
Figure 5-1: Ahuriri estuary logger deployment
sites.
Figure 5-2: Maximum extent of saltwater
influence in the Ahuriri Estuary.
Figure 5-3: Minimum extent of saltwater
influence in the Ahuriri Estuary.
Figure 5-4: Line plot of tide height with
associated median conductivity (Y1) and median rainfall (Y2) readings.
|
The
Tukituki, Waitangi and Ahuriri: Assessment of the Extent of Saltwater
Influence in Hawke's Bay Estuaries
|
Attachment 1
|
Executive summary
This report documents
the mapping of the extent of saltwater influence in three Hawke’s Bay
estuaries, the Tukituki, the Waitangi and the Ahuriri.
The current report
provides a specific benchmark or reference point in time against which change
over time may be assessed. These changes may be driven either by Council
managed activities (such as those regulated through the resource consent
process), or natural events (e.g. climate change, change in shape and extent of
the estuary following an unusual hydrological event).
The extent of
saltwater influence was mapped using ArcGIS interpolating continuous
conductivity data collected using Odyssey CT loggers. The data collected
indicates that the individual estuaries have different saltwater regimes,
driven largely by their physical characteristics and the magnitude of
freshwater inflows. Correlations indicate that the dominant variable
influencing the extent of saltwater influence was flow in the Tukituki, flow
and tide height in the Waitangi estuary and tide height in the Ahuriri estuary.
The maximum extent of
saltwater influence in these estuaries was:
§ 1
km into the Tukituki Estuary;
§ 4.1
km into the Clive River arm of the Waitangi Estuary;
§ 5.1
km into the Ngarururo River arm of the Waitangi Estuary;
§ 2.9
km into the Tutaekuri River arm of the Waitangi Estuary;
§ 9.2
km into the Ahuriri Estuary;
|
The
Tukituki, Waitangi and Ahuriri: Assessment of the Extent of Saltwater
Influence in Hawke's Bay Estuaries
|
Attachment 1
|
1 Introduction
Estuaries form a
transition zone (ecotone) between saline and fresh waters. Over tidal
cycles, saline water moves through estuaries and river mouth openings, the
larger the tidal coefficient (amplitude of the tide), the further the saltwater
pushes inland. Due to the density differences between saltwater and
freshwater, the saltwater often moves upstream in the form of a wedge, with the
denser saltwater pushing underneath
the fresh. Temperature differences between cooler seawater and river
water reinforce density differences during the summer period. As the freshwater
flow decreases, the wedge becomes longer and sharper, as flow increases, the
wedge becomes shorter and blunter until the freshwater pushes the saltwater
back toward the estuary mouth. In
addition to flow, the extent of saltwater influence in estuaries is affected by
four processes that determine the influence of physical characteristics of an
estuary on the tidal wave (Rijn 2010). These are:
§ amplification
(or shoaling) of the tidal wave as it is compressed as the width and
depth of the estuary decrease (convergence)
§ reduction
in the velocity of the tidal wave due to bottom friction
§ deformation
of the tidal wave leading to high tide occurring as a sharp transient event,
whereas low tide occurs as a long, smooth event
§ partial
reflection of the tidal wave by abrupt changes in the depth of the estuary or
at the landward end of the estuary (in the absence of a river).
Other meteorological factors
can also affect the extent of saltwater influence. Strong winds can push the
salt water in shallow estuaries. Strong onshore winds and large swells can
create a ‘storm surge’ effect where the sea level, and hence tide
level, is higher than it normally would be. Similarly, low barometric pressure
can cause an increase in water depth – tide heights are estimated for a
standard, 1013 hectopascals (hPa) pressure, and for every decrease in pressure
by of 1 hPa below the standard, tide height may be expected to increase by
about 1 cm[2].
Estuaries are highly
productive areas (P. Meire (2005)) driven by the constant supply of nutrients
provided by freshwater inputs. This productivity is not realised in an
especially large diversity of species but rather through large numbers of
individuals and a high biomass. These species include both freshwater and
marine species living at the maximum extent of their distribution areas, as
well as estuary-specific species. The distribution of species has been highly
correlated with salinity (J. Maes 1998). This high productivity results in a
high biomass of algae and phytoplankton, which in turn attract a large number
of invertebrates, fish and birds. Retaining the natural balance in these areas
is important to maintain the feeding and reproductive cycles of many species.
Additionally, the
extent of saltwater
penetration into rivers can have some important implications for jurisdictional
issues, claims under the Foreshore and Seabed Act (2004), and administration of
the Resource Management Act (1991).
The extent of saline
penetration in most New Zealand estuaries and rivers is largely unknown.
Within Hawke’s Bay, extensive work has been undertaken to describe these
zones, so that change driven either by Council managed activities (such as
those regulated through the resource consent process), or natural events (e.g.
climate change, change in shape and extent of the estuary following an unusual
hydrological event) may be detected. The current report provides a
specific benchmark or reference point in time against which change over time
may be assessed.
1.1 Project
objectives
This project will:
§ Describe
the spatial extent of Hawke’s Bay estuarine and riverine transition
areas;
§ Monitor
transition zones over time to provide an understanding of temporal change;
§ Provide
information regarding transitional zones to better target monitoring of
activities that may affect flora and fauna in these areas.
1.2 Statutory
context
Hawke’s Bay
Regional Council (HBRC) has a responsibility under the Resource Management Act
(1991) for the sustainable management of the coastal area. Sections 6 and
7 of the RMA outline the matters of national importance, and include the
‘preservation of natural character’ and ‘Maintenance and
enhancement of the quality of the environment’.
HBRC has demonstrated
commitment to increasing knowledge regarding the region's coastal resources by
funding investigation of estuarine processes (including saltwater influence)
over the life of the current long-term plan (Level of Service Statement, LTCCP
2009-2019).
2 Methodology
Odyssey conductivity
loggers (manufactured by Dataflow Systems Pty. Ltd.) were deployed in selected
estuaries in order to collect time series data that describe changes in
salinity at fixed points in the estuaries and to provide a spatial
characterisation of the saline transition zone. Water was classified as fresh,
brackish or salt as according to the Venice Classification System (Table 2‑1).
Table 2‑1: The
Venice Classification System.
|
Salinity
(ppt)
|
Conductivity
(mS/cm)
|
Classification
|
|
< 0.5
|
1.2
|
Fresh water
|
|
0.5 – 30
|
1.2 – 46
|
Brackish water
|
|
>30
|
>46
|
Salt water
|
2.1 Site
selection
Prior to logger
deployment, an initial survey of the estuary was conducted. Firstly, aerial or
satellite photos were inspected to see if there was an indication of where the
deeper channels may lie. Secondly, a physical reconnaissance of the estuary was
conducted at high tide, on a large tidal coefficient, by either kayak or boat.
Using a field conductivity meter, the extent of saltwater influence at the time
of survey was ascertained in order to guide placement of the loggers. A survey
of the types of shoreline vegetation gave further indications regarding the
extent of saltwater penetration.
Once the initial survey
was completed, conductivity loggers were deployed at the pre-determined sites
on the estuary. The location of the sites was determined by several factors:
§ Existence
of previous conductivity data.
§ Water
depth: the dense salt water moves up the channel that defines the deepest parts
of the estuary (thalweg); to ascertain the maximum extent of saltwater
influence, the loggers need to be deployed in the thalweg, where practicable.
§ Proximity
to areas of interest such as tributaries and potential Inanga spawning sites.
§ Distance
from the estuary mouth: placement of the loggers at even distances from the
estuary mouth allows for better interpolation of the data.
§ Location
of suitable attachment points. The
loggers were attached in a variety of ways: to manmade structures
(bridges/whitebait stands); to logs and root systems; anchored by concrete
blocks both freestanding and tethered to the bank. Loggers were attached
approximately 30 cm above the river bed in locations where they were
permanently covered by water.
2.2 Deployment
The loggers
were deployed under low
flow conditions with high tidal coefficients (spring tides) which are believed
to be the optimum conditions for determining the maximum extent of the
saltwater influence. The
loggers were deployed in the Tukituki Estuary once, and the larger Ahuriri and
Waitangi Estuaries twice. This was because of the size and complexity of the
latter two estuaries. Each deployment encompassed at least two periods of
spring tides that coincided with low flows. A tide was designated a spring tide
when the depth of water under high water conditions exceeded 1.7 meters.
While every
effort was made to map the maximum extent of the saltwater influence, the many
influencing variables involved means that it is possible the saline water could
intrude further into these estuaries than was observed during the periods of
study. Events such as large swells, strong onshore winds and low barometric pressure can create
‘storm surge’ conditions where tidal height dramatically exceeds
the forecast height, leading to an increase in the extent of saltwater
influence. The present study is considered to describe the typical
extent of saltwater influence.
Similarly,
it is not possible to map the ultimate minimum extent of saltwater influence,
because river conditions necessary (e.g. flood conditions with high velocity
flows) would probably lead to loss of loggers.
The extent of
saltwater influence recorded during this investigation has been mapped on an
estuary by estuary basis. The current report details work completed on the
Tukituki, Waitangi and Ahuriri Estuaries (see Figure 2-1).
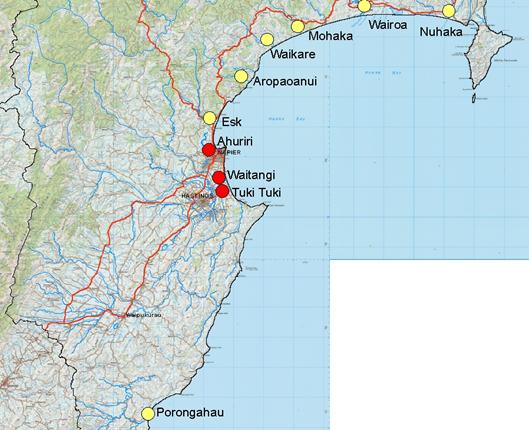
Figure 2-1: Map
showing the location of estuaries within Hawke's Bay.
The red
points denote the estuaries that have been included in this study to date, the
yellow points are estuaries that will be mapped during future surveys.
2.3 Data
analysis
The data retrieved
from the conductivity loggers was analysed using ArcGIS. Data were
interpolated to provide a conductivity gradient for each estuary at the time of
maximum and minimum saltwater influence.
Spearman correlations
were determined using Statistica V.11. These allow the influence of tidal
height and flow/rainfall on conductivity readings to be determined at sites
where saline or brackish water was recorded. The amount of data available for
the correlations was restricted by the tidal height information. The tide data
utilised[3]
gives only the time of the point of lowest and highest tide, whereas the
conductivity and flow data were collected at 15 minute intervals. Therefore the
median conductivity and flow values for a six hour period (three hours either
side of the tide time) were calculated and these values were used for the
correlations rather than the raw data.
Tidal influx is often
delayed in estuarine systems relative to the adjacent coastline. Typically the
delay for the tidal wave to reach a point in an estuary increases with distance
from the estuary mouth. This delay was accounted for at each logger site
by first examining the conductivity and tide height data graphically to
ascertain any lag between peak conductivity readings and time of high tide.
Where necessary, the high tide time was then adjusted to be synchronised with
peak conductivity readings. This temporal adjustment was confirmed using the
Spearman correlation - adjustment was accepted if the adjusted tide time
provided a higher correlation coefficient (r).
The correlation
coefficient (r) describes the relationship between conductivity and either flow
or tide height. The correlation coefficient can have a value of between 1 and
-1. A negative value means that as either flow or tidal height increase,
conductivity tends to decrease. A positive value means that as flow or tidal
height increases, conductivity tends to increase also. The closer the
correlation coefficient is to either 1 or -1, the stronger the relationship.
The p value describes whether this relationship is statistically significant.
The relationship is significant when p < 0.05.
3 Tukituki
Estuary
The Tukituki River is
the fourth largest river in the region in terms of average flows. (Hume
2013), determined that residence times of waters within the estuary are short and
characterised the estuary as essentially an extension of the river that is
tidally influenced. The river bed within the estuary is predominantly gravel,
with a relatively steep gradient.
Conductivity
loggers were deployed at five sites (Figure
3-1) in the
Tukituki Estuary between 24/01/12 and 24/02/12. These loggers were attached to
concrete blocks placed on the river bed.
The initial
survey indicated that saltwater intruded as far as site 3 (1.8 m tide). The
logger at site 4 was placed in the thalweg where there was rapid flow and was
not expected to log any saline or brackish water. Bankside vegetation could not
be used as an indicator of the extent of saltwater influence because the area
is highly modified and characterized by introduced grasses, willows and
poplars. The saline and fresh water appeared to be highly stratified, with the
saltwater confined to the thalweg and minimal mixing with the upper freshwater
layer. Visual observations of the water clarity appeared to be the best
indicator of saline water, which was much more turbid than the freshwater.
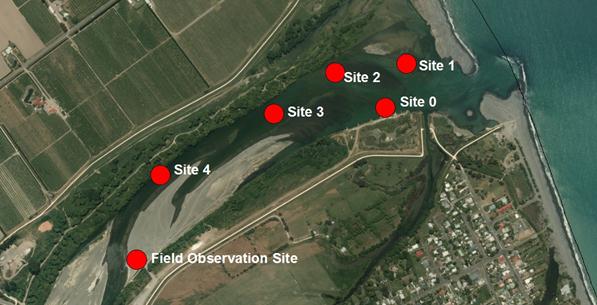
Figure
3-1:
Tukituki estuary logger deployment sites.
The hydrographic flow
site at Red Bridge, approximately 10 km
upstream of the estuary was used to estimate river flow (m3/sec)
data at the estuary. There is limited inflow between the Red Bridge site
and the river mouth.
The loggers
were deployed during a period of low flow (~ 12 m3/sec) that lasted
for two and a half weeks before the flow increased to over 50 m3/sec
on the 20/02/12. The loggers were retrieved three days later because of
concerns they would be buried by gravel or swept away. The logger at site 0 malfunctioned,
however field observations at this site indicated that it would be subject to
saltwater under all conditions. Sites 3 and 4 recorded brackish water at
certain periods, and sites 1 and 2 recorded saltwater the majority of the
time. Further observations were taken during periods of low flow (~ 5 m3/sec) at
the ‘Field Observation Site’ using a field meter. Conductivity readings
of 36 mS/cm (brackish – saltwater) were recorded here in 1.2 m water
depth. Of particular interest at this site was a localized phytoplankton bloom
of Cryptomenas sp. collected from the saline part of the water column
(see Appendix 1 for laboratory report).
3.1 Results
ArcGIS was used to
interpolate the data from the Odyssey loggers and generate graphical images of
the maximum (Figure 3-2) and minimum (Figure 3-3) extent of the saltwater
influence in the Tukituki Estuary. The maximum extent of saltwater influence
was approximately 1 km from the estuary mouth. At present the upper extent of
the saltwater influence is bounded by a steep riffle, approximately 100 metres
downstream from Black Bridge.
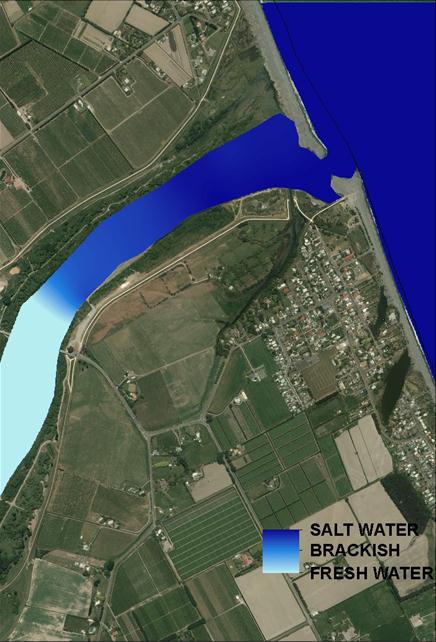
Figure
3-2:
Maximum extent of saltwater influence in the Tukituki
Estuary.
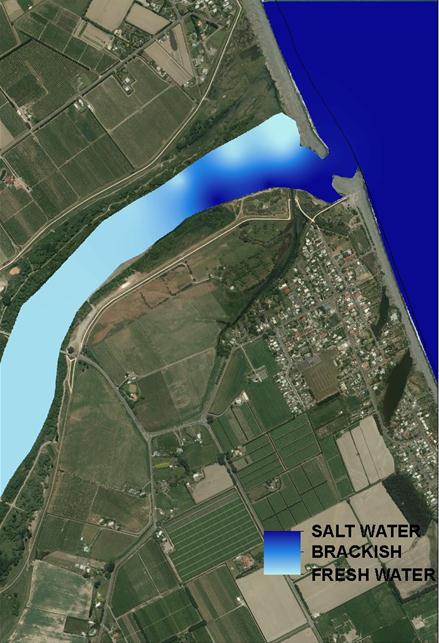
Figure
3-3:
Minimum extent of saltwater influence in the Tukituki
Estuary.
The median
conductivity was correlated with the median flow data and tidal height (Table 3-1).
The estuarine stretch of the Tukituki River is relatively short and straight
– accordingly, there is little tidal delay and it was only necessary to
adjust the data at Site 4 (Table 3-1).
Table 3-1: Spearman
correlation coefficients for the Tukituki Estuary sites.
Figures shown in bold are statistically significant (p<0.05).
|
|
Site
|
Period
of Deployment
|
Tidal
delay
|
Conductivity
vs. Flow
|
Conductivity
vs. Tide height
|
|
UPSTREAM
|
4
|
24/01/12 –
24/02/12
|
+ 2 hrs
|
-0.586
|
0.101
|
|

|
3
|
24/01/12 –
24/02/12
|
0 hrs
|
-0.676
|
0.105
|
|
2
|
24/01/12 –
24/02/12
|
0 hrs
|
-0.616
|
0.393
|
|
DOWNSTREAM
|
1
|
24/01/12 –
24/02/12
|
0 hrs
|
-0.478
|
0.469
|
Flow was significantly
negatively correlated with conductivity at all sites (Table 3-1). These
correlations are quite high for the natural environment and suggest a strong
relationship between an increase in flow and a decrease in conductivity. The
increase in flow required to reduce the influence of saltwater to all sites was
quite similar (between 35 and 45 m3/s) (see Figure 3-4). Tide
height had a strong positive correlation with conductivity at the lower sites
but no relationship at the upstream sites (Table 3-1). This suggests flow
limits conductivity at the upstream sites, while both flow and tide height have
a combined influence closer to the estuary mouth.
The increasing
influence of saltwater closer to the estuary mouth can be seen in Figure 3-5. At the upstream sites (3 & 4),
only brackish water was present on the largest tidal coefficients with
corresponding low flows. As might be expected, salinity was highest at the
sites closest to the mouth, and the point of highest salinity more frequently
coincided with the high tide.
|
Site 4
|
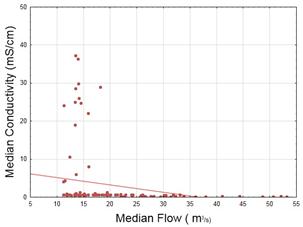
|
 Upstream Upstream
|
|
Site 3
|
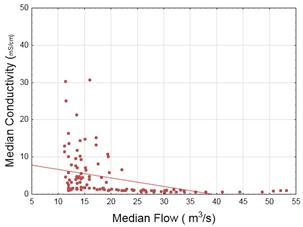
|
|
|
Site 2
|
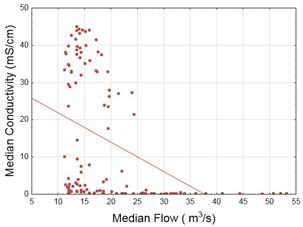
|
|
Site 1
|
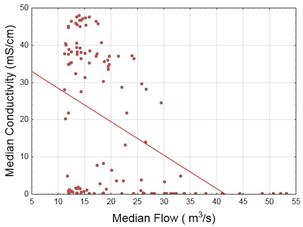
|
Downstream
|
Figure 3-4: Scatter
plot of median flow (X) and median conductivity (Y) for the Tukituki Estuary.
|
The
Tukituki, Waitangi and Ahuriri: Assessment of the Extent of Saltwater
Influence in Hawke's Bay Estuaries
|
Attachment 1
|
|
Site 4
|
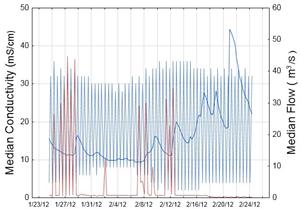
|
 Upstream Upstream
|
|
Site 3
|
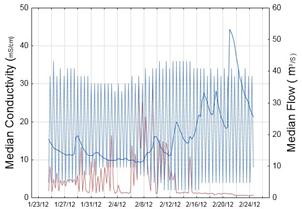
|
|
|
Site 2
|
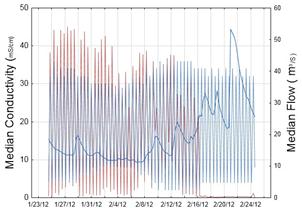
|
|
Site 1
|
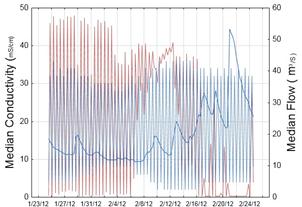
|
Downstream
|
|
 Tide Height Tide Height  Median Flow Median Flow  Median Conductivity Median Conductivity
|
Figure 3-5: Line
plot of tide height with associated median conductivity (Y1) and median flow
(Y2) readings.
|
The
Tukituki, Waitangi and Ahuriri: Assessment of the Extent of Saltwater
Influence in Hawke's Bay Estuaries
|
Attachment 1
|
4 Waitangi
Estuary
The Waitangi Estuary
is the common mouth of the Tutaekuri River (north), Ngarururo River (centre)
and Clive River (south), and is the only multi-river estuary in Hawke’s
Bay. The rivers feeding into the Waitangi Estuary have been extensively
modified. Each river channel appears to have characteristics that effect
the extent of saltwater influence uniquely.
Conductivity loggers
were deployed within the Waitangi Estuary from the 18/12/12 to the 24/01/13 and
from the 27/02/13 till the 16/04/13 (Figure 4-1). The loggers were deployed
using a variety of methods, including attachment to concrete blocks, whitebait
stands, logs and the Brookfields Bridge. Despite efforts to conceal the
loggers, several were lost due to vandalism.
The initial survey of
the estuary found saltwater penetration 100 metres downstream of site 1T on the
Tutaekuri River, to site 2N on the Ngarururo River and to site 1C on the Clive
River. Similar to the Tukituki Estuary, the banks of the Waitangi are highly
modified with only replanted remnants of native vegetation, and the waters are
similarly stratified, making it difficult to visually determine the extent of
saltwater influence. Once again water clarity provided a better indication of
the saline content of the water. On retrieval of the loggers on the 16/04/13, a
large phytoplankton bloom was observed around logger site 3N. The
bloom was dominated by Cryptomonas sp, which can be fresh or saltwater
species (see Appendix 1 for laboratory report). This bloom was confined
to the saline part of the water and may therefore be a saline species.
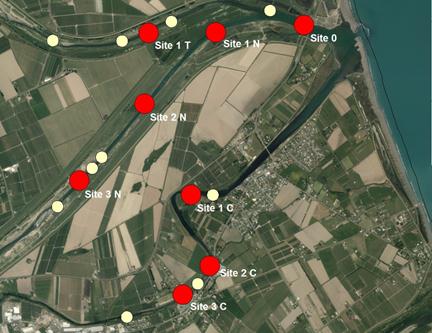
Figure 4-1: Waitangi
estuary logger deployment sites.
Red points
denote sites were logger data was correlated against flow and tide height;
white points denote sites of previous logger deployment
During the primary
period of deployment there was one rain event around the 26/12/13 that
increased flows in all the rivers. The second period of deployment was during
extreme low flow conditions. The purpose of the primary deployment was to
coarsely identify the extent of saline penetration into the estuary. The second
deployment focused on the areas of furthest extent of saline water found during
the primary deployment to increase the resolution at this level.
The different physical
attributes of these rivers (e.g., depth of thalweg, meanders, flow etc.) mean
that the saltwater influence into each is different. The estuary was treated as
a single system for the GIS interpolation but correlations were conducted
separately for each river.
The maximum extent of
saltwater influence in the Waitangi Estuary was approximately 5.2 km in the
Ngarururo River), 2.5 km in the Tutaekuri River and 4.1 km into the Clive River
(Figure 4-2).
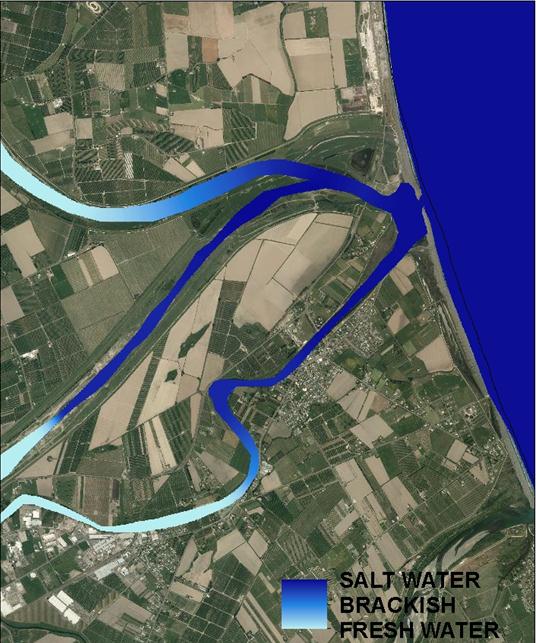
Figure 4-2: Maximum
extent of saltwater influence in the Waitangi Estuary.
The minimum extent of
saltwater influence in the Waitangi Estuary was shorter in the Tutaekuri and
Ngarururo arms than the Clive River (Figure 4-3). This is likely due to the
larger catchments and greater flows of water in the former that exert a greater
pressure on the salt water, particularly during rainfall events .
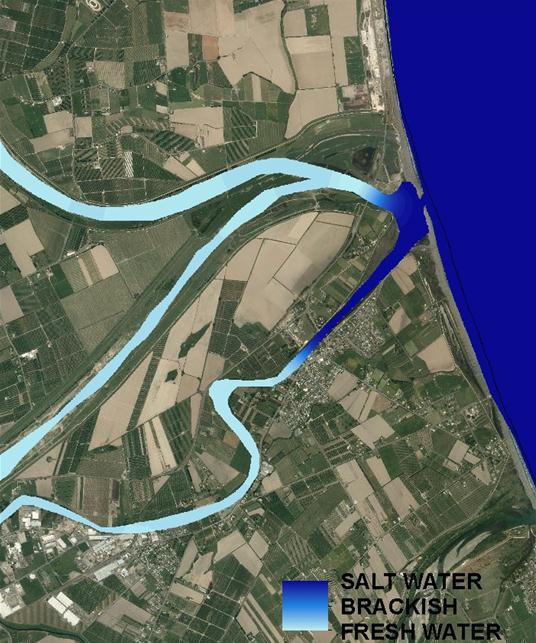
Figure 4-3: Minimum
extent of saltwater influence in the Waitangi Estuary.
4.1 Clive
River
The Clive River is the
southern-most arm of the Waitangi Estuary. The Clive River follows the original
path of the Ngarururo River prior to its channelization. The flows in the Clive
River are much smaller than would typically be found in a river channel of this
size. As a consequence, flows in the Clive River are slower than the
other rivers; this creates a depositional environment – as a consequence,
the river bed is characterised by soft sediments and extensive macrophyte
growth. Flow measurements from a hydrographic site in the Awanui Stream (one of
the tributaries of the Clive River) were used as a proxy for flow conditions in
the Clive River.
The maximum extent of
saltwater influence in the Clive River was 4.1 km from the mouth.
Data from loggers
collected during both periods of deployment were correlated against median flow
and tide conditions (Table 4-1).
Table 4-1: Spearman
Correlation Coefficients for Clive River sites.
Figures shown in bold are statistically significant (p<0.05).
|
|
Site
|
Period
of Deployment
|
Tidal
delay
|
Conductivity
vs. Flow
|
Conductivity
vs. Tide height
|
|
 UPSTREAM UPSTREAM
|
3 C
|
27/02/13–
16/04/13
|
+ 3 hrs
|
-0.578
|
0.047
|
|
|
2 C
|
27/02/13–
16/04/13
|
+ 3 hrs
|
-0.757
|
0.093
|
|
DOWNSTREAM
|
1 C
|
18/12/12-
24/01/13
|
0 hrs
|
-0.766
|
0.213
|
Flow had a significant
negative correlation with conductivity at all sites (Table 4-1). This suggests
a strong relationship between an increase in flow and a decrease in
conductivity. Towards the estuary mouth a higher flow is required to reduce the
influence of saltwater (see Figure 4-4). Tide height had a weak positive
correlation with conductivity at Site 1C but no relationship at the upstream
sites (Table 4-1). This suggests flow is the deciding factor limiting
conductivity at all sites, however at the estuary mouth tidal height
additionally has a small positive influence on conductivity levels. At all
sites the periods of highest conductivity were associated with the period of
highest tidal coefficient (Figure 4-5).
|
Site 3C
|
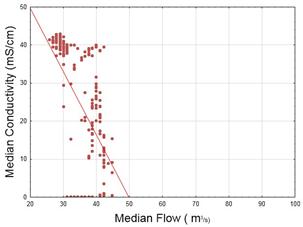
|
Upstream
|
|
Site 2C
|
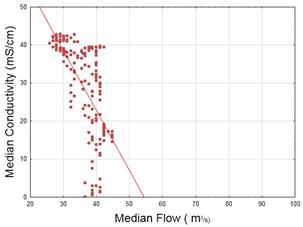
|

|
|
Site 1C
|
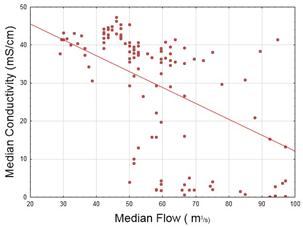
|
Downstream
|
Figure 4-4: Scatter
plot of median flow (X) and median conductivity (Y) for the Clive River.
|
Site 3C
|
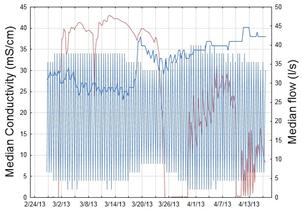
|
Upstream
|
|
Site 2C
|
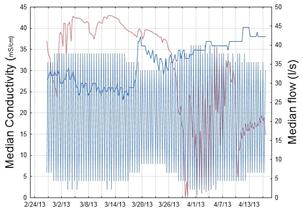
|

|
|
Site 1C
|
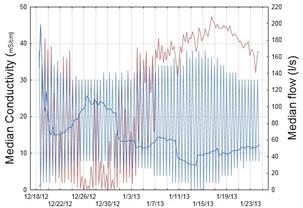
|
Downstream
|
|
Tide Height Median Flow Median Conductivity
|
Figure
4-5: Line
plot of tide height with associated median conductivity (Y1) and median flow
(Y2) readings.
Note the
different flow values (Y2) between the sites 3C and 2C and the site 1C,
corresponding to different periods of deployment.
4.2 Ngarururo
River
The Ngarururo River
forms the central arm of the Waitangi Estuary. It generally contributes the
greatest flow of the three rivers which flow into the Waitangi Estuary. Where
the river enters the estuary it is channelised with a deep thalweg. The bed of
the estuary is mainly comprised of river gravels.
The hydrographic site
at Fernhill was used to measure flow (m3/sec). Flows from 2 –
26 m3 /sec were recorded (annual mean = 33.12 m3/sec). Conductivity data collected
from the Odyssey loggers was correlated against flow and tide height (Table 4-2).
The maximum extent of
saltwater influence in the Ngarururo River was 5.1 km from the estuary mouth.
Table 4-2: Spearman
Correlation Coefficients for Ngarururo River sites.
Figures shown in bold are statistically significant (p<0.05).
|
|
Site
|
Period
of Deployment
|
Tidal
delay
|
Conductivity
vs. Flow
|
Conductivity
vs. Tide height
|
|
 UPSTREAM UPSTREAM
|
3 N
|
27/02/13–
16/04/13
|
+ 3 hrs
|
-0.563
|
0.146
|
|
|
2 N
|
18/12/12-
24/01/13
|
+ 2 hrs
|
-0.247
|
0.479
|
|
|
1 N
|
18/12/12-
24/01/13
|
0 hrs
|
-0.289
|
0.716
|
|
DOWNSTREAM
|
0
|
18/12/12-
24/01/13
|
0 hrs
|
-0.288
|
0.645
|
Flow and tidal height
have significant negative and positive correlations respectively with
conductivity (Table 4-2). Flow had a higher negative correlation at the most
upstream site (3 N), suggesting that the influence of flow on the extent of
saltwater influence increased with distance from the river mouth. Similarly,
the flow rate required to reduce saltwater influence at the lower sites was
much higher than that at the upper sites (Figure 4-6). The lower sites had a
higher positive correlation with tide height, suggesting that at these sites an
increase in tide height had a more important influence on conductivity than
flow. At all sites the periods of highest conductivity were associated with the
period of highest tidal coefficient (Figure 4-7).
|
Site 3N
|
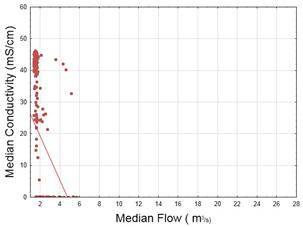
|
Upstream
|
|
Site 2N
|
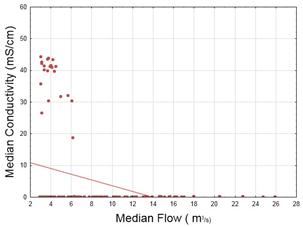
|
|
|
Site 1N
|
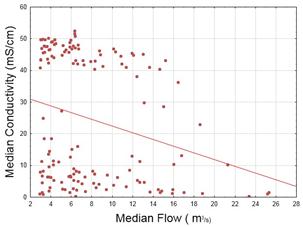
|
|
Site 0
|
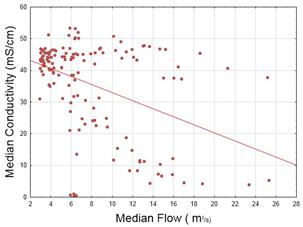
|
Downstream
|
Figure 4-6: Scatter
plot of median flow (X) and median conductivity (Y) for the Ngaruroro River.
|
Site 3N
|
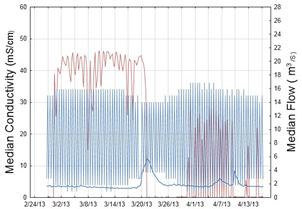
|
 Upstream Upstream
|
|
Site 2N
|
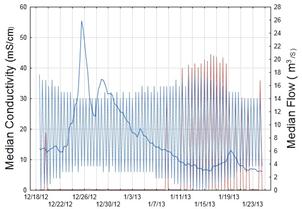
|
|
|
Site 1N
|
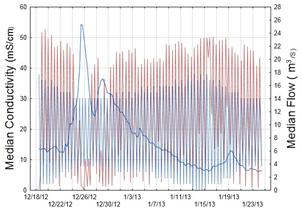
|
|
Site 0
|
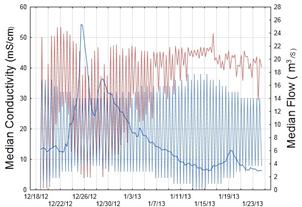
|
Downstream
|
|
Tide Height Median Flow Median Conductivity
|
Figure
4-7: Line
plot of tide height with associated median conductivity (Y1) and median flow
(Y2) readings.
Note
the different flow values (Y2) between the site 3N and the other sites corresponding
to different periods of deployment.
4.3 Tutaekuri
River
The Tutaekuri River
forms the northern arm of the Waitangi Estuary. The Tutaekuri River is the
shallowest of the three rivers running into the Waitangi Estuary and the bed is
predominantly clean river gravels.
The hydrographic site
at Puketapu was used as a proxy for flows into the estuary. Flows ranging
between 3 – 25 m3/sec were recorded during the period of
logger deployment (annual mean = 11.66 m3/sec).
The maximum extent of
saltwater influence in the Tutaekuri River was approximately 2.9 km from the
mouth.
Several of the loggers
placed in the Tutaekuri River malfunctioned, and the data from these loggers
failed quality control checks. Therefore data from only two loggers were
used in the assessment.
Table 4-3: Spearman
Correlation Coefficients for Tutaekuri River sites.
Figures shown in bold are statistically significant (p<0.05).
|
|
Site
|
Period
of Deployment
|
Tidal
delay
|
Conductivity
vs. Flow
|
Conductivity
vs. Tide height
|
|
UPSTREAM
|
1T
|
27/02/13–
16/04/13
|
+ 3 hrs
|
-0.088
|
0.308
|
|
DOWNSTREAM
|
0
|
18/12/12-
24/01/13
|
0 hrs
|
-0.288
|
0.645
|
Tide height was
positively correlated with conductivity at both sites (Table 4-3). This
suggests a strong relationship between an increase in tide height and conductivity
at site 0, and a moderate relationship at site 1T (Figure 4‑8).
Conductivity was
negatively correlated with flow at the downstream site only (Table 4-3). It was
expected that the saline wedge would act similarly in the Tutaekuri River as
was observed in the other rivers, with the negative correlation of conductivity
with flow increasing in an upstream direction. However no significant
correlation between flow and conductivity was observed - therefore the
scatterplot of flow (X) and conductivity (Y) has not been plotted for this
river.
|
Site 1T
|
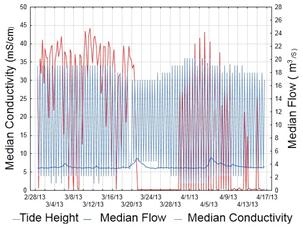
|
Upstream
|
|
Site 0
|
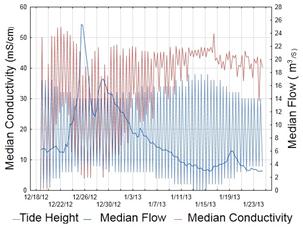
|
Downstream
|
Figure 4‑8: Line
plot of tide height with associated median conductivity (Y1) and median flow
(Y2) readings.
Note the different flow values (Y2) between the two sites indicating different
periods of deployment.
5 Ahuriri
Estuary
In a region dominated
by alluvial flood plain river mouths, the Ahuriri Estuary (Te
Whanganui-a-Orotu) represents one of the few tidal lagoon estuaries in
Hawke’s Bay. With an area of 470 ha it is also the region’s largest
estuary. Unlike the other estuaries, this estuary also has large areas of
associated wetlands (approx. 175 ha) (Madarasz-Smith, 2013).The Ahuriri Estuary
also differs from the other estuaries in the area as there are no large
riverine inputs. The bed of the estuary comprises of mainly soft sediments and
the water depth is generally much shallower than the other estuaries reported
here.
Figure 5-1 shows the
sites of logger deployment within the estuary. Placement of the loggers
was informed by conductivity data collected at a limited number of sites during
previous investigations on the estuary (HBRC unpublished) and an initial survey
of bankside vegetation. The initial survey of the Ahuriri Estuary used the
extent and location of native vegetation, especially the raupo (Typha
orientalis) as an indicator of the maximum extent of the saltwater
influence.
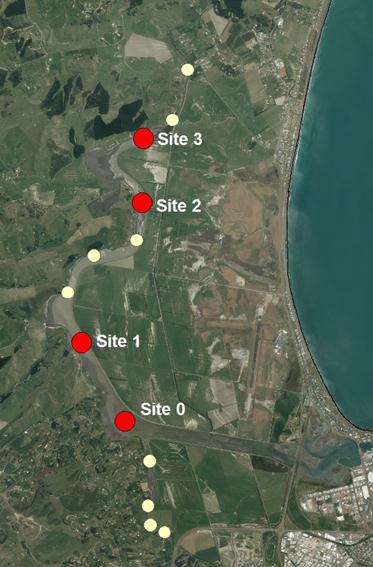
Figure 5-1: Ahuriri
estuary logger deployment sites.
Red points denote
sites where logger data was correlated against flow and tide height.
Conductivity loggers
were deployed in the Ahuriri Estuary (Figure 5-1) for two periods, first
between the 17/08/12 and the 25/09/12 and then between the 23/04/13 and the
6/06/13. During the first deployment, several of the loggers malfunctioned and
the data gathered from these loggers failed quality control checks and were
therefore not used in the assessment. The second period of deployment was at
the end of an extended period of drought. Loggers were attached to existing
structures and warratahs driven into the soft sediment.
There was no
operational flow site within the Ahuriri Estuary during the time of logger
deployment so rainfall at a nearby site (Newstead) was used as a proxy for flow
in the estuary. There were two periods of low rainfall during the time of
deployment but these seemed to have little effect on conductivity measurements
(Figure 5-4).
5.1 Ahuriri
Estuary Results
ArcGIS was used to
interpolate the logger data and generate graphical images of the maximum
(Figure 5-2) and minimum (Figure 5-3) extent of saltwater influence in the
Ahuriri Estuary. The maximum extent of saltwater influence into the Ahuriri
Estuary was approximately 9.2 km (Figure 5-2).
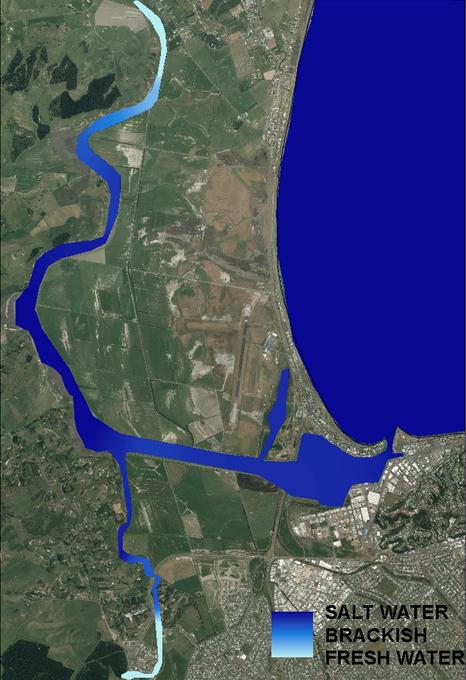
Figure 5-2: Maximum
extent of saltwater influence in the Ahuriri Estuary.
The ArcGIS
interpolation for the minimum extent (Figure 5-3) utilised data collected
during previous surveys of the estuary and shows the saline water pushed back
almost to the mouth of the estuary.
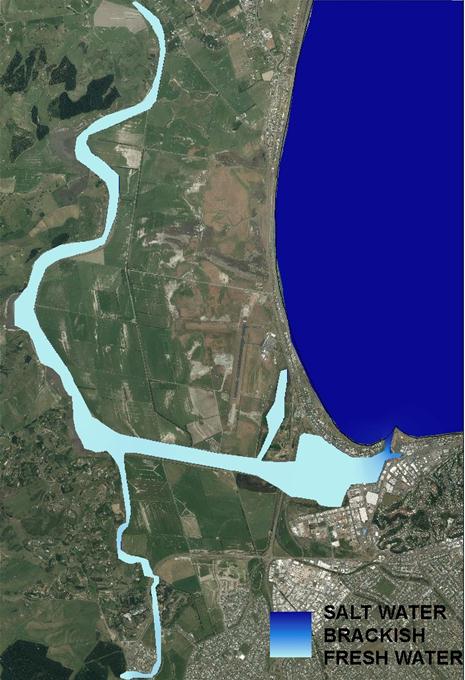
Figure 5-3: Minimum
extent of saltwater influence in the Ahuriri Estuary.
Conductivity was not
significantly correlated with rainfall at any of the sites (Table 5-1). Due to
this lack of correlation the scatter plots of conductivity (Y) and rainfall (X)
have not been plotted.
Table
5-1: Spearman
Correlation Coefficients for Ahuriri Estuary sites.
Figures shown in bold are statistically significant (p<0.05).
|
|
Site
|
Period
of Deployment
|
Tidal
delay
|
Conductivity
vs. Rainfall
|
Conductivity
vs. Tide height
|
|
UPSTREAM
|
3
|
23/04/13 –
06/06/13
|
+ 6 hrs
|
- 0.089
|
0.279
|
|
|
2
|
23/04/13 –
06/06/13
|
+ 6 hrs
|
0.103
|
0.312
|
|
1
|
23/04/13 –
06/06/13
|
+ 3 hrs
|
0.005
|
0.339
|
|
DOWNSTREAM
|
0
|
23/04/13 –
06/06/13
|
+ 3 hrs
|
-0.011
|
0.338
|
At all sites,
conductivity was positively correlated with tide height (Table 5-1). This
suggests that tide height is the significant factor influencing the extent of
saltwater influence in the Ahuriri Estuary. There was less variation in
conductivity readings between the low and high tides (Figure 5-4) than the
Tukituki and Waitangi Estuaries due to a higher degree of vertical mixing
through the water column, and much smaller inflows of freshwater into the
estuary.
|
Site 3
|
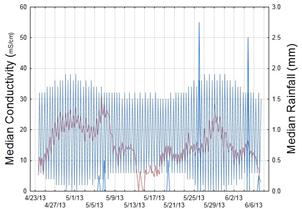
|
 Upstream Upstream
|
|
Site 2
|
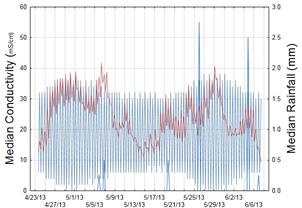
|
|
|
Site 1
|
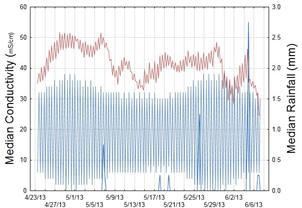
|
|
Site 0
|
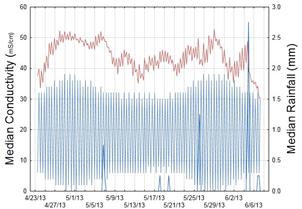
|
Downstream
|
|
Tide Height Median Flow Median Conductivity
|
Figure
5-4: Line
plot of tide height with associated median conductivity (Y1) and median
rainfall (Y2) readings.
6 Discussion
The data collected
from the Tukituki, Waitangi and Ahuriri Estuaries indicate that the individual
estuaries have different salinity regimes, driven largely by their physical
characteristics and the magnitude of freshwater inflows.
Data from the Tukituki
Estuary indicate that it is the most stratified of the three estuaries. The
correlations suggest that flow is the dominant force governing the extent of
saltwater influence, with all conductivity values at all sites displaying a
stronger relationship with flow than tide height (Table 3-1). Under the
conditions encountered, the Tukituki acted as a classic
‘saline-wedge’ estuary (Pritchard, 1989), with the salt water
pushing up under the fresh water with little mixing between the two layers.
Since flow appears to be the dominant force influencing the extent of saltwater
influence at this site, any changes in flow are likely to affect the extent of
saltwater influence. However, the relatively steep gradient of the upper
Tukituki Estuary appears to act as a physical barrier as the estuary bed
rapidly rises above sea level. The bed of the estuary is dynamic and this
physical barrier can move up or downstream in responses to changes to the river
bed following flood events. During the initial survey it was hoped to use
bankside vegetation as an indicator of the extent of saltwater influence; the
strong stratification and limited mixing of fresh and saline water has little
impact on the vegetation, which only comes into contact with the surface
freshwater layer. This is evident in the fact that willows are present almost
down to the estuary mouth.
As a common mouth for
three river systems, the characteristics of the extent of saltwater influence
in the Waitangi Estuary were different in each of the rivers. The Clive River
is highly stratified and acted as a ‘saline-wedge’ estuary where
flow had a stronger correlation with conductivity than tide height (Table 4-1).
In the Ngarururo River although both flow and tide height appeared to strongly
influence the extent of saltwater influence (Table 4-2), the water still
appeared stratified. The Tutaekuri River, as the shallowest of the three arms
of the Waitangi Estuary, did not appear to be as stratified as either the Clive
or Ngarururo arms. For the Tutaekuri arm, tide height was significantly
correlated with conductivity (Table 4-3). As for the Tukituki Estuary, the
Waitangi Estuary is susceptible to changes in low flows affecting the maximum
extent of saltwater influence, however, this extent is also bounded by the
physical barrier of the river beds rising above sea level.
The Ahuriri Estuary
has different physical characteristics to the Tukituki and Waitangi Estuaries.
There are no large riverine inputs, and the estuary itself is relatively
shallow and meandering with extensive wetlands. The lack of riverine inputs is
reflected in the salinity regime, with
tide height the significant variable affecting salinity at all sites (Table 5-1).
Unlike the Tukituki and Waitangi Estuaries, conductivity remains high in the
estuary throughout the tidal cycle (Figure 5-4) (Figure 3-5, Figure 4-5, Figure 4-7). The limited
freshwater inflow, generally shallow water and meandering nature of the
channel, combined with wind mixing, limit the stratification of the water in
the estuary. This lower degree of stratification means that the extent of
saltwater influence is more likely to have an impact on the bankside vegetation
than in the Waitangi or Tukituki Estuaries.
It is possible that
the extent of saltwater influence recorded in the Ahuriri Estuary was unusual
as large diebacks of the saltwater intolerant plant raupo were observed
upstream of Site 2 during the summer of 2013. The presence of raupo suggests
that under typical conditions, saline or brackish water does not travel this
far toward the head of the estuary. Another factor that could have caused some
of the dieback of the Raupo was input of heavily brackish water (measured at 35
mS/cm) from a pump station 500m up-stream from site 3. The reason for this pump
station to be discharging heavily brackish water is unknown but could be due to
the disturbance of previously static marine silts or an increased level of
seawater ingress into the groundwater due to the drought conditions.
Data collected in the
Tukituki and Waitangi Estuaries suggest that Council-managed activities are
unlikely to influence the maximum extent of saltwater influence in these
estuaries appreciably, because of the dominant effect of the physical barrier
caused by the riverbed rising above sea level, regardless of flow. This has the
potential to affect the distribution of species that do not have a high degree
of salt tolerance. Further monitoring over longer time periods and through
different flow conditions is required to verify this. The limited inflow of
freshwater into the Ahuriri Estuary means that while it is likely to be less
susceptible to changes in low flows than other estuaries, the relatively low
gradient makes it more susceptible to issues such as sea level rise caused by
global warming.
Initial surveys of the
estuaries prior to logger deployment showed that bankside vegetation was of
little use as an indicator of the extent of saltwater influence, primarily
because these estuaries are generally highly modified (channelised and denuded
of native vegetation). An exception was the upper reaches of the Ahuriri
Estuary. Secondly, the water in the estuaries (especially the Tukituki and
Waitangi Estuaries) is highly stratified, generally confining the saltwater to
the deepest parts of the channel (the thalweg), limiting contact with and
therefore effect on the bankside vegetation. The best broadscale indicator of
the saltwater wedge appeared to be water clarity. Under low flow conditions the
river waters appeared less turbid than the associated marine waters. This
resulted in a visually identifiable change in the waters that was verified using
a field conductivity meter.
The initial surveys of
the estuaries, carried out on spring tides (>1.7m), led to under-estimation
of the extent of the saltwater influence because of the unexpectedly large
delay in the tidal wave reaching the upper parts of the estuaries. Previously
the tidal delay in the Ahuriri estuary was believed to be +2.5 hours
(Madarasz-Smith, pers. comm.). The data collected during this investigation
shows the tidal delay to vary between 3 hrs at Site 0 at the mouth of the Taipo
Stream, to as much as 9 hrs at the at the head of the estuary (the maximum
extent of saltwater influence). It was only by deploying static continuous
recording devices such as those used in this investigation that it was possible
to determine the extent of this tidal wave delay.
The interface between
saline and freshwater is highly productive, characterised by effects such as
phytoplankton blooms (J. Lobry 2003). During these surveys, extensive
phytoplankton blooms were observed in the Clive (24/01/13) and Ngarururo
(15/04/13) rivers, and small localised blooms were observed in the Tukituki
(27/02/13) and Tutaekuri (27/02/13) Rivers. Samples collected from both the
Ngarururo and Tukituki Rivers were dominated by Cryptomonas sp. For
blooms to persist in estuaries, warm temperatures and stable flow conditions
are required. A similar bloom of Cryptomonas sp. was observed by
Robertson and Stevens (Stevens 2008) in the upper areas of the Motupipi Estuary
(Tasman) which was caused by a combination of excessive nutrient
concentrations, a stable salt wedge, warm water temperatures, stable base-flows
and limited turbulent mixing. The conditions in the Hawke’s Bay estuaries
where blooms occurred generally mirrored the conditions observed in the
Motupipi estuary: Water temperatures were high, flows were extremely low and
stable, causing little turbulence and a stable salt wedge. These conditions may
be regarded as atypical because the region was in the middle of a prolonged
drought, with uncharacteristically low flows that persisted over a longer
period of time than usual. Under normal conditions when flows are
generally higher and more varied, it is unlikely that blooms would have a
chance to form. Further study of the extent and frequency of bloom formation in
the regions estuaries will be required to understand the dynamics involved, or
whether Council-managed activities influence the extent or persistence of these
blooms.
|
The
Tukituki, Waitangi and Ahuriri: Assessment of the Extent of Saltwater
Influence in Hawke's Bay Estuaries
|
Attachment 1
|
7 Conclusion
This report describes
the extent of saltwater influence in the Tukituki, Waitangi and Ahuriri
Estuaries. The maximum extent of saltwater influence in these estuaries was:
§ 1
km into the Tukituki Estuary;
§ 4.1
km into the Clive River arm of the Waitangi Estuary;
§ 5.1
km into the Ngarururo River arm of the Waitangi Estuary;
§ 2.9
km into the Tutaekuri River arm of the Waitangi Estuary;
§ 9.2
km into the Ahuriri Estuary;
These values provide a
reference point against which temporal changes in the extent of saltwater
influence in these estuaries may be compared.
8 Acknowledgements
Shane Gilmer for
invaluable assistance during logger deployment and retrieval.
|
The
Tukituki, Waitangi and Ahuriri: Assessment of the Extent of Saltwater
Influence in Hawke's Bay Estuaries
|
Attachment 1
|
9 References
Hume, T. (2013). Key
Statistics and Flushing Time for the Tukituki Estuary, NIWA.
J. Lobry, L. M., E. Rochard and P.
Elie (2003). "Structure of the Gironde estuarine fish assemblages: a
comparison of European estuaries perspective." Aquatic Living Resources
16: 47-58.
J. Maes, A. T., P. A. Van Damne, K.
Cottenie and F. Ollevier (1998). "Seasonal Patterns in the Fish and
Crustacean Community of a Turbid Temperate Estuary (Zeeschelde Estuary,
Belgium)." Estuarine, Coastal and Shelf Science 47: 143-151.
P. Meire, T. Y., S. Van Damme, E.
Van den Bergh, T. Maris and E. Struyf (2005). "The Scheldt Estuary: a
description of a changing ecosystem." Hydrobiologia 540:
1-11.
Rijn, L. C. V. (2010). Tidal
phenomena in the Scheldt Estuary. LTV Zandhuishuoding Schelde Estuarium 2010,
Deltares.
Stevens, B. R. a. L.
(2008). Motupip Estuary: Vulnerability Assessment and Monitoring
Recommendations
|
The
Tukituki, Waitangi and Ahuriri: Assessment of the Extent of Saltwater
Influence in Hawke's Bay Estuaries
|
Attachment 1
|
Appendix A Laboratory
test results
Tukituki estuary bloom report
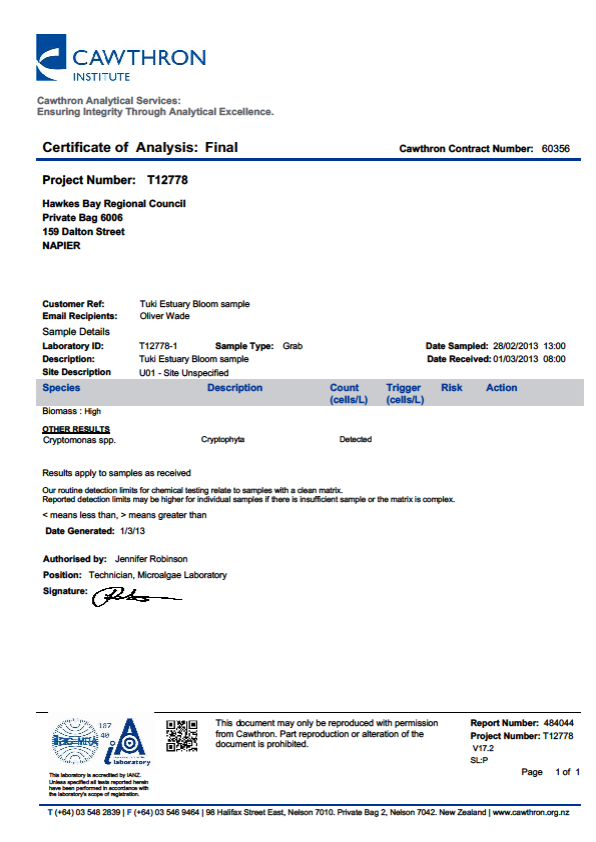
Ngarururo bloom laboratory
report
Hume, T.
(2013). Key Statistics and Flushing Time for the Tukituki Estuary, NIWA.
J. Lobry, L.
M., E. Rochard and P. Elie (2003). "Structure of the Gironde estuarine
fish assemblages: a comparison of European estuaries perspective." Aquatic
Living Resources 16: 47-58.
J. Maes, A.
T., P. A. Van Damne, K. Cottenie and F. Ollevier (1998). "Seasonal
Patterns in the Fish and Crustacean Community of a Turbid Temperate Estuary
(Zeeschelde Estuary, Belgium)." Estuarine, Coastal and Shelf Science
47: 143-151.
P. Meire, T.
Y., S. Van Damme, E. Van den Bergh, T. Maris and E. Struyf (2005). "The
Scheldt Estuary: a description of a changing ecosystem." Hydrobiologia
540: 1-11.
Rijn, L. C. V.
(2010). Tidal phenomena in the Scheldt Estuary. LTV Zandhuishuoding Schelde
Estuarium 2010, Deltares.
Stevens,
B. R. a. L. (2008). Motupip Estuary: Vulnerability Assessment and Monitoring
Recommendations.
|
Ahuriri Estuary: Contact
Recreation and Food Gathering Review
|
Attachment 2
|
Ahuriri Estuary:
Contact
Recreation and Food Gathering Review
July 2013
HBRC Report No. EMT 13/10 – 4483
Environmental Science - Water Quality
and Ecology
Ahuriri Estuary:
Contact
Recreation and Food Gathering Review
July 2013
HBRC Report No. EMT 13/10 – 4483
 …………………………………………………………………….
|
Ahuriri
Estuary: Contact Recreation and Food Gathering Review
|
Attachment 2
|
Contents
Executive summary.........................................................................................................................
1 Introduction..........................................................................................................................
2 Methods for assessing contact
recreation and food gathering risk..........................................
2.1 Contact recreation.......................................................................................................
2.2 Food gathering.............................................................................................................
3 Contact recreation.................................................................................................................
3.1 Background..................................................................................................................
3.2 Threats........................................................................................................................
3.3 Current state...............................................................................................................
3.4 State of the Ahuriri Estuary for
contact recreation.........................................................
4 Food gathering......................................................................................................................
4.1 Background..................................................................................................................
4.2 Threats........................................................................................................................
4.3 Current state
4.4 State of the Ahuriri Estuary for
food gathering..............................................................
5 Conclusions and recommendations.......................................................................................
6 Acknowledgements..............................................................................................................
7 Glossary of abbreviations and terms......................................................................................
8 References............................................................................................................................
Appendix A Assessing microbiological water
quality for contact recreation................................
Tables
Table 2‑1: Current water quality guidelines
associated with contact recreation.
Table 3‑1: Current guideline values associated
with water and shellfish quality.
Figures
Figure 1‑1: Ahuriri Lagoon pre-1931 earthquake.
Figure 1‑2: Ahuriri Lagoon post-1931 earthquake.
Figure 1‑3: Drainage channels constructed to the
north and south of the main estuary outfall channel to develop agricultural
land.
Figure 2‑1: Levels of bacterial indicator
Enterococci at Pandora Pond, Ahuriri during the 2012/2013 recreational season.
Figure 2‑2: Turbidity measured in inflows to the
Ahuriri Estuary and within the Ahuriri Estuary.
Figure 2‑3: Turbidity levels at Pandora Pond,
Ahuriri Estuary between 1999 and 2013. n=20 per annum
Figure 2‑4: Sediment chlorophyll a
concentrations in the Ahuriri Estuary between 1998 and 2000.
Figure 2‑5: Chlorophyll a levels of water
samples taken within the Ahuriri Estuary between March and April 2013 (Ahuriri
1-6), and 2006-2013 (Ahuriri at Pandora).
Figure 3‑1: Dead fish being cleared from the
Ahuriri Estuary post- 1931 earthquake.
|
Ahuriri
Estuary: Contact Recreation and Food Gathering Review
|
Attachment 2
|
Executive summary
The Ahuriri Estuary,
Napier is a significant ecological and recreational resource for the
Hawke’s Bay community. It is recognised as a nationally significant
wildlife and fisheries habitat, and a nationally important example of tectonic
processes. Natural and human-induced changes to the estuary over the last
century have considerably changed the estuary form.
As one of the few
sheltered, tidal lagoon estuaries within Hawke’s Bay, Pandora Pond
provides for a number of recreational opportunities including swimming,
kayaking, sailing, and waka ama. These activities can however be
compromised by the presence of faecal contaminants that have the potential to
cause illness. Faecal indicator organisms sampled within the Ahuriri
Estuary may stem from stormwater, overland flow or accidental sewage
discharges.
The estuary is
currently classified as being in ‘fair’ condition in terms of
contact recreation, because it is influenced by inflows with elevated bacterial
concentrations – these may increase the risk of illness to recreational
users of the estuary. Other metrics, such as clarity and algal growth do
not indicate impairment of recreational opportunities as a consequence of
nuisance algal growths.
The Ahuriri Estuary
also provides food gathering opportunities, most commonly for the cockle (Austrovenus
stutchburyi) and various species of flounder. Current information
suggests that shellfish gathered from the estuary may be unsuitable for human
consumption because of elevated faecal indicator bacteria concentrations.
While there is some debate regarding the confidence in current guidelines for
bacterial concentrations in foods harvested recreationally for human
consumption, the inflow of stormwater derived from urban drains and proximity
of shellfish beds to these inflows indicate that the estuary should not be
regarded as safe food-source.
If the community
regards the water and sediment quality within the estuary as impaired for
contact recreation and food-gathering purposes, techniques such faecal source
tracking may assist in identifying the sources of faecal contamination in
targeting appropriate management strategies.
Toxic metal
contamination of shellfish and fish species is currently not at levels expected
to pose immediate health risks. Although it was not within the scope of
this study to assess the indirect effects of contaminants on the abundance and
distribution of edible resources, this was identified as an area for further
investigation.
|
Ahuriri
Estuary: Contact Recreation and Food Gathering Review
|
Attachment 2
|
1 Introduction
As they form the
interface between land and sea, estuarine habitats are unique, distinctive and
dynamic environments. They experience rapid chemical and physical changes
over tidal cycles, yet provide some of the most important and diverse habitats
supporting bird roosting, feeding and breeding, fish spawning and nursery
grounds, and ecological services that help to sustain environmental quality and
integrity. They are productive habitats, and play an important role in
water regulation and nutrient cycling.
 In a region dominated by alluvial flood plain river
mouths, the Ahuriri Estuary (Te Whanganui-a-Orotu) represents one of the few
tidal lagoon estuaries in Hawke’s Bay. Formed in the wake of the
1931 earthquake, the Ahuriri Estuary is the remnants of the former Ahuriri
Lagoon (Figure 1-1). The earthquake resulted in an uplift of between 1 -
2 metres, exposing approximately 1300 ha (Figure 1-2) (Chague-Goff et al.,
2000). Drainage and reclamation following the earthquake has reduced the
area to its current size of approximately 470 ha of true estuary, and around
175 ha of associated wetlands (Figure 1-3; (Comerty, 1996).
In a region dominated by alluvial flood plain river
mouths, the Ahuriri Estuary (Te Whanganui-a-Orotu) represents one of the few
tidal lagoon estuaries in Hawke’s Bay. Formed in the wake of the
1931 earthquake, the Ahuriri Estuary is the remnants of the former Ahuriri
Lagoon (Figure 1-1). The earthquake resulted in an uplift of between 1 -
2 metres, exposing approximately 1300 ha (Figure 1-2) (Chague-Goff et al.,
2000). Drainage and reclamation following the earthquake has reduced the
area to its current size of approximately 470 ha of true estuary, and around
175 ha of associated wetlands (Figure 1-3; (Comerty, 1996).
Figure 1-1: Ahuriri
Lagoon pre-1931 earthquake.
Source: Hawke's Bay
Museum.
Figure 1-2: Ahuriri
Lagoon post-1931 earthquake.
Source: Hawke's Bay Museum.
Despite extensive
modification, reclamation, drainage and discharges, the estuary is recognised
as an area of regional and national significance, with high wildlife and
fisheries values. The estuary provides important feeding area for 20
species of trans-equatorial migrants (waders and terns), six Australian species
(herons, ibises and duck), and a number of native species including white heron
and royal spoonbill (Knox, 1979). Additionally, the estuary makes a significant
contribution to Hawke’s Bay marine fisheries, supporting approximately 29
species of fish during some stage of their life cycle. Some species (e.g.
kahawai, grey mullet, yellow-bellied flounder, stargazer and parore) use the
area for feeding, and around 11 species use the area as a nursery or spawning
ground. These include commercially important species such as
yellow-bellied flounder, grey mullet, sand flounder, common sole, and
yellow-eyed mullet (Kilner and Akroyd, 1978).
|
|
 |
Figure 1-3: Drainage
channels constructed to the north and south of the main estuary outfall channel
to develop agricultural land.
Source: Hawke's Bay Museum.
Ahuriri Estuary is
listed as a Significant Conservation Area under the Regional Coastal
Environment Plan (HBRC, 2012), a Wetland of Ecological and Representative
Importance (WERI), and a Site of Special Wildlife Interest (SSWI) (Henriques,
1990). A Wildlife Refuge status protects the areas between the Southern
Marsh, Westshore Lagoon and the estuary, from the low level bridge to Pandora
Pond.
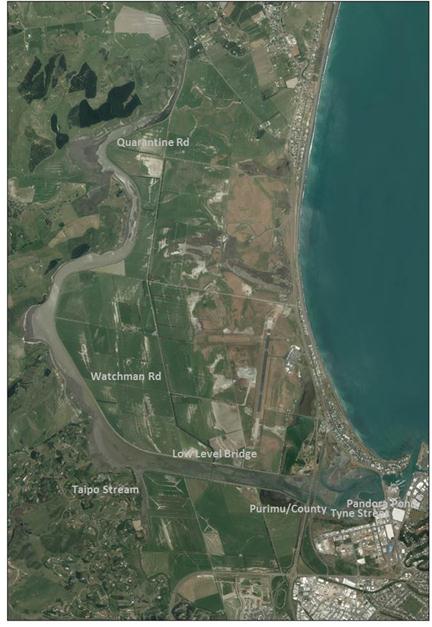
Figure 1‑4: Ahuriri
Estuary, Napier 2006.
|
Ahuriri
Estuary: Contact Recreation and Food Gathering Review
|
Attachment 2
|
2 Methods
for assessing contact recreation and food gathering risk
2.1 Contact
recreation
“Contact
recreation” includes any activity that causes people come into contact
with water where a reasonable risk of inhaling or ingesting water exists.
At times, the suitability of water for recreation may be compromised by the
presence of human or animal faecal material resulting from land run-off,
discharges or from natural populations of animals or birds. During these
events, water may contain pathogens from this faecal matter. The risk of
contracting illnesses such as gastro-enteritis, respiratory illnesses,
Hepatitis A, giardiasis, cryptosporidiosis, campylobacterosis, and
salmonellosis increases as the risk of exposure to pathogenic organism
increases (MfE and MoH, 2003).
From an aesthetic
point of view, water clarity can be an important consideration for people
undertaking recreational activities. Although not as important in marine
waters which tend to be naturally more turbid, freshwater recreation choice can
be influenced by visual clarity.
Visual clarity
(determined by black disk visibility), is not generally measured in marine or
estuarine waters. Turbidity, a measure of the amount of light scattered
or absorbed by particles in the water, is more commonly used in New Zealand
coastal water quality monitoring programmes. An inverse relationship can
generally be demonstrated between turbidity and visual clarity.
Generally, if turbidity meets the requirements for aquatic ecosystems, it is
likely to meet the aesthetic value for contact recreation as well.
High algal biomass can
influence aesthetic values associated with contact recreation. High algal
biomass may reduce the visual clarity of the water by making it more turbid, or
by changing the colour of the water, creating ‘murky’ or
discoloured water. Human health risk associated with contact recreation may be
increased if toxic species are present. Increased nutrient inputs from
either land or marine sources can influence (increase) algal biomass growth
rates.
Current guidelines for
the attributes associated with contact recreation are detailed in Table 2-1.
Table 2-1: Current
water quality guidelines associated with contact recreation.
cfu = colony forming units, NTU = Nephelometric turbidity units, BD = black
disk.
|
Attribute
|
Guideline
value1
|
Source
|
Value
|
|
Satisfactory
|
Unsatisfactory/
Unacceptable
|
|
Enterococci (cfu/100 mL)
|
<280 cfu/100 mL
|
>280 cfu/100 mL
|
(MfE and MoH, 2003)
|
Human health
|
|
Turbidity (NTU)
|
0.5-10 NTU
|
>10 NTU
|
(ANZECC, 2000)
|
Aquatic ecosystems
|
|
Visual clarity (BD)
|
>1.6 m
|
<1.6 m
|
(MfE, 1994)
|
Aesthetic and safety
|
|
Chlorophyll a (g/m3)
|
<4 µg/L
|
>4 µg/L
|
(ANZECC, 2000)1
|
Aquatic ecosystems
|
|
Toxic algal species (cells/mL)
|
Absent
|
Present
|
‑
|
Human health and aquatic ecosystems
|
1These guidelines
refer to ANZECC 2000 for South-Eastern Australia which is used in the absence
of New Zealand specific estuarine guidance.
2.2 Food
gathering
With the exception of
overlying water quality, comparatively little information or guidance exists
around the risk associated with recreational harvesting of shellfish and
fish. Export food safety guidelines are applied in the absence of
recreational specific guidelines; however it is acknowledged that this appears
to be an area for further work or development.
For shellfish
gathering the attributes likely to compromise the ability to collect shellfish
include contamination by faecal material that may contain pathogens. Additionally,
the ability of shellfish and fish to accumulate contaminants such as trace
metals and other industrial and stormwater related toxins, means that these
parameters are also used to assess risks associated with food gathering.
Current guidelines for
the attributes associated with shellfish/fish gathering are detailed in Table 2-2.
Table
2-2: Current
guideline values associated with water and shellfish quality.
MPN =
Most Probable Number.
|
Attribute
|
Guideline
|
Source
|
Relevance
|
|
Satisfactory
|
Unsatisfactory/
Unacceptable
|
|
Faecal coliforms in overlying
waters
|
Seasonal median <
14 MPN/100mL
< 10%
of samples < 43MPN/100mL
|
Seasonal median > 14
MPN/100mL
> 10% of samples >
43MPN/100mL
|
(MfE and MoH, 2003)
|
Human Health
|
|
Toxic algal species in
overlying waters
|
Not present
|
Present
|
Nil
|
Human Health and Aquatic
Ecosystems
|
|
E. coli in
shellfish flesh
|
Median < 230
MPN/100g and
< 10%
of samples < 700 MPN/100g
|
Median > 230 MPN/100g and
> 10% of samples > 700
MPN/100g
|
(NZFSA, 1995)
|
Human Health
|
|
Trace metals
|
Below FSA guidelines
|
Above FSA guidelines
|
|
Human Health
|
|
Ahuriri
Estuary: Contact Recreation and Food Gathering Review
|
Attachment 2
|
3 Contact
recreation
Like many
Hawke’s Bay rivers and lagoons, the Pandora Pond (or Humber Street Pond)
within the Ahuriri Estuary provides recreational opportunities, including
swimming, kayaking, sailing, and waka ama. This is perhaps one of the
highest profile uses of the estuary, along with birdwatching, and its
accessibility makes recreation a dominant use and value for the estuary.
The Pandora Pond was
created when sediment was excavated in 1977 to provide fill for the cargo
handling area in the Port of Napier (Lee, 1977). This created a pond that
provided Napier residents with an easily accessible, enclosed area for
recreational and boating activities suitable for families. On an exposed
coastline such as Hawke’s Bay, this area provides important opportunities
for aquatic recreation.
3.1 Background
Use of an area for
contact recreation can be driven by a number of external factors such as
climate, proximity from home and the physical characteristics of the
recreational site (Madarasz-Smith, 2010). Increasingly water quality is
becoming a prevalent deciding factor in people’s choice of recreational
areas. The key attributes that may affect water quality, and therefore
affect people’s recreational experience, include the risk of illness from
faecal contamination (bacteria and pathogens), water clarity, the extent of
algal coverage and the general amenity value or mauri of the area. This
report focusses on the first three key attributes - while recognising that
general amenity or mauri is important, it falls outside the scope of this
report.
3.2 Threats
Faecal material can
enter water via stormwater, overland flow or accidental sewage
discharges. Within the Ahuriri estuary, faecal contamination has been
demonstrated to have resulted from all of the above at various times.
Farming within the upper catchment can contribute bacteria by overland flow
during periods of rain and stock watering, stormwater and land drainage
discharges occur regularly throughout the middle and lower estuary (Rycroft,
2000), and accidental sewerage discharges have occurred infrequently in the
past. While sewerage discharges are more likely to cause high
concentration of potentially pathogenic organisms and immediate health risks,
these tend to be short-lived and well communicated. The overall risk to
public health associated with sewer overflows may be therefore be lower than
the risks associated with less obvious but more frequent inputs such as diffuse
runoff from agricultural lands and stormwater.
Several studies have identified variable and at times poor water
quality within the Ahuriri Estuary. In general high numbers of bacteria
were found in upstream reaches of the estuary and in drains, most likely due to
lower levels of dilution by seawater (Hooper, 1989), or following periods of
heavy rain (Fenton, 1997). In the lower estuary, water entering the
estuary may contain high concentrations of faecal bacteria at times (e.g. Tyne
Street Drain (30-2000 FC/100 mL (Hooper, 1989) where FC = faecal coliforms).
|
Ahuriri
Estuary: Contact Recreation and Food Gathering Review
|
Attachment 2
|
3.3 Current
state
3.3.1 Faecal
bacteria
National guidelines
identify concentrations at which the risk of illness associated with contact
recreation is no longer considered acceptable (MfE and MoH, 2003). This
allows the public to be informed of the health risks, and make informed
decisions regarding their exposure to these risks (see Appendix A for an
explanation of these guidelines).
The results of routine
sampling at the Pandora Pond, the most popular site within the estuary, has
provided good quality information regarding the risks associated with contact
recreation at this site. The pond is partially enclosed by a barrier arm,
creating a hydrodynamic environment that favours exchange of water on the
incoming tide (refreshed with saltwater), rather than the outgoing tide
(refreshed with freshwater) (Eyre, 2009). These characteristics suggest
that this area is likely to be protected from faecal contamination arising from
freshwater inflows outside of the pond.
Pandora Pond has been
monitored as part of Councils Recreational Water Quality Monitoring programme
since 1996. Since the 2008/09 season, the indicator has remained
enterococci, allowing trends over time to be established from this date.
During 2012/13, the
pond was sampled for enterococci (as an indicator of faecal contamination),
electrical conductivity (as a proxy for salinity), turbidity and
temperature. During this period the site achieved 90% compliance with MfE
and MoH (2003) guidelines, indicating that for 18 out of the 20 weeks sampled,
the risk of illness associated with contact recreation at this site was
low. For two weeks however, elevated levels of bacteria (>280 cfu/100
mL) meant that the risk of illness was considered ‘unacceptable’
(Figure 3-1). Both of these occasions occurred after periods of
significant rain (11 mm 24th and 25th December and 9 mm 7th
January), indicating that surface runoff can impact water quality at this
site. Given the hydrodynamic regime described above, localised sources
should be investigated to determine their role in elevated bacterial
concentrations following rainfall events.
|
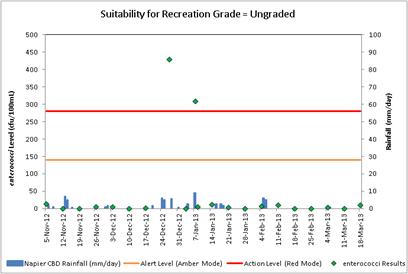
|
Figure 3-1: Levels
of bacterial indicator Enterococci at Pandora Pond, Ahuriri during the
2012/2013 recreational season.
Weekly monitoring
provides important information regarding the current state of water quality
within Pandora Pond. However, the timing of such information limits our
ability to assess the public health risk associated with contact recreation
because much of the information only becomes available after the period
of risk has occurred. This situation arises because the results of
analysis only become available 24-36 hours after the samples are collected
– during this period, the risk associated with contact recreation is unknown
and individuals may be exposed to elevated concentrations of pathogenic
organisms. To overcome this limitation, the 2003 guidelines incorporate
an approach that couples historical data with a catchment risk assessment to
generate a ‘Suitability for Recreation Grade’ (SFRG). The
SFRG is designed to provide a general indication of recreational water quality
of a water body at any time, rather than in response to the result from a
single sampling event.
A suitability for
recreation grade for Pandora Pond was generated at the completion of the
2012/13 season:
§ A
moderate catchment risk was obtained, indicating potential contamination
from sources such as stormwater, rural runoff, birds, land drainage and boat
mooring
§ A
microbiological assessment category of ‘C’ was obtained,
indicating that elevated bacteria concentrations can occur at times
§ Pandora
Pond achieved a ‘Fair’ SFRG.
This grading indicates
that the area is generally suitable for swimming, although caution should be
taken if there has been heavy rainfall, or if the water appears discoloured
(MFE and MOH, 2003).
3.3.2 Clarity/Turbidity
Turbidity within the
estuary has been assessed for a number of discrete projects over the last
decade. The most comprehensive data record exists for the period between
1995 and 1998. These data characterise the water quality of the Ahuriri
Estuary and the inflows to the estuary. These data were compared with the
results from a previous survey (Hooper (1989)) in Fenton (1997).
The turbidity in
waterways flowing in to the Ahuriri Estuary generally exceed guidelines for New
Zealand lowland streams (5.4 NTU (ANZECC, 2000); Figure 3-2, left). At
times, and within certain sub-catchments, turbidity can be extremely high;
however they appear to be somewhat buffered within the estuary with only a few
sites exceeding guidelines for marine and estuarine waters (Figure 3-2,
right). Typically higher turbidity values are observed in the upper
reaches of the estuary (Quarantine and Watchmen Rd), with elevated values at
sites in proximity to incoming waterways (e.g. Low level bridge, Tyne
Street). In general turbidity in the mid to lower estuary is within, or
close to, guideline values for aquatic ecosystems (10 NTU). These values
are unlikely to negatively impact on contact recreation except during periods
of heavy rainfall, when turbidity may transiently reach values of 130 NTU.
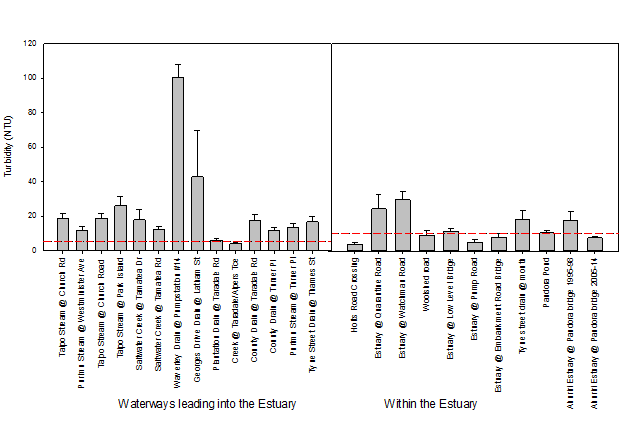
Figure 3-2: Turbidity
measured in inflows to the Ahuriri Estuary and within the Ahuriri Estuary n=4-37
Red line = ANZECC trigger levels for aquatic ecosystems for freshwater (left)
and estuaries (right).
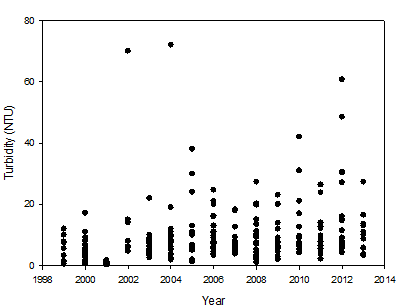
Figure 3-3: Turbidity
levels at Pandora Pond, Ahuriri Estuary between 1999 and 2013. n=20 per annum
The data described
above was collected mainly during the period 1995-98, with more recent data
restricted to the Pandora Bridge site. The Pandora Pond however has
consistently been monitored for turbidity since 1999 as part of the
Recreational Water Quality Monitoring programme. With the exception of
2004, no significant increase or decrease in turbidity has been observed
(Figure 3-3).
Therefore, the
turbidity at the Pandora Pond site does not appear to have significantly
changed since 1998.
3.3.3 Algae
Algae, both
macroscopic (large, found on the sediment surface), and microscopic (small,
plants found within the water column and on the sediment), are normal
constituents of a healthy estuarine ecosystem. In areas of high nutrient
loading however, algal numbers or cover can become excessive, causing nuisance
growths in terms of visual amenity, as well as negatively influencing sediment
quality and water chemistry.
Macroalgae
The largely
channelised nature of the Ahuriri Estuary minimises the likelihood of prolific
algal growths. In depositional areas (where flow is less rapid or obvious),
algal growth has generally been restricted to small patches of ephemeral
species (e.g. Ulva sp.) during the spring/summer period, persisting at
times through to autumn.
Given the nature of
the estuary and the moderate sediment nutrient concentrations, prolific algal
growth that would adversely affect contact recreation within the lower estuary
area (more commonly used for contact recreation) is unlikely.
Chlorophyll
a
A few previous studies
have detailed the nutrient status of the Ahuriri Estuary waters. These
identified that inflows to the estuary have delivered high concentrations of
both phosphorus and nitrogen into the main, ‘true’ estuary (Fenton,
1997, Hooper, 1989). Although the estuary has previously been described
as eutrophic (Hooper, 1989, Knox, 1979), the decrease in phosphorus
concentrations measured between 1989 and 1997 and currently indicate that the
trophic state of the waters may have decreased more recently. Conversely,
nitrogen concentrations (particularly ammoniacal nitrogen) appear to have
increased over the period 1989 – 2013 (Fenton, 1997, Hooper, 1989).
The current trophic status of estuarine waters, including the contributions of
nutrients from various inflows and land-uses should be investigated further.
That said, chlorophyll
a concentrations on estuarine sediments were assessed as part of a
specific water quality study in 1998 and 2000 (Figure 3-4). These data
can provide important information regarding the relative nutrient status
of inflows to the estuary. This work highlighted the role of inflows in
determining overall quality of estuarine water.
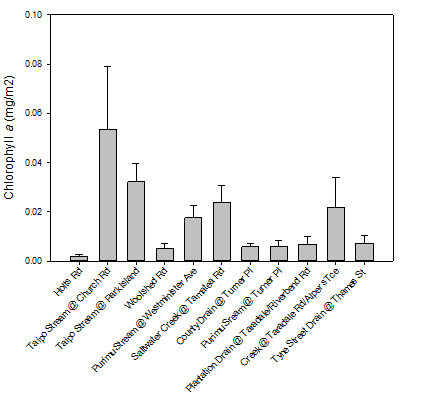
Figure 3-4: Sediment
chlorophyll a concentrations in the Ahuriri Estuary between 1998 and
2000.
More recently,
sampling in the Ahuriri Estuary has been undertaken as part of:
§ the
Nearshore Coastal Water Quality Monitoring Programme (at Pandora Bridge),
§ the
Estuarine Water Quality Monitoring programme to support policy development (at
six locations between Watchman Rd and Pandora Bridge) (waters),
§ the
Estuarine Ecological Monitoring Programme (sediments collected at multiple
locations across the estuary).
The waters of the
upper estuary appear to be fairly eutrophic, consistent with the findings of
previous reports. However by approximately the middle of the estuary, chlorophyll
a levels have dropped below trigger levels, indicating that dilution and
flushing from marine waters is moderating nutrient concentrations and algal
growth (Figure 3-5).
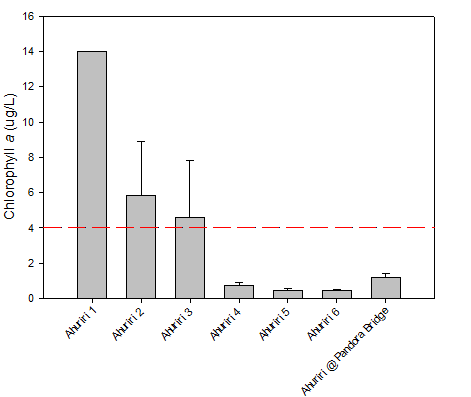
Figure 3-5: Chlorophyll
a levels of water samples taken within the Ahuriri Estuary between March
and April 2013 (Ahuriri 1-6), and 2006-2013 (Ahuriri at Pandora). Redline
= ANZECC trigger value for south-east Australian estuaries.
From a contact
recreation perspective, waters of the Ahuriri Estuary are unlikely to support algal
growth to an extent that would impair contact recreation. This assessment
excludes the periodic and transient blooms which can significantly increases
chlorophyll a concentrations and reduce visual clarity. Such
events are infrequently reported for the Ahuriri Estuary.
Harmful
algal blooms (HABs)
Harmful algae blooms
(and associated marine biotoxins) occur infrequently in Hawke Bay and estuarine
areas. These are defined as species that may release toxins (e.g. Gymnodinium
catenatum, Pseudonitzchia, Karenia, Dinophysis) which can be harmful if
ingested via water or contaminated shellfish, resulting in serious
illness. Additionally, species may be present in bloom numbers that do
not produce toxins, but cause irritation to the eyes or skin. These blooms
may also have environmental impacts, such as depletion of dissolved oxygen
concentrations in the water column.
Marine biotoxins were
routinely monitored by the Public Health Unit on behalf of the Food Safety
Authority until recently, when this function was transferred to the Ministry of
Primary Industry (MPI). During autumn 2005 and 2006, significant parts of
the Hawke’s Bay coastline were closed due to the presence of marine
biotoxins. In August 2012, a large and persistent bloom of Akashiwo
sanguine (red tide) was observed along most of the east coast of the North
Island, and in the following month a bloom of Pseudo-nitzschia spp.
(produces the neurotoxin domoic acid) was observed off Napier; this bloom also
included the red tide, Mesodinium rubrum. During these times,
contact recreation would have been discouraged along coastal beaches or
estuaries affected by these organisms.
3.4 State
of the Ahuriri Estuary for contact recreation
Based on information
derived from various monitoring programmes operated by Hawke’s Bay
Regional Council, the Ahuriri Estuary may be considered as “fair”
for contact recreational purposes (see appendix one). This grading
indicates that:
§ Ahuriri
Estuary waters are generally suitable for swimming.
§ Elevated
bacteria concentrations can occur at times.
§ Caution
is required during periods of heavy rain or when the water appears discoloured.
Faecal contamination
of the estuary is associated with stormwater inflows, runoff from rural land
uses and direct deposition of faeces by the high numbers of birds for which the
estuary is valued. Throughout the summer period when water quality
monitoring indicates an elevated risk of illness due to high numbers of faecal
bacteria, the Regional Council work in collaboration with the Public Health
Unit of the Hawke’s Bay District Health Board to inform the public of the
risk through signage and media releases.
Sewage discharges may
cause infrequent problems; these are not considered to be a persistent problem.
Should the community
express a desire for improved water quality, application of techniques such as
faecal source tracking would be useful in identifying the sources of faecal
indicator organisms, which in turn would allow management strategies to be
targeted on these sources.
Other water quality
metrics, such as visual clarity and algal growth do not generally impair
recreational values.
|
Ahuriri
Estuary: Contact Recreation and Food Gathering Review
|
Attachment 2
|
4 Food
gathering
4.1 Background
The Ahuriri Estuary
has traditionally been an important food source for local hapu and
whanau. Maori occupation dates back as far as the 12th
century, and the estuary was used not only to provide food to the local area,
but also as a resource that aided in the development of trade and social
relationships with neighbouring hapu (Black and Ataria, 2008).
Prior to the 1931
earthquake (which dramatically altered the physical nature of the estuary), the
estuary was used to collect fish (mullet, kahawai, flounder, herring),
shellfish (freshwater mussel, crayfish, mussel, horse mussel, pipi, mud snail,
periwinkle, cockles), and eels. However, in the aftermath of the
earthquake and due in part to drainage, reclamation, diversion and development,
the species distribution and abundance within the estuary was significantly
altered (Black and Ataria, 2008).
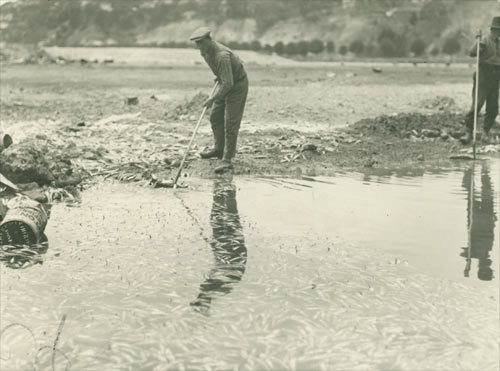
Figure 4-1: Dead
fish being cleared from the Ahuriri Estuary post- 1931 earthquake.
Source:
Hawke's Bay Museum.
More recently the
estuary has continued to provide valuable food resources for Napier
residents. The collection of cockles (Austrovenus stutchburyi) and
flounder is widespread within the estuary, with Yellowbelly founder (Rhombosolea
leporine), Sand flounder (Rhombosolea plebeian), Yellow-eyed mullet
(Aldrichetta forsteri), and Grey mullet (Mugil cephalus) all
common in the lower estuary (Ataria et al., 2008).
4.2 Threats
As filter feeders,
cockles filter large volumes of water, ingesting the small plants living in the
water for nutrition. They are therefore highly susceptible to the
contaminants present both in the water, and attached to any particulates they
ingest from the water column. They also have the potential to accumulate
contaminants associated with particulate material within their gut. In
turn, humans consuming whole cockles collected within these waters will ingest
any contaminants that have been retained within the cockle gut. Similarly,
flounder can ingest sediment particles during feeding, which makes them
vulnerable to accumulating contaminants from sediment. For this reason,
both cockles and flounder may be used to assess general environmental contamination.
Contaminants likely to
affect food gathered within the Ahuriri Estuary may enter the water and
sediments in the estuary through similar pathways to the contaminants likely to
impair contact recreation. Sources of faecal contaminants that can make
shellfish unsuitable for harvesting are described in section 3.2. The
quality of shellfish and fish harvested from the estuary may be compromised by
unacceptable concentrations of contaminants (including trace metals as
indicators of pollution) arising from stormwater discharges. Stormwater
derived from residential subdivisions may contain elevated concentrations of
copper from plumbing fittings, and zinc from roofing material, as well as
several other toxic metals associated with road runoff. Stormwater
derived from industrial areas have also been shown to contribute elevated
levels of toxic metals to waterways – these may accumulate in sediments
within the waterways, (Smith, 2011), as well as sediments within the estuary
itself (Smith, 2010).
Previous studies have
highlighted the impact that accidental discharges of chemicals from industry
may have on shellfish quality. Concentrations of chromium and lead within
the Tyne Street drain were deemed ‘unacceptable’, and at levels ‘well
above’ New Zealand averages for estuaries (Hooper, 1989). A spill
of the timber treatment chemical Tanalith NCA in 1987 resulted in
concentrations of chromium in cockles that were 60% higher than in adjacent
area (Hooper, 1989). It is likely that episodes of acute industrial
discharge, as well as more pervasive discharges of trace amounts of these
metals, may contribute to elevated concentrations of toxic metals within
shellfish and fish.
When assessing the
changes associated with food gathering, it is necessary to consider:
1) The presence or
absence of contaminants in edible resources, as well as
2) How contaminant
profiles may indirectly affect the likelihood of encountering an edible
resource e.g.:
a. numbers may be
reduced by impairment of habitat type and quality, or
b. an increase or
reduction in prey species may decrease or increase the numbers of edible
species.
Assessment of these
factors is not within the scope of the current study, but this requirement has
been identified for further consideration.
|
Ahuriri
Estuary: Contact Recreation and Food Gathering Review
|
Attachment 2
|
4.3 Current
state
4.3.1 Faecal
bacteria
The Microbiological
Water Quality Guidelines provide guidance regarding an the level of faecal
coliform contamination in waters during a shellfish gathering season (MfE and
MoH, 2003). These guidelines indicate that over a season:
§ median
faecal coliform concentrations should not exceed 14 MPN (Most Probable Number)
/100 mL, and/or
§ for
90% of samples, faecal coliform concentrations should not exceed 43 MPN/100
mL.
These guideline values
are based on the 1995 Ministry of Agriculture and Forestry ‘Shellfish
Quality Assurance Circular’ and the 1992 Department of Health
‘Provisional microbiological water quality guidelines for recreational
and shellfish-gathering waters in New Zealand’ for export standard
shellfish.
Recent concerns
regarding appropriateness of these guidelines was incorporated into a review
document produced for MfE (Bolton-Ritchie et al., 2013), this has resulted in
working groups being established to address a review of the guidelines by late
2013. More recently the Ministry of Health have stated that they do not
recommend collecting shellfish from areas affected by urban runoff (Paul
Prendergast (MoH) pers.comm.).
That said, HBRC
have collected information on shellfish gathering waters within Ahuriri Estuary
in line with MfE and MoH guidelines (2003) since 2006. The results are
detailed in Table 4-2 below:
Table 4‑1: Levels
of compliance with MfE and MoH guidelines for shellfish gathering waters, in
Ahuriri Estuary.
|
Year
|
Median
concentration (MPN /100mL)
|
Proportion
of samples
>43 MPN/100 mL
(%)
|
Compliant
with guideline values?
|
|
2006/07
|
9
|
20
|
No
|
|
2007/08
|
14
|
10
|
Yes
|
|
2008/09
|
10
|
5
|
Yes
|
|
2009/10
|
14
|
20
|
No
|
|
2010/11
|
39
|
40
|
No
|
|
2011/12
|
5
|
20
|
No
|
|
2012/13
|
3
|
0
|
Yes
|
The compliance of
waters in the Ahuriri Estuary with seasonal guidelines for water quality at
shellfish gathering sites is variable (Table 4-2). This variability
exemplifies one of the underlying concerns with the current guidelines. This is
that they produce highly variable results for the same shellfish gathering
waters, hindering the ability to provide consistent, reliable communication
regarding the level of risk with the public.
However,
§ the
historic levels of non-compliance and;
§ the
recommendation that shellfish should not be gathered from areas influenced by
urban runoff;
indicate that water
quality in the Ahuriri Estuary should not be considered generally appropriate
for shellfish gathering purposes.
This view is supported
by research completed in the Ahuriri Estuary in 2004, which showed that at
times E. coli concentration in shellfish flesh collected from the
estuary were higher than those considered acceptable for commercial harvest (ESR,
2004). Although guidelines do not currently exist for acceptable E. coli
concentrations in shellfish flesh collected for recreational purposes;
commercial limits may be applied, noting that these are likely to be more
conservative (provide a higher level of protection from infection).
A number of factors
support the need for further investigation of water quality pertaining to
recreational shellfish gathering in the Ahuriri Estuary:
§ The
Ahuriri Estuary is used extensively for recreational fishing and some cultural
harvest
§ Greater
certainty regarding the general suitability of water in the estuary for
shellfish gathering
§ Sources
of faecal contaminants that currently compromise microbiological water quality
need to be identified and targeted for remedial action.
4.3.2 Toxic
metals
Toxic metals are
delivered to the estuary (water and sediments) through numerous waterways that
discharge stormwater to the estuary (Ataria et al., 2008, Hooper, 1989, Smith,
2010, Smith, 2011). Concentrations of metals in the water column and
sediments may render shellfish and fish unsuitable for consumption.
Shellfish flesh
(cockles) was previously tested as part of a study into the effects of boat
maintenance and repair facilities on sediments in the Inner Harbour (Strong,
2005). This report showed that levels within shellfish flesh fell within
guidelines for human consumption, and so were unlikely to pose a risk for human
health. More recently, a review undertaken in association with Te
Taiwhenua a Te Whanganui-a-Orotu comprehensively assessed the concentrations of
industrial and stormwater contaminants in the sediments of the Ahuriri Estuary,
as well as within shellfish and fish flesh (Ataria et al., 2008). This
investigation showed that at the time of the study, the risk to human health
associated with consumption of cockles and yellowbelly flounder could be
considered negligible. For example, it would be necessary to consume 6 kg
of cockles or 11 kg of flounder per day to exceed the tolerable limit for zinc,
and 11 kg of cockles or 123 kg of flounder to exceed the tolerable daily intake
limit for copper.
Ataria et. al. (2008)
noted that for tangata whenua, the presence of contaminants in the water from
discharges, even at levels considered safe in relation to food safety
standards, was regarded as unacceptable.
|
Ahuriri
Estuary: Contact Recreation and Food Gathering Review
|
Attachment 2
|
4.4 State
of the Ahuriri Estuary for food gathering
There is relatively
little information regarding the state of food resources within the Ahuriri
Estuary. While Hawke’s Bay Regional Council undertakes monitoring
of waters overlying popular shellfish gathering areas, comparing measured
concentrations with national guideline values, there is some concern regarding
the relevance and applicability of these guidelines for assessing the risks to
human health. Available information has been derived from single study
events of variable duration and robustness. The most comprehensive study
undertaken to date related the effects of stormwater contaminants on edible
shellfish resources.
In general, shellfish
gathered within the Ahuriri Estuary are likely to contain relatively elevated
faecal contaminant concentrations. Further work is required to assess
whether current contaminant concentrations do restrict this activity, and how
these relatively elevated concentrations may be reduced.
Although shellfish and
fish gathering is not compromised by levels of contamination that constitute
immediate health risks, the presence of stormwater contaminants is likely to
impose a barrier to food gathering by tangata whenua.
|
Ahuriri
Estuary: Contact Recreation and Food Gathering Review
|
Attachment 2
|
5 Conclusions
and recommendations
This report describes
the current state of knowledge for the factors likely to influence contact
recreation and food gathering within the Ahuriri Estuary.
The estuary may be
considered fair for contact recreation, recognising that at times inputs of
faecal material may contribute to high concentrations of faecal bacteria at the
Pandora Pond site.
Should contact
recreation be considered as compromised by faecal contamination, and a desire
exist to improve water quality, techniques such as faecal source tracking would
assist in identifying source areas and in focusing management or remedial
measures.
Little information
exists regarding the impact of land-use on food resources within the
estuary. Existing information indicates that concentrations of toxic
metals in edible resources harvested in the estuary do not currently constitute
a risk to human health. The elevated concentrations of contaminants observed
in the inflows to the estuary indicate that there is a potential for adverse
impacts on edible resources – this is an issue that needs to be
considered in future.
Faecal contamination
of resources indicates that the estuary should not be considered
suitable as a safe source of shellfish for human consumption. Further
work is required at a national level to develop appropriate guidance on
assessing the risks of shellfish gathering to recreational fishers.
Regardless, the
Ahuriri Estuary does support a significant recreational fishery and further
work is required to quantify the public risk associated with consumption of
food harvested from the estuary. At this stage it is unclear where
responsibility for this assessment lies (Public Health Unit, Food Safety
Authority (MPI), or Regional Council). Continuing monitoring of toxic
metals, other chemical contaminants and faecal indicator bacteria within edible
resources (cockles and flounder) in the estuary is recommended to better assess
human and ecological health risks, inform public health and identify
appropriate catchment management actions that will achieve community objectives
for the area.
|
Ahuriri
Estuary: Contact Recreation and Food Gathering Review
|
Attachment 2
|
6 Acknowledgements
The author wishes to
acknowledge the reviewers for comments made on the draft report and the
Hawke’s Bay Museum for images used within the report.
7 Glossary
of abbreviations and terms
|
cfu
|
Coliform Forming Units
|
|
E. coli
|
Esherichia coli
|
|
HAB
|
Harmful Algal Bloom
|
|
HBRC
|
Hawke’s Bay Regional Council
|
|
MfE
|
Ministry for the Environment
|
|
MoH
|
Ministry of Health
|
|
MPI
|
Ministry of Primary Industries
|
|
MPN
|
Most Probably Number
|
|
NTU
|
Nephelometric Turbidity Units
|
|
SFRG
|
Suitability for Recreation Grade
|
|
Ahuriri
Estuary: Contact Recreation and Food Gathering Review
|
Attachment 2
|
8 References
ANZECC (2000)
Australian and New Zealand Guidelines for Fresh and Marine Water Quality 2000.
ANZECC and ARMCANZ (eds), Australian and New Zealand Environment and
Conservation Council, Australia.
Ataria, J., Tremblay,
C., Tremblay, L., Black, M., Kaukau, M., Kemp, R. and Mauger, J. (2008) He
Moemoea mo Te Whangaui-a-Orotu: A vision plan.
Black, M. and Ataria,
J. (2008) Napier Estuary Literature Review, p. 31, Landcare Research, Lincoln,
New Zealand.
Bolton-Ritchie, L.,
Greenfield, S., Madarasz-Smith, A., Milne, J., Stevenson, M. and Walker, J.
(2013) Recreational Water Quality: A practitioner's discussion on the
limitations of the 2003 national guidelines.
Chague-Goff, C.,
Nichol, S.L., Jenkinson, A.V. and Heijnis, H. (2000) Signatures of natural
catastrophic events and anthropogenic impact in an estuarine environment, New
Zealand. Marine Geology 167, 285-301.
Comerty, P.S., D.A.
(1996) A directory of wetlands., p. 395, Department of Conservation,
Wellington.
ESR (2004) Ahuriri
cockle results, p. 1, ESR, ESR.
Eyre, T.M. (2009) The
Sediment Dynamics of Ahuriri Estuary, Napier, New Zealand, University of
Waikato & Universitat Bremen, Hamilton, New Zeland.
Fenton, J.A. (1997)
Ahuriri Estuary Water Quality: Review of water quality in the estuary and
catchment area, p. 69, Blue Tear Environmental, Napier, New Zealabnd.
HBRC (2012) Hawke's
Bay Regional Coastal Environment Plan, HBRC.
Henriques, P.R.,
Binmore, H., Grant, N.E., Anderson, S.H., Duffy, C.A.J. (1990) Coastal Resource
Inventory First Order Survey: Hawke's Bay Conservancy, p. 78 + Department of
Conservation, Wellington.
Hooper, G. (1989)
Ahuriri Estuary Water Quality Study, p. 37 +, Hawke's Bay Regional Council.
Kilner, A.R. and
Akroyd, J.M. (1978) Fish and Invertebrate Macrofauna of the Ahuriri Estuary,
Napier, p. 79, Ministry of Agriculture and Fisheries, Wellington, New Zealand.
Knox, G.A. (1979) Ahuriri
Estuary: An Environmental Study, p. 84, University of Canterbury, Christchurch,
Canterbury.
Lee, J.W. (1977)
Hawke's Bay Harbour Board's Proposal to Dredge Humber Street Pond. Board,
H.s.B.C. (ed), p. 9, Wellington, New Zealand.
MfE (1994) Water Quality
Guidelines No. 2. Environment, M.f.t. (ed), Ministry for the Environment,
Wellington, New Zealand.
MfE and MoH (2003)
Microbiological Water Quality Guidelines for Marine and Freshwater Recreational
Areas, Ministry for the Environment, Wellington.
NZFSA (1995)
Microbiological Limits for Food. Authority, F.S. (ed).
Rycroft, C. (2000)
Napier Inner Harbour & Lower Ahuriri Estuary Point Source Discharges, p.
17, Hawke's Bay Regional Council, Napier, New Zealand.
Smith, S. (2010)
Monitoring of benthic effects of stormwater discharges at sites in the Ahuriri
Estuary: 2010 Survey, p. 52.
Smith, S. (2011) Fate,
transport and extent of sediment associated trace metal contaminants in Napier
urban waterways: Purimu Stream and County Drain, p. 39.
Strong, J. (2005) Antifoulant
and trace metal contamination of the sediments from the Napier Inner Harbour.,
p. 30, EAM Ltd, Napier.
Appendix
A Assessing microbiological water quality for
contact recreation
The
“Microbiological water quality guidelines for marine and freshwater
areas” (MfE and MoH, 2003) were developed to improve the communication of
risk to recreational water users. In a departure from earlier assessments
of recreational water quality, the 2003 guidelines required two related
activities to be undertaken in order to assess suitability for recreational
use:
§ risk
grading, allowing a Sanitary Inspection Category to be assigned to the water
body and associated catchment, and
§ allocation
of a Microbiological Assessment Category, using routine monitoring data.
Combining these
indices allows an overall Suitability for Recreation Grade to be assigned,
which is the basis for informing the public regarding health risks associated
with recreation at a particular location.
Significant monitoring
is required to classify recreational water. A minimum of 20 data should be
acquired over the recreation season. Ideally the classification should be
based on data collected over a five year period. The classification makes
use of 95th percentile concentration values.
Weekly Monitoring
The MfE and MoH (2003)
guidelines also identify two tiers of surveillance activity. These
actions are based on maintaining the risks of infection below identified
thresholds. A “traffic light” coding system is used:
§ in
surveillance mode (green), where concentrations of indicator
organisms in individual samples remain below specific thresholds, routine
monitoring continues.
§ where
the surveillance concentration threshold is exceeded by a single sample result:
− alert (amber) or
− action (red) monitoring modes
commence.
§ sampling
frequency increases (to daily), the source of pollution is investigated and
warning signs may be erected.
The monitoring
thresholds for fresh and saline waters associated with these “traffic
light” are detailed in Table A-1.
Table A‑1: Status
levels and management actions associated with measured faecal indicators and
illness risk. Source
MfE&MoH, 2003
|
Colour code
|
Status
|
Marine waters
(enterococci
/100 mL)
|
Freshwaters
(E. coli
/100 mL)
|
Action
|
|
Green
|
Surveillance
|
All results <140
|
All results <260
|
Continue routine
weekly monitoring
|
|
Amber
|
Alert
|
Single sample result
>140
|
Single sample result
>260
|
Increase to daily
sampling, identify source of contamination
|
|
Red
|
Action
|
2 consecutive sample
results >280
|
Single sample
results >550
|
Increase to daily
sampling, identify source of contamination, erect signs, inform public
|
Suitability for Recreation
Grade (SFRG)
In
order to grade a recreational water body, two activities must occur:
§ the Microbiological
Assessment Category (MAC) must be established from existing or collected
microbiological data; definitions for the different categories are given in
Table 4-3
§ the Sanitary
Inspection Category (SIC) must be established (classifications are Very High,
High, Moderate, Low or Very Low; these refer to risk of contamination and are
determined for a specific water body by using the SIC flow chart provided in
the guidelines (MfE and MoH, 2003).
The
Suitability for Recreation Grade (SFRG) provides five grades (very poor to very
good) that summarise the potential health risk associated with primary
recreation (such as swimming or surfing) at a site. The process for generating
a SFRG is summarised schematically in Figure A-1.
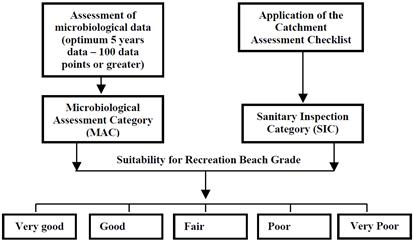
Figure A‑1: Suitability
for recreation grade schematic.
The grades can then be
used to communicate typical risk of contact recreation in a specific
water body to water uses as described in Table A-2.
Table A‑2: Explanation
of suitability for recreation grades.
|
SFRG
|
Description*
|
|
Very Good
|
The site has
generally excellent microbial water quality and very few potential sources of
faecal pollution. Water is considered suitable for swimming for almost all of
the time.
|
|
Good
|
The site is
considered suitable for swimming for most of the time. Swimming should be
avoided during or following heavy rain.
|
|
Fair
|
The site is
generally suitable for swimming, but because of the presence of significant
sources of faecal contamination, extra care should be taken to avoid swimming
during or following rainfall or if there are signs of pollution such as
discoloured water, odour, or debris in the water.
|
|
Poor
|
The site is
susceptible to faecal pollution and microbial water quality is not always
suitable for swimming. During dry weather conditions, ensure that the
swimming location is free of signs of pollution, such as discoloured water,
odour or debris in the water, and avoid swimming at all times during and for
up to three days following rainfall.
|
|
Very Poor
|
The site is very
susceptible to faecal pollution and microbial water quality may often be
unsuitable for swimming. It is generally recommended to avoid swimming at
these sites.
|
* from http://www.mfe.govt.nz/environmental-reporting/fresh-water/suitability-for-swimming-indicator/suitability-swimming-indicator.html).
HAWKE’S BAY REGIONAL COUNCIL
Environment
and Services Committee
Wednesday 11 June 2014
SUBJECT: Statutory Advocacy Update
Reason for Report
1. This paper reports on proposals forwarded to the Regional Council
and assessed by staff acting under delegated authority as part of the
Council’s Statutory Advocacy project between 1 April and 5 June 2014.
2. The Statutory Advocacy project (‘Project 192’) centres
on resource management-related proposals upon which the Regional Council has an
opportunity to make comments or to lodge a submission. These include, but
are not limited to:
2.1. resource consent applications publicly notified by a territorial
authority
2.2. district plan reviews or district plan changes released by a
territorial authority
2.3. private plan change requests publicly notified by a territorial
authority
2.4. notices of requirements for designations in district plans
2.5. non-statutory strategies, structure plans, registrations, etc
prepared by territorial authorities, government ministries or other agencies
involved in resource management.
3. In all cases, the Regional Council is not the
decision-maker, applicant nor proponent. In the Statutory Advocacy
project, the Regional Council is purely an agency with an opportunity to make
comments or lodge submissions on others’ proposals. The Council’s
position in relation to such proposals is informed by the Council’s own
Plans, Policies and Strategies, plus its land ownership or asset management
interests.
4. The summary plus accompanying map outlines those proposals that the
Council’s Statutory Advocacy project is currently actively engaged in.
Decision Making
Process
5. Council is required to make a decision in accordance with Part 6
Sub-Part 1, of the Local Government Act 2002 (the Act). Staff have
assessed the requirements contained within this section of the Act in relation
to this item and have concluded that, as this report is for information only
and no decision is to be made, the decision making provisions of the Local
Government Act 2002 do not apply.
|
Recommendation
1. That the Environment and Services
Committee receives the Statutory Advocacy Update report.
|
|
Helen Codlin
Group
Manager
Strategic
Development
|
|
Attachment/s
|
1
|
Statutory Advocacy Update
|
|
|
|
2
|
Statutory Advocacy Map
|
|
|
|
Statutory
Advocacy Update
|
Attachment 1
|
Statutory Advocacy Update (as at 31 May 2014)
|
Received
|
TLA
|
Map Ref
|
Activity
|
Applicant/
Agency
|
Status
|
Current Situation
|
|
5 December
2013
|
NCC
|
1
|
Plan Change
10 to the Operative City of Napier District Plan.
A community
driven Plan Change to harmonise district wide provisions between the Napier
District Plan with the Hastings District Plan, incorporate the Ahuriri
Subdistrict Plan and update provisions as a result of recent Napier City
Council policy changes and decisions into the Napier District Plan.
|
NCC
|
Notified
|
31
May 2014
· Further
submissions closed Friday 9 May 2014. HBRC staff did not consider that
a Further Submission was required as none of the Submissions received by NCC
contradicted HBRC’s original Submission or raised issues of concern to
this Council.
· In total NCC
received 28 Submissions. It is anticipated that NCC will begin hearings
within the next few months.
· Original
submission period closed on Friday 14 February 2014. The HBRC
submission can be found at HBRC
Submissions
· Previously
informal comments were made by staff on draft content relating to HPUDS and
RPS Change 4.
|
|
8 November
2013
|
HDC
|
2
|
Proposed
Hastings District Plan
Review of the
Hastings District Plan in its entirety. Includes the harmonisation of
district wide provisions between the Napier District Plan with the Hastings
District Plan where relevant..
|
HDC
|
Notified
|
31
May 2014
· Further
submissions closed Friday 9 May 2014. HBRC lodged a Further Submission
on a number of Submissions including on those requesting development in areas
outside of the settlement pattern adopted in HPUDS.
· In total HDC
received 198 Submissions on their Proposed District Plan. It is
anticipated that HDC will begin hearings within the next few months.
· The HBRC
Submission and Further Submission on the HDC Plan Review can be found here HBRC Submissions http://www.hbrc.govt.nz/HBRC-Documents/HBRC
Document Library/20140214 Submission HDC District Plan.pdf
· Prior to the
notification of the Proposed District Plan, HDC released a Draft District
Plan Review on which the Regional Council provided comments. Various
informal comments were made by staff on draft content, particularly relating
to natural hazards, HPUDS and RPS Change4, riparian management.
|
|
1 August 2013
|
NA
|
3
|
Application
under Coastal and Marine (Takutai Moana) Act 2011
Rongomaiwahine has made an
application for a Protected Customary Rights Order and a Customary Marine
Title Order in the general Mahia Peninsular area under section 100 of the
Marine and Coastal Area (Takutai Moana) Act 2011.
|
Rongomaiwahine
(Pauline Tangiora)
|
Notified
|
8
November 2013.
· Council has
opposed the grant of the orders unless the nature and geographical extent of
the orders is specified with sufficient detail to enable the Council to
appropriately understand the effect of the orders sought.
· High Court
has been assessing validity of other parties joining these proceedings. No
additional actions or responses have been required from HBRC since joining
proceedings in late 2013.
|
|
Statutory Advocacy Map
|
Attachment 2
|
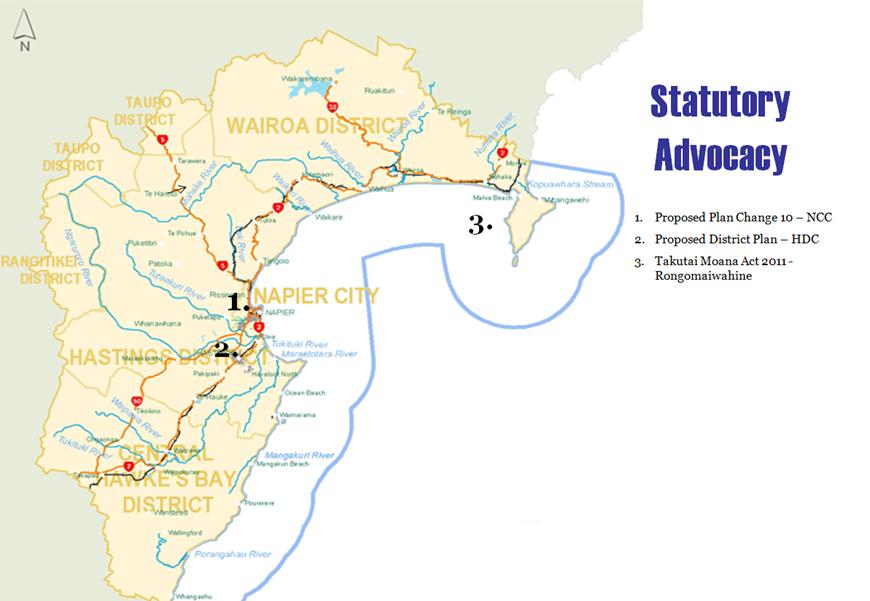
HAWKE’S BAY REGIONAL COUNCIL
Environment
and Services Committee
Wednesday 11 June 2014
SUBJECT: Minor Items Not on the Agenda
Reason for Report
This document has been
prepared to assist Councillors note the Minor Items Not on the Agenda to be
discussed as determined earlier in Agenda Item 6.
|
Item
|
Topic
|
Councillor
/ Staff
|
|
1.
|
|
|
|
2.
|
|
|
|
3.
|
|
|
|
4.
|
|
|
|
5.
|
|
|