Meeting of the Hawke's Bay Regional Council
Date: Wednesday 28 May 2014
Time: 9.00am
|
Venue:
|
Council Chamber
Hawke's Bay Regional Council
159 Dalton Street
NAPIER
|
Agenda
Item Subject Page
1. Welcome/Prayer/Apologies/Notices
2. Conflict
of Interest Declarations
3. Confirmation of
Minutes of the Regional Council Meeting held on 30 April 2014
4. Matters Arising
from Minutes of the Regional Council Meeting held on 30 Apri 2014
5. Follow-ups from
Previous Council Meetings 3
6. Call for Minor
Items Not on the Agenda
7. Napier Port
Presentation (9.30am)
Decision Items
8. Deloitte Peer
Review of HBRIC Ltd RWSS Business Case (10.45am) 11
9. Affixing of Common
Seal 93
10. Register of Members' Interests 95
11. Amendment of Council's
Investment Policy 99
12. HBRIC Ltd 2014-15 Statement of
Intent 105
13. Recommendations from the Maori
Committee 123
Information or Performance Monitoring
14. Hawke's Bay Tourism Quarterly
Report (9.05am) 125
15. Monthly Work Plan Looking
Forward Through June 2014 139
16. Chairman's Monthly Report (to
be tabled)
17. Minor Items Not on the Agenda 145
18. HBRIC
Ltd Discussion of Plan Change 6 (approx 1pm)
HAWKE’S BAY REGIONAL COUNCIL
Wednesday 28 May 2014
SUBJECT: Follow-ups from Previous Council Meetings
Reason for Report
1. Attachment 1 lists items raised at previous meetings that require
follow-ups. All items indicate who is responsible for each, when it is expected
to be completed and a brief status comment. Once the items have been completed
and reported to Council they will be removed from the list.
Decision Making Process
2. Council is required to make a decision in
accordance with Part 6 Sub-Part 1, of the Local Government Act 2002 (the Act).
Staff have assessed the requirements contained within this section of the Act
in relation to this item and have concluded that as this report is for
information only and no decision is required in terms of the Local Government
Act’s provisions, the decision making procedures set out in the Act do
not apply.
|
Recommendation
1. That Council receives the report
“Follow-ups from Previous Council Meetings”.
|
|
Liz Lambert
Chief
Executive
|
|
Attachment/s
|
1
|
Follow-ups
from Previous Regional Council Meetings
|
|
|
|
Follow-ups
from Previous Regional Council Meetings
|
Attachment 1
|
Follow-ups
from previous Regional Council Meetings
Meeting Held 30 April 2014
|
|
Agenda Item
|
Action
|
Responsible
|
Due Date
|
Status Comment
|
|
1
|
Conflict of
Interest Declarations
|
Threshold
for declaration of shareholdings and clarification of non-pecuniary interest
|
L Hooper
|
Immed
|
Email
(attached following) sent 1/5/2014
|
|
2
|
Affixing
Common Seal
|
Explanation
of how freeholding of leasehold properties affects ACC cashflow payments
|
E Lambert
|
Immed
|
Email
(attached following) sent 1/5/2014
|
|
3
|
|
|
|
|
|
From: Leeanne Hooper
Sent: Thursday, 1 May 2014 12:21 p.m.
To: Alan Dick; Christine Scott; Dave Pipe; Debbie Hewitt; Fenton Wilson;
mmohi@doc.govt.nz; Peter Beaven; Rex
Graham; Rick Barker; Tom Belford
Cc: Liz Lambert
Subject: Follow-ups from Meeting yesterday
Good morning,
Some follow-up information from yesterday’s meeting
for you …
Members’ Interests (Guidance from Auditor General)
http://www.oag.govt.nz/2010/lamia/docs/local-authorities-members-interests-act.pdf
From Part 3 re shareholdings:
Interest
in a company
3.24
If either you or your spouse or partner is involved in a company that has
a pecuniary interest in a matter before the authority, you are deemed
for the purposes of the Act to have the same interest (as the company) only if:
•
you or your spouse or partner, singly or together, own 10% or more of the
shares in:
–
the company; or
–
another company that controls it; or
•
either you or your spouse or partner is a shareholder of the company, or
another company that controls it; and either of you is the managing director or
general manager (by whatever name you are actually called) of the company or
the controlling company; or
•
either you or your spouse or partner is the managing director or general
manager (by whatever name you or they are actually called) of the company, and
either of you is a shareholder of another company that controls it.
Part 5: Other conflict of interest issues states:
“5.1 Having a pecuniary interest in a matter before
the local authority, as discussed in Part 3, is one type of conflict of
interest. However, quite apart from the Act, there are legal rules about
conflicts of interest more generally, which apply to both pecuniary and
non-pecuniary conflicts of interest.
Conflicts
of interest generally
5.5
A conflict of interest exists where two different interests intersect –
in other words, where your responsibilities as a member of the local authority
could be affected by some other separate interest or duty that you may have in
relation to a particular matter. That other interest or duty might exist
because of:
•
your own financial affairs;
•
a relationship or role that you have; or
•
something you have said or done.
Situations
where a risk of bias may exist
5.18
The most common risks of non-pecuniary bias are where:
•
your statements or conduct indicate that you have predetermined the matter
before hearing all relevant information; or
•
you have a close relationship or involvement with an individual or organisation
affected by the matter.
What
is predetermination?
5.26
You could also create a legal risk to the authority’s decision if you
participate in the authority’s consideration of a matter and you have
made a formal submission to the authority in your personal capacity to support
or oppose a particular proposal as part of a public submissions process. There
may be rare situations where you may still be able to consider such matters.
However, as a potential decision-maker, to avoid creating legal risk for the
authority’s decision, it is advisable to avoid making submissions on
matters that will come before your authority for decision – doing so will
usually compromise your ability to participate in the decision making
process.”
Bias, Predetermination,
Relationship with other persons or organisations (including membership of other
organisations) and ‘What to do?’ are all covered in Part 5 –
available via the link provided above
ACC & Leasehold Cashflows (excerpts from 14
August 2013 Regional Council public excluded agenda item 7)
I realise that this paper was considered by the previous
Council, so if any of you want a full copy of it let me know and I will send a
‘red paper’ version to you.
1. In the event a leaseholder purchases the freehold of his/her/their
property from HBRC during the fifty year period, the purchase price paid by the
leaseholder to HBRC will be allocated as follows:
1.1. First, to pay to ACC the net present value of the expected future
rents which would have been received by HBRC if the sale of the freehold had
not proceeded, calculated at the same discount rate as used in the purchase
price paid by ACC, and,
1.2. Second to share any difference between the price paid by the
leaseholder and the net present value of potential future rents between ACC and
HBRC.
Benefits and Costs
2. The benefits of the final proposed deal are outlined below:
2.1. HBRC receives a single lump sum of $xx for investment in key
regional initiatives that cannot be achieved from any other way of dealing with
these assets because of the constraints of the HBELEA.
2.2. As a result of the sale, HBRC’s revenue is estimated to
improve to the extent that the sales proceeds can be invested and earn interest
in excess of the leasehold rentals. These improvements in revenue are
around $310,000pa for the 2013/2014 financial year $340,000 in the 2014/2015
financial year and $290,000 in the 2015/2016 financial prior to reinvestment.
The following table illustrates these calculations using current market
interest rates.

2.3. The HBRC will share, along with ACC, in the potential upside to
future rents which increase at a greater rate than 1.5% pa projected for the
cash flows sold. This means where rents do increase beyond projected levels in
future HBRC will receive a share of the higher rents which will in turn
increase its operating revenues.
2.4. HBRC continues to own the underlying properties, and will continue
to manage them in accordance with existing lease terms between HBRC and
leaseholders.
2.5. Leaseholder’s rights and obligations in terms of their leases
and the HBELEA are unaffected.
2.6. At the end of the fifty year term (i.e. in 2063), all cash flows
derived from rentals paid by then leaseholders will return to HBRC in full.
2.7. Management costs will be funded for HBRC by deduction from gross
rents before net rents are transferred to the investors. The effect of this
arrangement is to reduce HBRC’s operating costs correspondingly.
3. If the cash flows are not sold and the funds needed for RWSS are
borrowed at current market rates, the cumulative additional cost to the HBRC
over the period of the LTP will be around $3.9m.
If you have any further questions or this email hasn’t
answered the questions properly, as expected, please let me know J
Cheers,
Leeanne
Hooper
Governance & Corporate Administration Manager
|
Follow-ups
from Previous Regional Council Meetings
|
Attachment 1
|
LGOIMA Requests Received between 23 April and 21 May
2014
|
Request Status
|
Date
Received
|
Requested By
|
Request Summary
|
Group Manager Responsible for Response
|
|
Active
|
19/05/2014
|
Ian McIntosh
|
? within your "delegated authority" in making a
submission to the EPA Board of Inquiry on their Interim decision.
Answers to the following questions under the Official Information Act: 1. Did
you believe you were acting under your "delegated authority" as
'Acting Chief Executive' when you submitted the 7th May material to the EPA?
2. Did the Regional Council vote at any time on whether such a submission
should be made and, if so, when?
|
Liz Lambert
|
|
Active
|
20/05/2014
|
Rick Barker
|
1. A copy of the submission HBRC made in response to the interim
decision of the Board of Inquiry re Plan Change 6.
2. Why was the HBRC's submission not forwarded to Councillors as a matter of
course.
3. A description and the timing sequence for the planning that was considered
by the leadership team for the consultation process as a lead up the expected
necessity for making submissions to the BoI in response to its interim
decision.
4. Outline of the process of consultation actually undertaken for the
development and conclusion of HBRC response.
5. List of the people, other than HBRC staff who provided input,
comments or advice on the development of HBRC's response - including Regional
Councillors, the Board of HBRIC, staff seconded to HBRIC, iwi and their reps,
local government, non governmental organisations, commercial entities and
individuals.
6. Description of the process of engagement with Councillors in the
development of the response by HBRC to the interim decision and how you
arrived at the view that this was both adequate and appropriate.
|
Liz Lambert
|
|
Active
|
7/05/2014
|
A Better Hawke's Bay
|
HBRC financial info, being: 1. current level of external
borrowings 2. current level of internal borrowings 3. proportion of rates
revenue charged to service debt for of last 5 rating years and 4. relative $
amounts 5. interest rate used to calculate debt servicing content of rates
charged 6. actual interest rate paid on external borrowings for each year 7.
total amount of interest paid on external borrowings for each of last 5 years
8. projected level of borrowings from each external & internal source for
next 5 years
|
Paul Drury
|
HAWKE’S BAY REGIONAL COUNCIL
Wednesday 28 May 2014
SUBJECT: Deloitte Peer Review of HBRIC Ltd RWSS Business Case
Reason for Report
1. Deloitte has completed its Business Case Peer Review report and this
report will be presented at this Council meeting by Alan Dent and David Morgan
from Deloitte’s.
Background
2. To assist Council with the decision making process surrounding the
possible investment in the Ruataniwha Water Storage Scheme, Deloitte was
appointed by HBRC in January 2014 to undertake an independent peer review of
the Business and Investment Case presented by HBRIC Ltd to HBRC.
3. The independent
peer review of the business case is an important part of the overall assessment
process for HBRC and has relevance for the assessment of:
3.1. Financial
feasibility – is the Council’s investment supported by a sound
business case? What are the strengths and weaknesses of the business case?
3.2. Returns on investment – what
financial returns can the Council expect from its investment and over what time
period are these expected to occur?
3.3. Business
Risks – what risks does the company face and how will these be
managed or mitigated?
4. The Peer Review is in the nature of an “audit” of the
HBRIC Ltd prepared business case and Deloitte was tasked, in particular,
with addressing:
4.1. Whether HBRC
can have comfort that its exposure to calls on capital can be limited to its
current funding envelope of $60-80million
4.2. The
circumstances under which HBRC may be required to contribute additional capital
and where possible the quantity of those potential calls and the risks that
such calls could eventuate
4.3. The extent to
which HBRC can have comfort that the projected returns on its investment have
been accurately calculated and are based on reasonable assumptions
4.4. How
investment returns could vary under different scenarios
4.5. Any other
matters that Deloitte considers ought to be brought to HBRC’s attention
in connection with its assessment of the business case.
Deloitte Interim Report
5. In its interim
report presented to Council’s Corporate and Strategic Committee meeting
on 16 April 2014, Deloitte identified the key interlocking components of the
business case from a financial perspective as being:
5.1. The up-front
capital investment in the physical infrastructure of the RWSS
5.2. The business
model which drives the operating cash flows necessary to provide the investor
returns
5.3. The ownership
model and related investment structure that allocates capital, risk and return
to the different investor
5.4. Fundamentally
however the critical factor is demand – how long it takes to get to full
uptake and the profile of this uptake.
6. In
assessing these factors as the core building blocks of the project, Deloitte
satisfied itself as to the reasonableness of the assumptions supporting these
building blocks and the way the financial model has been constructed and
returns calculated within the HBRIC Ltd business case. They then used the model
to:
6.1. Assess the
overall return on capital from the project under different uptake scenarios
6.2. Demonstrate
how the internal rate of returns have been calculated
6.3. Use
sensitivity analysis to identify which assumptions matter and which are
immaterial in terms of the financial case
6.4. Identify the
implications for HBRC capital requirements and returns under different
scenarios.
7. The key risk to the project as identified by Deloitte is how long
the project takes to get to full uptake of water. This is important for two
reasons:
7.1. If the level and pace of uptake are lower and slower respectively
than the base case then there is a risk that HBRC will be called upon for
additional capital (together with all other investors)
7.2. There is a risk that HBRC’s rate of return may be lower than
that estimated in the business case e.g. the business case assumes a rate of
return of 6.9% at full uptake, but this could range between 6.4% and 7.4%
depending on the level and speed of uptake.
8. Deloitte is confident that the risks from any overruns in capital
costs during construction are well covered by the fixed price, fixed time
contract and will not impact upon HBRC.
Final Report and Findings
9. Attachment 1
to this paper is the final report of the review of the HBRIC Business Case from
Deloitte’s. Their conclusion is part of the executive summary of
this report which considers the base scenario presented in the Business Case.
10. Deloitte notes that
the three major moving parts of the proposal, namely the construction contract,
the required level of initial contracted water and the capital structure, have
yet to be finalised. They also state that is it not unusual for projects
of this nature to have a degree of uncertainty right up to the point of
financial close. Given this situation it would be appropriate for Council
to retain their services to undertake a final assessment of the proposal should
there be any material change between the base case and the situation at financial
close.
Decision Making
Process
11. Council
is required to make a decision in accordance with the requirements of the Local
Government Act 2002 (the Act). Staff have assessed the requirements
contained in Part 6 Sub Part 1 of the Act in relation to this item and have
concluded the following:
11.1. The decision
does not significantly alter the service provision or affect a strategic asset.
11.2. The use of
the special consultative procedure is not prescribed by legislation.
11.3. The decision
does not fall within the definition of Council’s policy on significance.
11.4. The persons affected by this
decision are the public of Hawke’s Bay
11.5. Options that
have been considered include not receiving the report, although Council
specifically commissioned Deloitte to undertake an independent per review.
11.6. The decision
is not inconsistent with an existing policy or plan.
11.7. Given the
nature and significance of the issue to be considered and decided, and also the
persons likely to be affected by, or have an interest in the decisions made,
Council can exercise its discretion and make a decision without consulting
directly with the community or others having an interest in this
specific decision as public consultation is occurring on the overall investment
proposition.
|
Recommendations
That Council:
1. Agrees that the decisions to be made are not significant under the
criteria contained in Council’s adopted policy on significance and that
Council can exercise its discretion under Sections 79(1)(a) and 82(3) of the
Local Government Act 2002 and make decisions on this issue without conferring
directly with the community and persons likely to be affected by or to have
an interest in the decision due to the nature and
significance of the issue to be considered and decided.
2. Receives the report titled “Peer Review of the
Ruataniwha Water Storage Scheme Business Case” prepared by
Deloitte; and
3. Notes that a further report will be required from Deloitte when
the final RWSS business case, including the capital structure, has been
finalised by HBRIC Ltd.
|
|
Paul Drury
Group
Manager
Corporate
Services
|
Liz Lambert
Chief
Executive
|
Attachment/s
|
1
|
Peer Review
of the Ruataniwha Water Storage Scheme Business Case
|
|
|
|
Peer
Review of the Ruataniwha Water Storage Scheme Business Case
|
Attachment 1
|
Table of Contents
1. Executive Summary 20
2. Introduction and Scope 28
3. Approach 30
4. Investment Proposition 32
5. Capital Investment 35
6. Business Model 41
7. Ownership Model and Investment Structure 50
8. Financial Projections 56
9. Other Benefits 75
10. Other Matters 79
Appendix 1
– Terms of Reference 81
Appendix 2
– Documents Reviewed 86
Appendix 3
– RWSS Overview Map 87
Appendix 4
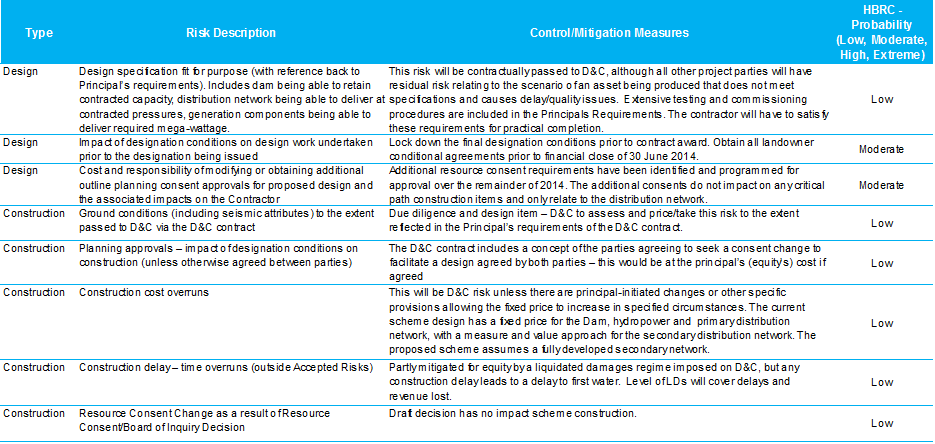
– Construction Risk Register 88
Appendix 5
– MacFarlane Product Price Assumptions 89
Appendix 6
– Sensitivity Analysis 90
|
Peer Review of the Ruataniwha Water
Storage Scheme Business Case
|
Attachment 1
|
Table of Figures
Figure
1: Milk Price ($/kgMS) 43
Figure 2: Lamb Price ($/kg) 43
Figure 3: Beef Price ($/kg) 44
Figure 4: Wool Price ($/kg) 44
Figure 5: Projected Demand
Uptake 45
Figure 6: Existing and
Anticipated Land Use 46
Figure 7: Business Case Capital
Structure 51
Figure 8: Changes to RWSS
Capital Structure through 70 Year Concession Period 51
Figure 9: Capital Structure
Scenarios 56
Figure 10: Construction Funding
Mix (Capital Structure A) 57
Figure 11: Construction Funding
Mix (Capital Structure B) 57
Figure 12: Base Case Water
Volumes (Million m3) 59
Figure 13: Comparison of INZ
Selected Schemes to RWSS 61
Figure 14: Electricity Price
Path 62
Figure 15: Projected Revenue
and Operating Profit 66
Figure 16: HBRIC Cash Flow -
Whole Concession 69
Figure 17: HBRIC Cash Flow -
Pre Trigger Date 69
Figure 18: HBRIC Cash Flow -
Post Trigger Date 69
Figure 19: Projected Demand
Uptake 71
Figure 20: Cumulative Post Tax
Distributions to HBRIC 73
Figure 21: RWSS Overview Map 87
|
Peer
Review of the Ruataniwha Water Storage Scheme Business Case
|
Attachment 1
|
Table of Tables
Table
1: Contract Price Structure 22
Table 2: Other Up-front
Investment Costs 22
Table 3: Base Case Capital
Structure 24
Table 4: RWSS Capital Cost 33
Table 5: Contract Price
Structure 37
Table 6: MacFarlane Rural
Business RWSS Farm Profitability Analysis 42
Table 7: Macfarlane Land Use
Assumptions 43
Table 8: Irrigation Scheme
Uptake Timeline 46
Table 9: Base Case Capital
Structure 50
Table 10: Breakdown of Capital
Costs 58
Table 11: Construction
Expenditure Profile 58
Table 12: Construction Period
Operating Costs 58
Table 13: RWSS Operational
Expenses 63
Table 14: Depreciation Rates
for Construction Components 64
Table 15: Operating Profit
(Base Case) 65
Table 16: Investment Returns 71
Table 17: One Off Construction
Impacts Estimated by Butcher 76
Table 18: On-going Impacts From
Increased Farm Production Estimated by Butcher 76
Table 19: Construction Risk
Register 88
Table 20: MacFarlane Product
Price Assumptions 89
Table 21: Investment Returns 90
|
Peer
Review of the Ruataniwha Water Storage Scheme Business Case
|
Attachment 1
|
Glossary
|
Abbreviation
|
Definition
|
|
|
|
|
ACoT
|
Avoided Cost of
Transmission
|
|
INZ
|
Irrigation New Zealand
|
|
ASX
|
Australian Securities
Exchange
|
|
IRR
|
Internal Rate of Return
|
|
BNZ Advisory
|
An independent division
of Bank of New Zealand, a subsidiary of National Australia Bank
|
|
Macfarlane
|
Macfarlane Rural
Business Limited
|
|
BOI
|
The Board of Inquiry
process under the management of the Environmental Protection Agency
|
|
$m
|
Millions of dollars
|
|
BOOT
|
Build Own Operate
Transfer
|
|
M3
|
1 cubic metre of water
|
|
Butcher
|
Butcher Partners
Limited
|
|
M m3
|
1 million cubic metres
of water
|
|
Castalia
|
Castalia Limited
|
|
MW
|
Megawatt
|
|
CIIL
|
Crown Irrigation
Investments Limited
|
|
O&M
|
Operations and
Maintenance
|
|
Concession Period
|
The 70 year period from
the beginning of construction to the transfer back to the Community of the
Scheme
|
|
PWC
|
PricewaterhouseCoopers
|
|
D&C
|
Design and Construct
|
|
RFP
|
Request for Proposal
|
|
DSRA
|
Debt service reserve
account
|
|
ROA
|
Return on Assets
|
|
EOI
|
Expressions of Interest
|
|
RPA
|
Ramp-up proceeds
account
|
|
EPA
|
Environmental
Protection Agency
|
|
RWSS / Scheme
|
Ruataniwha Water
Storage Scheme
|
|
FEMP
|
Farm Environmental
Management Plan
|
|
RWSS LP
|
Ruataniwha Water
Limited Partnership
|
|
FY
|
Financial year
|
|
SMEC
|
SMEC Holdings Limited
(formerly Snowy Mountain Engineering Company)
|
|
GDP
|
Gross Domestic Product
|
|
SPV
|
Special Purpose Vehicle
|
|
HBRC
|
Hawke’s Bay
Regional Council
|
|
Trigger date
|
The point at which
there is full uptake
|
|
HBRIC
|
Hawke’s Bay
Regional Investment Company Limited
|
|
WUA
|
Water User Agreement
|
|
Peer
Review of the Ruataniwha Water Storage Scheme Business Case
|
Attachment 1
|
1. Executive
Summary
Introduction
Hawke’s Bay Regional
Council (“HBRC”) is considering investing up to $80 million the
Ruataniwha Water Storage Scheme (“RWSS”, the “Scheme”).
HBRC’s subsidiary company, Hawke’s Bay Regional Investment Company
Limited (“HBRIC”), has prepared a business case in support of this
investment. Deloitte
has been engaged to peer
review this business case.
The RWSS is a proposed
long-term sustainable water storage solution for the Tukituki catchment in
Hawkes Bay. Through the construction of a dam on the upper Makaroro River
and associated distribution system the RWSS will store high winter flows for
irrigation use during summer when pressure on the water resource in the
Tukituki catchment is greatest. The motivation behind the Scheme is the
capturing of environmental, economic and social value.
A new company will be established
to build and own the dam and reservoir to be used to collect, store and
distribute water to farmers and other stakeholders on the Ruataniwha Plains on
commercial terms. It is important to note that the proposed procurement
structure is under a build, own, operate and transfer (“BOOT”)
structure which will see ownership transfer back to HBRIC[1] at the end of a 70
year[2]
concession period.
The scale of the RWSS and
the multiple objectives make this a far more complex investment proposition
than has been the case with other large scale irrigation schemes which have
primarily been commercially motivated, subject to compliance with environmental
and other regulatory constraints. In the case of the RWSS environmental and
wider economic development and social considerations are major drivers of the
case for investment and the reason why the Scheme cannot be funded on a wholly
commercial basis from the outset.
The RWSS will comprise an 83
m high dam capable of managing outflows of approximately 200 million cubic
metres (“M m3”) per year on average and a primary (canal
and pipeline) and secondary distribution network (pipelines, pumps and
property-off-takes). The costed Scheme Design is based on a hypothetical
secondary distribution layout which:
· Provides for full uptake of 104 M m3
of water per annum;
· Provides full workable pressure to 35 m
head; and
· Accounts for approximately 44 M m3
of water as signed up in irrigator expressions of interest
(“EOI’s”).
Based on the forecast
water volumes and distribution layout the RWSS has the potential to increase
farm productivity and allow higher value farming through irrigating
approximately 25,000[3]
hectares (and an additional 17,000 hectare direct area of influence giving a
total influence area of circa 42,000 hectares) on the Ruataniwha Plains and
down through the Tukituki catchment. In addition to the 104 M m3 of
water available to be contracted for irrigation purposes a further 43.3 M m3
of water will be available for environmental purposes (residual flows and
flushing flows) and 52.3 M m3 for other purposes including being
sold as spot water and providing an additional buffer of water available for
managing environmental conditions.
In undertaking our peer
review we have directed our work at addressing the following matters in
particular:
· Whether HBRC can have comfort that its
exposure to calls on capital can be limited to its current funding envelope of
up to $80 million;
· The circumstances under which HBRC may be
required to contribute additional capital and where possible the quantity of
those potential calls and the risks that such calls could eventuate;
· The extent to which HBRC can have comfort
that the projected returns on its investment have been accurately calculated
and are based on reasonable assumptions;
· How investment returns could vary under
different scenarios; and
· Those other matters that we consider ought
to be brought to HBRC’s attention in connection with its assessment of
the business case.
In undertaking our peer review we have
identified the key interlocking components of the business case from a
financial perspective as being:
· The up-front capital investment in the
physical infrastructure of the RWSS;
· The business model which drives the
operating cash flows necessary to provide the investor returns; and
· The ownership model and related investment
structure that allocates capital, risk and return to the different investor
categories.
The interplay between these
three components underpins the financial case for the RWSS.
Design & Construction
HBRIC has run a competitive
process for the selection of its preferred construction contractor. The process
was structured as a request for expressions of interest followed by a
shortlisting and request for proposal. The HBRIC process attracted a number of
quality bidding consortia. Following a shortlisting to two consortia a full
Request for Proposal (“RFP”) process was undertaken. At the
conclusion of this process OHL-Hawkins was selected as the preferred bidder.
The bid was requested as a
fixed price for design and construct (“D&C”). This is normal
practice where the required performance and scope of the project can be
adequately specified. It also eliminates the interface between designer and
constructor which, if managed as separate contracts by the investor or owner, can
create additional risk through unclear accountability in the event of problems
with the project or its eventual performance.
One of the difficulties
with the Scheme is that the full extent of initial irrigation water uptake and
the location of the offtake points are currently unknown. The location of the
initial offtake points is likely to be spread throughout the total area to be
irrigated and it is extremely difficult to design a distribution system which
meets only this initial demand and can be readily expanded in stages as demand
grows. In order to deal with this challenge the project team has negotiated a
contract price structured as follows:
Table 1: Contract Price Structure
|
Price
Element
|
Price
|
Pricing
basis
|
|
Dam and electricity
generation
|
$120.6 million
|
Fixed price and scope
|
|
Primary distribution
|
$63.0 million
|
Measure and value
allowing flexibility to build less or a different layout[4]
|
|
Secondary distribution
|
$59.4 million
|
Measure and value
allowing flexibility to build less or a different layout
|
|
Total OHL-Hawkins
contract
|
$243.0 million
|
Fixed price and scope
(absolute cap on price assuming full scheme is built)
|
The combination of a fixed
price and scope pricing for the dam and electricity generation elements of the
Scheme and a measure and value approach for the primary and secondary
distribution elements significantly reduces the risk of the equity investors
being required to fund material capital cost overruns. The risk to the
investors arising from delays in Scheme completion or Scheme performance issues
are limited by damages provisions in the contract.
In addition to costs
associated with the build of the physical infrastructure additional other costs
also need to be funded as part of the up-front investment in the Scheme. These
are:
Table 2: Other Up-front Investment Costs
|
Construction
Component
|
Price
|
Party
responsible
|
|
OHL-Hawkins (dam,
generation, distribution)
|
$243.0 million
|
OHL-Hawkins
|
|
Construction period
operating costs
|
$11.7 million
|
RWSS Partnership
|
|
Development costs, Land,
Ancillary Roading & Surveying
|
$21.8 million
|
Incurred or negotiated
prior to FC
|
|
Total capital cost
|
$276.5 million
|
|
Business
Model
The business model for the
RWSS is based on users (farmers) contracting for water on a take or pay basis
for a period aligned with the first 35 year resource consent period. Unlike
other similar schemes RWSS is not being structured as a farmer co-operative.
Therefore, while farmers have an opportunity to invest in the RWSS this is not
a requirement of their accessing water. As a consequence the financial
viability of the RWSS is fundamentally dependent on farmers being willing to
contract for water. The validity of assumptions made in this regard is
therefore critical to any financial case for investment. A primary factor in
determining the proposed ownership structure, with HBRIC and Crown Irrigation
Investments Limited (“CIIL”) as being cornerstone funders, is the
positive economic and environmental externalities. If the Scheme was being
undertaken solely for the benefit of irrigators it would be reasonable to
assume the majority of the funding would be provided from a co-operative
structure but it would be very unlikely the same scale of project would be
achievable.
The economic assumptions
underpinning the business model are supported by an independent farm
profitability study undertaken in September 2012 by agribusiness consultant
Macfarlane Rural Business Limited (“Macfarlane”), an independent
demand and uptake analysis undertaken by infrastructure advisor, Castalia Limited
(“Castalia”), and also an internal process undertaken by HBRIC and
its legal and financial advisors to collate EOIs.
Demand for irrigation water
is premised on the assumption that irrigation will facilitate increased farming
profitability and reduced weather risk. The Macfarlane study provided an
analysis of the direct financial benefits that may result from the RWSS. This
study informed the Castalia demand study, originally completed in September
2012 and updated in November 2013, which sought to forecast the phased uptake
profile for irrigation water. The EOI process undertaken in 2013, which ran
from early March until the end of August, has provided further confirmatory
analysis and broadly reinforced the findings of the Macfarlane farm
profitability and the Castalia demand studies.
Macfarlane consider that
land use under irrigation will change towards more intensive and profitable
farming systems. A high proportion is assumed to be dairying and arable farming
depending on soil type. Land use will be determined by relative profitability
and soil type, moderated by the farmers own preference. Macfarlane consider
that farm productivity for farms who take up water after the Scheme is
commissioned will trend toward the top 20% for reasons of modern irrigation
technology, higher debt servicing, greater motivation and improved technical
skills. More fundamentally reliable irrigation water provides farmers
with the confidence to increase stocking and planting levels without the
concern that dry conditions may impact on their investment.
Effectively, the Macfarlane
farm profitability study provided an ‘end state’ or rational basis
for utilising irrigation to intensify farming systems as a means of increasing
profitability. The forecast rate of uptake was based on an assessment of farmer
sentiment and other modelled factors related to the decision making processes
of incumbent and new entrant farmers. Fundamentally this will involve farmers
weighing up the capital costs necessary to effect a change in land use against
long run expected returns on this marginal capital. While capital costs can be
estimated with a high degree of precision long run returns on capital are
harder to predict and will be fundamentally be determined by commodity prices
and productivity improvements. While long run trends in commodity prices can be
estimated these are not certain. Further, in the short term prices can be
volatile relative to this long run trend and this volatility can influence
investment decision making.
Castalia undertook a
survey to gauge farmer views in relation to irrigation uptake and also the
likely impact on land sale (turnover rates). The survey, conducted anomalously,
(online, by phone and also in written form) had a response rate of around 50%
of the RWSS catchment land area. The Survey responses covered a wide range of
farming types, soil types and farmer demographics. Survey information was used
as a key input in a demand model, which also included amongst other parameters,
milk pay-out, the cost of water and the rate at which land turned over.
HBRIC has advised that a
condition precedent for financial close for the Scheme is to have 40 M m3
or 38.5% of water contracted by 30 June 2014. This has now been pushed out to
30 September 2014. The Base Case financial projections for RWSS assume 52% of
contracted water by the time construction is completed which assumes additional
13.5 M m3 of water users sign up over the 3.5 years construction
period. We had considered a timeline requiring nearly 40% of water to be
contracted by 30 June to be extremely tight given the material contractual
commitment that farmers are being required to enter into, the extension to 30
September should give some headroom.
Capital Structure
The final capital structure
is yet to be locked down but is expected to be provided from a combination of
arm’s length sources (institutional investors and bank debt), related
parties (farmers, local investors and local Iwi) and discounted capital (CIIL
and HBRIC). The Base Case financial projections assume the following capital
structure:
Table 3: Base Case Capital Structure
|
Financing
Sources
|
Indicative
Investment
|
|
HBRIC Ltd
|
Up to $80m
|
|
Institutional
Investors
|
>$50
million
|
|
Crown
Irrigation Investments Ltd
|
TBD
|
|
Tukituki
Investments LP / He Toa Takitini
|
> $10 million
|
|
Total
funding sources
|
$276
million
|
Current projections assume that HBRIC
achieves a less than commercial return on its investment until the point at
which full uptake is achieved at which time it will receive the same returns as
other equity investors. The cost of CIIL funding is heavily discounted, but
this capital is required to be refinanced as farmer uptake ramps up.
In our view, in the absence of subsidised
capital from HBRIC and CIIL the RWSS is not viable under the current uptake
scenario. However, the Scheme is also critically dependent on capital from
parties seeking a commercial return on this investment. We note that if full
uptake (or at least a significant portion of uptake) was contracted at
financial close we would expect a reasonable proportion of the funding to be
provided by bank debt. This is the case with the more recent co-operative
schemes in the South Island and large scale infrastructure projects where a
significant portion of the revenue is contracted.
We asked BNZ Advisory to
consider a scenario which had 100% uptake at day 1 of operations. Under this
scenario a reasonable commercial capital structure is considered to be 75% bank
debt gearing via project finance and the balance funded by institutional
investors solely (that is, no public funding).
This scenario results in an
institutional investor IRR that would be within an acceptable range of returns
for institutional investors for such a project (70 year concession with no
uptake risk).
The requirement to balance the needs of
commercial investors and the providers of subsidised capital adds significant
complexity to the capital structure both in terms of the quantum of capital
needed from the different sources and how the terms of such investment are
balanced out to make sure that the objectives of each party are met and
aligned. While the inclusion of different investor classes in the capital
structure adds complexity there are benefits also. In particular the
involvement of institutional investors brings additional scrutiny and financial
and governance disciplines. In addition such investors can also bring
additional technical competencies. In this regard we note that while Trustpower
has recently decided not to invest in the RWSS it did play a significant role
in the process for selecting the preferred construction partner and in
validating key assumptions that have been incorporated in the financial models
developed by BNZ Advisory for the purposes of the RWSS business case.
The capital structure for
RWSS requires operating cash flows to be shared between investors on quite
different bases. We have undertaken extensive scenario analysis to satisfy
ourselves that there are no circumstances whereby HBRIC is required to commit
additional capital to fund the payment of returns to other equity investors.
However, we note that the final capital structure and who the investors will be
have yet to be finalised. Similarly, the terms under which funds will be
provided are still subject to negotiation and the agreement of final terms and
these could vary from what is currently being modelled.
Financial Projections
The base case financial
projections show HBRIC achieving a sub-commercial internal rate of return
(“IRR”) on its investment up to the point of full uptake which the
Base Case assumes is June 2028 (the “Trigger Date”) with an IRR
reflective of Brownfield investor returns (approximately 10% per annum) beyond
that point. We are satisfied that the IRRs have been correctly calculated but
note that a number of factors influence these calculations and in particular
assumptions as to:
· Uptake
· The quantum and timing of the introduction
of debt
· Interest rate assumptions
· The assessed value of HBRIC’s
investment at full uptake
· Refinancing
The Base Case IRRs are
sensitive to changes in key assumptions such as the rate of uptake and increases
in capital expenditure. We note however that the proposed structure of the CIIL
capital significantly mitigates the risk to HBRIC of a lower than projected
uptake in the period up to the Trigger Date.
At full uptake the RWSS will
generate sufficient operating cash flows to provide market returns to all
capital providers. Further, at this point a range of options will be available
to HBRIC as to how it structures its investment. In particular infrastructure
assets such as the RWSS once fully committed are typically capable of
supporting a significant amount of bank debt thereby creating the opportunity
to return capital to the original investors.
Risks and
Mitigants
In broad terms the risks are
allocated as follows:
· Design and construction risks are borne by
the D&C contractor. These include cost over runs and timing delays (where
there is no scope change initiated by the Scheme).
· Demand and uptake risk is borne by HBRIC
and the portion of the institutional investors’ return which is not met
by an investor fee. CIIL provides a timing buffer through the repayment
mechanism which depresses the repayment while uptake remains low thereby making
a higher proportion of cash flows available to HBRIC and institutional
investors than would otherwise be the case. If uptake was very slow then it
would also be likely to impact institutional investors’ investor fee.
· Operating costs and performance is largely
met by all parties in the post trigger date period, however in the ramp up
period this risk is borne by HBRIC and the proportion of institutional investor
returns not accounted for in the investor fee.
· Regulatory risk is borne by all investors
equally, assuming that the trigger date is reached prior to the end of the
first consent period.
Board of Inquiry
The RWSS is intended to be
a key component of the integrated management of the Tukituki catchment.
Increasing minimum flows and setting appropriate nutrient levels are expected
to improve environmental and cultural outcomes. Tukituki Plan Change 6 (a land
and water management plan) was developed to achieve these benefits and has been
subject to a Board of Inquiry (“BOI”) process under the management
of the Environmental Protection Agency (“EPA”). The BOI released
its draft determination on 15th April. We have not examined this determination
in detail but understand that while this does provide the necessary consents
for the RWSS to proceed, it also requires stricter limitations on nitrogen than
were requested in Plan Change 6. We understand the absolute levels required
under the BoIs draft decision are very stringent noting there is apparently
some ambiguity throughout the draft decision. This requirement as it is
currently framed is likely to affect land use options for farmers. A final
decision is now anticipated no later than June 28 at which point the economic
impacts will need to be fully assessed.
Conditions Precedent
The business case summarises
the key conditions precedent that must be met prior to financial close. These
are identified as being:
· Satisfactory EPA resource consent
conditions for the RWSS infrastructure and operations;
· A concession deed for the RWSS entered
into by HBRC and the Ruataniwha Water LP (“RWSS LP”) becoming
unconditional, including in respect of the required resource consents;
· A project agreement entered into between
HBRIC and RWSS LP becoming unconditional;
· A D&C agreement entered into between
the RWSS LP and the OHL-Hawkins consortium; and
· Receipt of commitments to purchase a
sufficient volume of irrigation water, as determined by agreement between HBRIC
and other investors. HBRIC has set its requirement at 40 M m3.
Conclusion
The business case for the
RWSS for the Hawkes Bay region is now at a critical stage. The draft
determination of the BOI has effectively given consent to the Scheme albeit
with restrictive terms in relation to the management of nitrogen. However, the
three major moving parts of the proposal – the construction contract, the
required level of initial contracted water and the capital structure –
have yet to be finalised. It is not unusual for projects of this nature to have
a degree of uncertainty right up to the point of financial close. However, in
our view there is a significant amount still to be achieved before financial
close. In this context we understand that the targeted contractual close has
been moved out by 3 months to 30 September 2014 with the expectation that water
user uptake will be well advanced by this time
Our review has been directed
at the business case for the RWSS as it currently stands. As note there are
still material elements of the RWSS proposition that have yet to be finalised.
It is likely that the final proposition will differ from that set out in the
current business case. Once the RWSS proposition is finalised there may be
benefit in a further review to confirm that HBRIC’s portion has not
altered materially.
Given the importance of the
RWSS and the significant effort and investment made in getting the Scheme to
its current state we believe that a decision to extend the financial close date
is sensible provided that there is a reasonable expectation that the conditions
precedent to financial close can be met within the extended timeframe.
|
Peer
Review of the Ruataniwha Water Storage Scheme Business Case
|
Attachment 1
|
2. Introduction
and Scope
In accordance with our letter of engagement dated 4
February 2014 Deloitte was engaged by HBRC to undertake a peer review of the
business case for the proposed RWSS prepared by HBRIC. This report sets out the
findings from our peer review.
Our Report will
be prepared for this purpose and no other.
Scope of Work
The scope and
basis of our work was limited to the matters set out in our Terms of Reference
as set out in Appendix 1 of this report. We make no comment as to the adequacy
of the scope.
Limitations of Scope
In undertaking
our assessment, we have relied upon and assumed without independent
verification, the accuracy and completeness of all information that is
available from public sources and all information that was provided to us by
HBRC and HBRIC. We have evaluated the information provided through analysis,
enquiry and examination for the purposes of forming our assessment. We accept
no responsibility for matters not covered by the Report or omitted due to the
limited nature of our review.
We note that the business
case, related financial analysis and supporting documentation that we have
reviewed were all prepared prior to the BOI issuing its draft determination.
Accordingly the scope of our work does not include any assessment of the
implications for the business case of this draft determination.
In preparing this report we
have been cognisant of the fact that much of the material reviewed is
commercially sensitive at this point in time. In this report we have
endeavoured to set out the basis for our finding without disclosing information
that could frustrate the ongoing process to finalise the details of the RWSS.
Report Use
The findings from
the procedures that we have conducted on your behalf have been reported to you
solely for the purpose of identifying potential issues that may be of interest to
HBRC. The report must not be made available or copied in whole or in part to
any person without the express written permission of Deloitte.
Deloitte accept
no responsibility for any reliance that may be placed on this report should it
be used by any party or for any purpose that has not been expressly agreed in
writing by Deloitte.
Report Conventions
Financial years
(“FY”) represented in this report represent the twelve months ended
31 March.
Figures presented
in this report are in New Zealand dollars (“$”) unless otherwise
stated and have been rounded to the nearest thousand. Tables have not been
adjusted to correct minor rounding errors.
Disclaimer
This report has
been prepared with care and diligence and the statements and conclusions in
this report are given in good faith and in the belief, on reasonable grounds,
that such statements and conclusions are not false or misleading. However, in
no way do we guarantee or otherwise warrant that any projections of future
profits, cash flows or financial position of the RWSS will be achieved.
Projections are inherently uncertain. They are predictions of future events
that cannot be assured. They are based upon assumptions, many of which are
beyond the control of HBRIC and its management. Actual results will vary from
the projections and these variations may be significantly more or less
favourable.
We assume no
responsibility arising in any way whatsoever for errors or omissions (including
responsibility to any person for negligence) for the preparation of this
assessment to the extent that such errors or omissions result from the
reasonable reliance on information provided by others or assumptions disclosed
in this report or assumptions reasonably taken as implicit.
|
Peer
Review of the Ruataniwha Water Storage Scheme Business Case
|
Attachment 1
|
3. Approach
Our approach has been directed at addressing:
· Whether the HBRC can have comfort
that its exposure to calls on capital can be limited to its current funding
envelope of up to $80 million;
· The circumstances under which HBRC may be
required to contribute additional capital and where possible the quantity of
those potential calls and the risks that such calls could eventuate;
· The extent to which HBRC can have comfort
that the projected returns on its investment have been accurately calculated
and are based on reasonable assumptions;
· How investment returns could vary under
different scenarios;
· Those other matters that we consider ought
to be brought to HBRIC’s attention in connection with its assessment of
the business case.
In undertaking our review we
have followed the process set out below:
· Reviewed relevant background information
including a cross section of submissions to the BOI process and local media
commentary;
· Provided guidance to HBRIC as to our
expectations as to the matters the business case would need to address;
· Reviewed the business case submitted to
HBRC on 16 March 2014;
· Reconciled the contents of the
business case to the guidance provided to HBRIC;
· Requested HBRIC and its financial advisor
(BNZ Advisory) to undertake additional analysis and documentation of the financial
case for the RWSS;
· Interviewed key advisors and reviewed
documentation relevant to their advice;
· Reviewed the financial case and related
assumptions;
· Cross referenced key assumptions back to
information obtained through our interview process or our review of relevant
documents;
· Requested HBRIC/BNZ Advisory undertake
additional financial analysis to test the sensitivity of financial outcomes to
changing key assumptions;
· Requested additional information and
comment from HBRIC’s advisors as necessary;
· Synthesised the information obtained and
the conclusions reached and documented these in our report.
We set out a summary of the
documents we have reviewed in Appendix 2. While we cross reference our analysis
to these documents extensively we have not sought to repeat the majority on the
analysis and commentary contained in those documents in this report. The key
documents that we reference are publicly available.
In following the process
outlined above we have identified the key interlocking components of the
business case from a financial perspective as being:
· The up-front capital investment in the
physical infrastructure of the RWSS;
· The business model which drives the
operating cash flows necessary to provide the investor returns;
· The ownership model and related investment
structure that allocates capital, risk and return to the different investor
categories;
· The interplay between these three
components underpins the financial case for the RWSS.
|
Peer
Review of the Ruataniwha Water Storage Scheme Business Case
|
Attachment 1
|
4. Investment Proposition
Overview
The RWSS is a proposed
long-term sustainable water storage solution for the Tukituki catchment.
Through the construction of a dam on the upper Makaroro River and associated
distribution system the RWSS will store high winter flows for irrigation use
during summer when pressure on water resource in the Tukituki catchment is at its
greatest. Appendix 3 sets out an overview map of the RWSS showing the reservoir
and dam site and the 5 currently defined water service zones (A, B, C, D &
M).
The scheme has been
established such that the dam will be built in the foothills where average
rainfall is significantly higher than on the plains. The dam will then release
water into the Makaroro River which feeds into the Waipawa River. From here the
flow moves down the river and is subsequently extracted at three separate river
intake structures located. The intakes are designed to supply water to Zone A,
Zones B-D, and Zone M, respectively. From the intakes the water is fed into the
main Primary Distribution System which consists of approximately 16km of canal
and 17km of pipeline. We note that an addition to the scheme from the original
feasibility report is that a new outfall from the canal on the Upper Tukituki
River to supply Zone M and other downstream irrigators. The water is then fed
into the Secondary Distribution Network which consists of approximately 200km
of pipeline length, property-off-takes, and pump stations which provide a fully
pressurised system at 35m of head pressure (3.5 bar) at the farm gate.
There are currently
significant environmental issues associated with the Tukituki Catchment. These
occur in the summer months when river flows are lowest. Generally there is a
nutrient imbalance in the system with excessive phosphorus generating slime and
algae growth. In addition, current water allocation exceeds Regional Plan limits
contributing to frequent very low flows during summer.
The RWSS is intended to help
mitigate environmental degradation of the Tukituki catchment while unlocking a
significant regional economic opportunity through the provision of water
through irrigation for more productive and higher value farming on the
Ruataniwha Plains. The RWSS is intended to be a key component of the integrated
management of the Tukituki catchment. Tukituki Plan Change 6 (a land and water
management plan) has been developed to achieve these benefits and has been
subject to a BOI process under the management of the EPA. The BOI submitted its
draft determination of 15th April 2014
Capital Cost
and Design
The capital cost of the RWSS
is currently estimated at approximately $276 million as set out Table 4 below.
In addition to the costs below there may
be an amount of capitalised interest on the CIIL funding which will accrue
during construction:
Table 4:
RWSS Capital Cost
|
Construction
Component
|
Price
|
%
|
Party
responsible
|
|
OHL-Hawkins (dam,
generation, distribution)
|
$243.0 million
|
87.9%
|
OHL-Hawkins
|
|
Development costs, Land,
Ancillary Roading & Surveying
|
$21.8 million
|
7.9%
|
Incurred or negotiated
prior to FC
|
|
Construction period
operating costs
|
$11.7 million
|
4.2%
|
RWSS Partnership
|
|
Total capital cost
|
$276.5 million
|
100%
|
|
The RWSS will comprise an 83 m high dam
capable of managing outflows of approximately 200 M m3 per year on
average and a primary (canal and pipeline) and secondary distribution network
(pipelines, pumps and property-off-takes). Due to the measure and value
component of the secondary distribution network a final cost will not be known
until final Scheme Design. All other facets of the RWSS OHL-Hawkins contract
(which comprises 87.9% of total capital costs) are based on a fixed cost and
measure and value component. We note that the development costs, land
purchases, and ancillary roading and surveying costs will be known at financial
close. On this basis approximately 95.8% of the capital cost will be known and
will be fixed (subject to no RWSS instigated design or scope changes).
The costed Scheme Design is based on a
hypothetical secondary distribution layout which:
· Provides for full uptake of 104 M m3 of
water per annum;
· Provides full workable pressure to 35 m
head[5];
and
· Takes account of approximately 44 M m3 of
water as signed up in irrigator EOI’s.
The RWSS has the potential
to increase farm productivity and allow higher value farming through irrigating
approximately 25,000 hectares (and an additional 17,000 hectare direct area of
influence) on the Ruataniwha Plains and down through the Tukituki catchment. In
addition to the 104 M m3 of water available to be contracted
for irrigation purposes a further 43.3 M m3 of water will be
available for environmental purposes (residual flows and flushing flows) and
52.3 M m3 for other purposes including being sold as spot water and
providing an additional buffer of water available for managing environmental
conditions.
Operating Model
The operating model is based
around the sale of water to farmers on a take or pay basis under the terms of a
water user agreement (“WUA”). A minimum level of contracted demand
of 40 M m3 (38.5 % of design capacity) has been specified by HBRIC
as being a condition precedent for financial close. The key driver of
financial performance for the RWSS is the rate at which uptake grows from this
initial level to full uptake of 104 M m3.
Operating costs are modest
and include pump energy costs, pump and distribution maintenance, mitigation
costs and SPV management costs.
Investment Model
The RWSS will be implemented
as a Build Own Operate Transfer (“BOOT”) contractual arrangement
with a 70 year concession period from the start of construction. At the end of
the Concession Period the Scheme assets will transfer back to the community:
primarily HBRC, but with minority interests continuing under eligible
investors.
Investment capital for the
RWSS is yet to be finalised but is assumed to be provided from a combination of
arm’s length sources (institutional investors, bank debt), related party
capital (farmers, local investors, local Iwi) and discounted capital sourced
from CIIL and HBRIC.
Because the RWSS will not
have full uptake immediately post construction subsidised capital is required
to support the Scheme until substantial uptake is achieved.
The proposed investment by
HBRIC is limited to a funding envelope of up to $80 million including the
approximately $9 million of development costs spent by HBRIC to date.
Key Benefits
The key benefits anticipated
from the Scheme are seen as being:
· Significant improvement in on farm
productivity due to the access to reliable water;
· Environmental improvements due to flushing
flows that will be available to be released into the Tukituki;
· Avoidance of the economic costs that will
occur should the RWSS not proceed and consequently access to water needing to
be scaled back;
· Increase in Regional GDP through a one-off
effect due to construction of the RWSS estimated at $330 million by Butcher
Partners Limited (“Butcher”); and
· Sustained increase in GDP from downstream
support and processing activities from land use changes estimated at $3,300
million by Butcher.
|
Peer
Review of the Ruataniwha Water Storage Scheme Business Case
|
Attachment 1
|
5. Capital
Investment
Introduction
In this section we consider
the risks generally associated with major capital projects and the challenges
specific to the RWSS. We consider the approach taken by the development team to
specifying and tendering the Scheme construction contract to date and assess
the proposed approach to contracting for the construction of the Scheme and the
effectiveness of this in managing the primary risks to which investors will be
exposed. We then consider the residual risks which investors will carry.
Financial risks in major capital
projects
Most major capital projects
contain three generic risks which expose investors in the projects to the risk
of financial loss. These are:
· Capital cost – the risk that the final project
cost is more than that expected at the point at which the investment commitment
is made. The investor then needs to make up the shortfall which impacts on the
investors’ returns and potentially the viability of the project.
· Delays – the risk that the project takes
longer to reach operation than expected meaning that revenues and other
benefits are delayed and returns to investors are delayed and/or reduced.
· Performance – the project fails to perform at
the expected level reducing the level of revenues generated and potentially
requiring additional capital to restore the project to an adequate level of
performance. Again, investor returns are reduced and, if the performance
shortfall is sufficiently large, the viability of the project may be
compromised.
These risks are allocated
between the investors and the construction contractor through the terms of the
construction contract signed between them with the financial consequences
resting with one or other under certain defined circumstances depending upon
the detail of the terms agreed.
The tendering process by
which a contractor is selected will determine the competitiveness of the price
for the construction contract and hence the value and returns to investors. A
competitive process with multiple parties tendering should deliver the lowest
market price for a given scope of work and best value to the investors.
Ruataniwha procurement process
HBRIC has run a competitive
process for the selection of its preferred construction contractor. The process
was structured as a request for expressions of interest followed by a
shortlisting and request for proposal.
HBRIC invited expressions of
interest from contractors for the combined design and construction of the
Scheme in February 2013. The process attracted five bidding consortia which
registered interest. This was reduced to a shortlist of two which were invited
to submit a full design and construct proposal. The successful shortlisted
consortia were:
· Bouygues Construction Australia Pty Ltd
– the Australian subsidiary of Bouygues SA, a listed global construction
company with headquarters in France; and
· OHL-Hawkins – 50/50 Joint Venture.
OHL is a listed Spanish construction company with international operations and
Hawkins Infrastructure Ltd a New Zealand owned construction company.
The shortlisted parties were
provided with an owner’s requirements document specifying the performance
requirements and scope of the Scheme with which bids were required to comply.
RFP’s were submitted by both parties in August 2013 and both proceeded to
a full detailed evaluation. The owners requirements document was updated on 16
April 2014, primarily in relation to the performance requirements for the
irrigation system.
The evaluation was
undertaken by an evaluation team comprising HBRIC, Trustpower (Investors),
National Australia Bank (financial advisor and debt specialist), SMEC Holdings
Limited (“SMEC”) (technical/engineering advisor), and an
independent technical procurement advisor. The panel was supported by other
subject matter experts.
Following the evaluation
process OHL-Hawkins was selected as the preferred contractor however the bid
price exceeded the affordability threshold. The evaluation team and its
advisors entered into a value engineering process with OHL-Hawkins and
identified alterations to scope and other changes which resulted in the design
and construct price being reduced to $240 million to $245 million.
Scheme construction scope
The business case provided
to Council in March 2014 contained the following summary of the OHL-Hawkins
scope of supply:
OHL-Hawkins
Dam and Associated Works Design Summary
· Central core rock fill dam (CCRD),
approximately 83m above existing river bed level, with a crest width of 7.0m at
RL 475.30m.
· Free overflow (ungated) Spillway located
on the left abutment with a sill level at RL 469.5m capable of passing the
Probable Maximum Flood of 775 cubic meters (“m3”) per
second and downstream plunge pool.
· A 4.5m D-shaped diversion tunnel
constructed by drill and blast methods and approximately 480m in length.
· Inclined reinforced concrete Intake
Structure with six distinct intake gates constructed with inverts between
462.95m RL to 414.7m.
· Outlet Works comprising 2200mm diameter
outlet pipe (penstock) and 600mm diameter environmental flow pipe, fixed cone
valves and stilling basin.
· Hydropower Station consisting of a Powerhouse
with installed turbine capacity of the order of 6.5 megawatts
(“MW”).
OHL-Hawkins
Distribution Design Summary
· Three screened and flow controlled river
intake structures located along the Waipawa River to supply water to Zone A,
Zones B-D, and Zone M, respectively.
· Primary Distribution System consisting of
approximately 16km of canal and 17km of pipeline length.
· A new outfall from the canal on the Upper
Tukituki River to supply Zone M and other downstream irrigators.
· Secondary Distribution Network consisting
of approximately 200km of pipeline length, 180 property-off-takes (with water
metering, isolation, and telemetry), and pump stations to provide a fully
pressurised system at 35m of head pressure (35 bar) at the farm gate.
Design and
Construction Contract – Transmission System
· In addition to the OHL-Hawkins contract
RWSS LP is currently negotiating a contract with Centralines for the provision
of electricity transmission to the dam site. While still in negotiation the
current proposal includes:
· A dedicated 33kV sub transmission feeder
to the new power station from the Transpower Waipawa GXP at Ongaonga;
· Five dedicated 11kV feeders to supply the
RWSS pumping stations;
· An upgrade to the Centralines existing
substation assets at Ongaonga, Takapau and Waipawa and Transpower assets
necessary to meet the projected loads (6.5MVA) and generation (6.5MW); and
· Fibre telecommunications infrastructure
between all RWSS load/generation locations.
Discussion of approach taken
The construction contract
tender process is not yet complete. OHL-Hawkins has been identified as the
preferred contractor and a revised scope negotiated. The contract has been
further updated on 16 April 2014 with more detail added in relation to the
commercial details including liquidated damages, however the construction
contract has yet to be finalised. To date the contract comprises the draft
provided to the contractor during the RFP process which has been updated with
some of the content from the contractor’s RFP response. We were advised
during discussions with management that the contract has been “left to
one side” whilst the value engineering exercise was completed. Our
comments on the approach are made in this context and are focussed on how the
three major risks above have been dealt with and how any specific challenges of
this Scheme have been addressed.
Price certainty
The bid was requested as a
fixed price for design and construct. This is normal practice where the
required performance and scope of the Scheme can be adequately specified. It
also eliminates the interface between designer and constructor which, if
managed as separate contracts by the investor or owner, can create additional
risk through unclear accountability in the event of problems with the Scheme or
its eventual performance.
One of the difficulties with
the Scheme is that the full extent of initial irrigation water take-up and the
location of the offtake points are currently unknown. The location of the
initial offtake points is likely to be spread throughout the total area to be
irrigated and it is extremely difficult to design a distribution system which
meets only this initial demand and can be readily expanded in stages as demand
grows. In order to deal with this challenge the project team has negotiated a
contract price structured as follows:
Table 5: Contract Price Structure
|
Price
Element
|
Price
|
Pricing
basis
|
|
Dam and electricity
generation
|
$120.6 million
|
Fixed price and scope
|
|
Primary distribution
|
$63.0 million
|
Fixed price and scope [6]
|
|
Secondary distribution
|
$59.4 million
|
Measure and value
allowing flexibility to build less or a different layout
|
|
Total OHL-Hawkins
contract
|
$243.0 million
|
Fixed price and scope
(absolute cap on price assuming full scheme is built)
|
A measure and value approach
is generally used where changes in scope are anticipated and exposes investors
to additional costs where these are made. This exposure has been dealt with by
the project team by specifying a capped price for the construction of the full
primary and secondary distribution system. If this is incorporated into the
final construction contract, and the costs of constructing the full system as
specified exceeds that bid by the contractor, then the additional costs will be
required to be met by the contractor.
If a subsequent decision is
made to reduce the scope of the distribution system once the location of
initial offtake points is known, it may be possible to reduce the secondary
distribution system cost. The draft contract specifies a formula of how the
price will reduce to scope reductions and a less extensive system. Any scope
reduction would need to be a business decision made by the RWSS GP and its
investors at the time balancing the benefits and costs associated with capex
deferral; although we understand that preliminary work is being undertaken in
this regard.
Land acquisitions are
underway with one farm acquisition already completed. The management team
advises that the land owners approached to date are willing to sell their
properties however final purchase prices have not yet been negotiated. HBRIC
anticipates having conditional contracts for these purchases by 30 September
but this is not a condition precedent.
A fixed price construction
contract typically has a number of conditions specified by the contractor which
need to prevail in order for the fixed price to hold. The current draft of the construction contract
provides a very limited range of circumstances under which the contractor can
increase its price. These relate primarily to force majeure provisions for
natural events such as floods, earthquakes etc. and for variations to scope
requested by investors in the project.
One of the major risks faced
on large construction projects is geotechnical or ground condition risks. This
is the risk that underground conditions are not as expected requiring further
excavation or more extensive foundation works for the project. This is normally
mitigated by carrying out borehole and other underground investigations to
confirm the nature of the ground on which the project will be built.
HBRIC has carried out its own geotechnical surveys and OHL-Hawkins has carried
out further work. On the basis of this work OHL-Hawkins has indicated it is
willing to take on all geotechnical risks. This is reflected in the current
draft contract and confirmation of this in the final construction contract will
eliminate a major construction cost risk for investors.
Time certainty
OHL-Hawkins has specified a
completion date for the construction and commissioning of the dam in its bid.
The proposed contract terms require damages to be paid to the Scheme owners in
the event that the Scheme is completed later than the specified date. These
damages are capped, which normal practice in construction projects but means
that if the delay exceeds a certain amount of time the damages sum will not be
sufficient to fully compensate the investors for their loss. These damages are
underwritten by a performance bond lodged by the contractor which is used to
pay investors in the event that damages payments are triggered. Again this is
normal construction practice.
The construction period has
a specified trigger to set the start date, typically the signature of a final
construction contract at financial close. The fixed bid price also typically
has a validity period beyond which the contractor is free to increase its
price. We note that the Scheme has experienced delays to date and further
delays may be encountered in reaching financial close. This creates a risk that
the construction price may increase or, if delays are significant, the contractor
may withdraw from the bid process.
Performance risk
The Scheme will need to
deliver water at a specific pressure to farm boundaries across the full
irrigated area. This has been specified as part of the bid process and has been
updated in the 16 April update to the owners
requirements document.
During our discussions with management we were advised that OHL-Hawkins has
confirmed that its design will meet these specifications.
The specifications and
testing procedures will need to be confirmed in the final construction contract
together with the damages payments which the contractor will make in the event
that the standards are not met. The draft construction contract currently has
no provision for specific liquidated damages in the event that the system fails
to meet the performance specification; however it specifies that the owner is
not required to accept the works until they have passed a performance test.
Consequently the owner should have recourse to damages for delay in the even
that performance test are not met or rectification work is required to meet
them.
The current performance
specifications do not appear to include a maximum coincident demand flow rate
or pressure however we understand that the scheme has been modelled assuming
that every offtake is running simultaneously at its maximum design flow –
(i.e. it has been modelled at peak flow). Further pipes and pumps have been
sized to accommodate this peak flow. It is anticipated that the scheme will
normally run below the peak design flow due to the large number of shareholders
and diverse farming practices throughout the RWSS command area and that peak
flow may only be reached 1 or 2 times a year (if at all). The system is
however capable of delivering water to every user simultaneously at design
flows.
Conclusion
The tender process is
complete and a preferred contractor selected. The contractor has provided a
fixed price against a scope and performance specified by HBRIC which has also
taken professional advice throughout the process to date. The definitive
allocation of risk between investors and contractor will however only be
confirmed once a final construction contract is signed and we note that the
negotiation of this contract is not yet complete. Our overall comments are as
follows:
· The tender process has been competitive
attracting a wide range of high quality bidders. This is likely to have
resulted in a competitive construction price.
· The structure of the RFP, specifically
requesting a fixed price for design and construction is good practice and is
designed to push price and scope risk back to the contractor.
· The pricing for the secondary distribution
has been designed to deal with the nature of the proposed irrigation
investment. The capped price for the full system isolates investors from scope
and price risk for the construction of the full distribution system but some
exposure remains if a less extensive system is eventually built using the
current pricing structure. This later issue was covered in the bid
documentation with a formula for price reductions but needs to be clarified in
the final contract.
· Allocation of geotechnical risk to the
contractor removes a significant cost risk to investors.
· Whilst the outcome of the RFP process has,
subject to contract negotiations, provided price and programme certainty, other
factors in the Scheme could cause the construction cost to increase above the
current expected level. Specifically any unexpected consent conditions or
further delays to financial close could enable the contractor to seek increases
to the price bid.
· The contractors bid price has been based
on performance and other specifications developed by HBRIC and its advisors.
Should these prove deficient in any way resulting in inadequate performance of
the Scheme there is unlikely to be any recourse to the contractor for damages
or compensation and investors would need to meet the full cost of any
rectification required.
· Operation and maintenance costs are
currently only budget estimates while there has been no bid process to confirm
these they were developed by an experienced operator and reviewed by
HBRIC’s engineering advisor.
Appendix 4 sets out a risk register that summarises
the key risks of the RWSS from a capital cost perspective, how these are
mitigated and an assessment of the probability of these risks materially
impacting on HBRIC.
|
Peer
Review of the Ruataniwha Water Storage Scheme Business Case
|
Attachment 1
|
6. Business
Model
Introduction
As set out in the business
case RWSS LP will carry out the business of designing, constructing and owning
the RWSS. Ruataniwha Water GP is the company that governs and operates the
Scheme.
The underlying business
model is relatively simple. Revenue will be sourced from the sale of water to
farmers under long term WUA (the primary source of revenue), the sale of spot
water and the sale of surplus electricity. The cost structure will comprise the
operating and governance costs of operating the Scheme and financing costs.
The primary business driver
is the rate of uptake of water by farmers.
Economic Analysis and Demand Assumptions
The economic assumptions
underpinning the business model are supported by an independent farm
profitability study undertaken by agribusiness consultant Macfarlane, an
independent demand and uptake analysis undertaken by infrastructure advisor,
Castalia, and also an internal process undertaken by HBRIC and its legal and
financial advisors to collate expression of interests (EOI).
Demand for irrigation water
is premised on the assumption that irrigation will facilitate increased farming
profitability and reduced weather risk. The Macfarlane Rural Business farm
profitability study undertaken in September 2012 provided an analysis of the
direct economic benefits that may result from the RWSS. This study informed the
Castalia demand study, originally completed in September 2012 and updated in
November 2013, which sought to forecast the phased uptake profile for
irrigation water. The EOI process undertaken in 2013, which ran from early March
until the end of August, has provided further confirmatory analysis and broadly
reinforced the findings of the Macfarlane farm profitability and the
Castalia demand studies.
Macfarlane
Rural Business Farm Profitability Study
The Macfarlane farm profitability
study sought to assess the improvement in farming profitability that may result
from the RWSS. Specifically, this economic study analysed farm profitability,
expressed as EBIT $ per hectare (ha), including the cost of water, and the
corresponding return on irrigation, expressed as percentage rate of return on
the marginal capital invested. The Macfarlane study included the following
parameters and key assumptions:
· Modelling analysis was based on 91M m3
of annual storage water sufficient to irrigate 25,000 ha, which equates to a
weighted average 3,741 m3 per ha per annum, plus a further 17,000 of
farmland influenced by the base irrigated area to give a total area of 42,000
ha affected.
· Land use under irrigation is expected to
move towards more intensive and profitable farming systems as driven by
relative profitability, soil type and also farm owner’s preferences; and
modelling analysis specially assumed 37% of the irrigated area would change to
dairying, 32% mixed and intensive arable farming and remaining 31% consisting
of mixed finishing farms, dairy support, orchards and vineyards.
· Base case water charges
were assumed to be $0.20 per m3longer run average forecast commodity
prices were applied, and farm productivity was assumed to be in the top-20% for
reasons related to modern irrigation technology, higher debt servicing and
associated motivations and improved technical skills and in particular the
confidence that irrigation provides to farmers to farm more intensively through
– for example – higher stocking rates.
· Analysis assumed an estimated weighted
average current farm capital investment valuation of $21,200 per ha or $890
million, weighted average new farm capital investment of $8,779 per ha or $369
million, with a weighted average post investment farm capital valuation of
$29,982 per ha or $1.258 billion.
We note that the Macfarlane
analysis was not updated for the move to the $0.23 per m3 with a
pressurised system now proposed but the EOI process discussed below was based
on the higher price and a pressurised system.
Table 6 below summarises the
Base Case results of the Macfarlane Rural Business farm profitability analysis
expressed as return on assets (“ROA”). This analysis shows that
under the Base Case assumptions, ROA are projected to increase from 4.2% to
6.6%, with a return on the marginal capital investment of 12.5%. The following
sensitivities are also shown.
· High and low commodity price scenarios[7],
reflecting a 15% variation in Base Case budgeted gross farm revenues and a
corresponding 3% change in farm working expenses.
·
An average production sensitivity was run based on the Ministry of Primary
Industry (“MPI”) Farm Monitoring Report which contrasts with the
Base Case analysis which assumed farm productivity to be in the top-20%.
Table 6: MacFarlane Rural Business RWSS Farm
Profitability Analysis
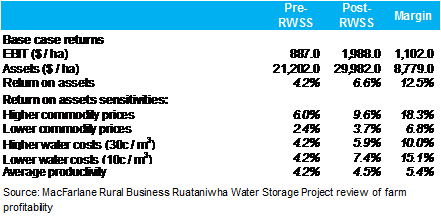
Other key conclusions of the
MacFarlane farm profitability analysis are that EBIT per ha increases by
c.$1,000 per ha (124.1%) as a result of the RWSS, with the value of assets per
ha also increasing from $21,200 before the RWSS to $30,000k after.
The analysis presented above
clearly sets out the importance of the assumption of moving to a farm
productivity level in the top 20th percentile. While the assumption
as regards farm productivity is important this expectation is supported by the
experience with comparable schemes in the South Island. Long run commodity
prices are harder to predict given the variability which inevitably surrounds
such prices.
The Macfarlane land use
assumptions are set out in Table 7 below.
Table 7: Macfarlane Land Use Assumptions

Fundamentally the investment
decision that farmers will face in relation to the RWSS will involve weighing
up the capital costs necessary to effect a change in land use against long run
expected returns on this marginal capital. We note that while capital costs can
be estimated with a high degree of precision long run returns on capital are
harder to predict and will be fundamentally be determined by productivity
improvements cost structures and commodity prices. While farmers have
significant control over productivity improvements and cost structures they
have little influence over commodity prices. While long run trends in commodity
prices can be estimated these are not certain. Further, in the short term
prices can be volatile relative to this long run trend and this volatility can
influence investment decision making.
The following analysis sets
out a series of price charts which show the basis of the Macfarlane commodity
price assumptions set out in Appendix 5 and how certain of these compare
against long run trends.
Figure 1: Milk Price ($/kgMS)
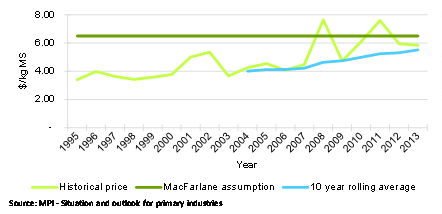
Figure 2: Lamb Price ($/kg)
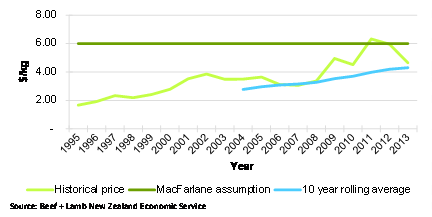
Figure 3: Beef Price ($/kg)
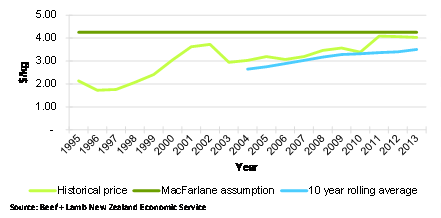
Figure 4: Wool Price ($/kg)
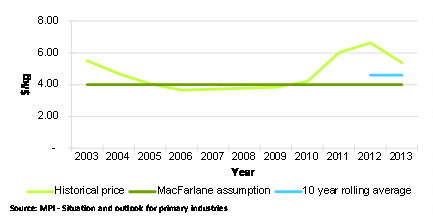
From discussions with
Macfarlane we understand that they are wary of using historic prices and trends
as a predictor of future prices. Their approach is to develop a forward view of
prices based on the fundamentals of the market for each product and trends more
generally for primary sector commodities. They also note that the prices that
they have adopted may appear with optimistic or pessimistic relative to current
prices – but this perception will be influenced by where prices sit at a
point in the commodity cycle for that specific product.
Castalia
Demand Uptake Analysis
The Castalia demand study
sought to forecast the phased uptake profile for irrigation water, or more
simply, how many years it is expected to take to sell the available water.
Effectively, the Macfarlane
farm profitability study provided an ‘end state’ or rational basis
for utilising irrigation to intensify farming systems as a means of increasing
profitability. The forecast rate of uptake was based on an assessment of farmer
sentiment and other modelled factors related to the decision making processes
of incumbent and new entrant farmers.
Castalia undertook a survey
to gauge farmer views in relation to irrigation uptake and also the likely
impact on land sale (turnover rates). The survey, conducted anomalously,
(online, by phone and also in written form) had a response rate of around 50%
of the RWSS catchment land area. Survey information was used as a key input in
a demand model, which also included amongst other parameters, milk pay-out, the
cost of water and the rate at which land turned over.
Figure 5 summarises the
projected uptake curve for irrigation water for the RWSS. It sets out projected
demand under the Base Case as well as under the Low and High scenarios. Under
the former, there is an initial influx of demand (which appears to be supported
by market data as discussed later), which then grows steadily year-on-year,
until it peaks at 97.5% in the financial year ending 31 March 2028. At this
point, circa 100 M m3 is being demanded, out of a possible 104 M m3.
Uptake is similar under the High scenario, although maximum demand is reached a
year earlier, whereas under the Low scenario, it takes 25 years for demand to
reach 97.5%.
We understand the updated
Castalia report provided in November 2013 provided only a Base Case uptake
profile and the low and high case scenarios were put together using the
Castalia model by Trustpower and are therefore reflective of an equity
investor’s viewpoint. Ultimately there is any number of plausible
scenarios. For the purposes of the financial modelling and demonstrating the
risks or benefits of low or high scenarios the scenarios have an appropriate
range. We have undertaken further sensitivity analysis with a more severe
downside case in section 8.
Figure 5: Projected Demand Uptake
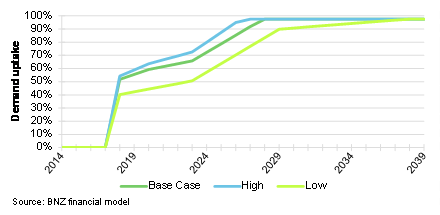
As highlighted in Figure 5
above, under the Base Case, and assuming a storage capacity of 104 M m3,
uptake from incumbent farmers as at the initial period is forecast to be 52%,
and full uptake is forecast to be achieved by year 12. Castalia noted
following:
· Uptake between year 2 and 12 is driven by
slower adopters, who will over time cautiously evaluate their neighbours’
experiences before electing to either intensify their farming systems or sell
their farms.
· Farmers with existing intensive farming
operations tended to have a better understanding of the implications of RWSS
participation than those farmers who currently had extensive farming
operations, who were more likely to adopt a ‘wait and see’
approach.
· Around 40% of survey respondents were
older than 65, indicating a need for farm succession and the likely potential
increase in farm turnover rates.
· Observed uptake rates based on recent
completed Canterbury irrigation schemes do not provide compelling evidence, as
uptake rates on these schemes were driven by significantly lower water costs
which provided immediate capital gains; whereas the economic benefits of the
RWSS are expected to be achieved over a longer investment timeframe.
· Despite this observation for the purposes
of comparing the uptake profile in a number of these schemes to the proposed
profile for the RWSS, HBRIC has in conjunction with the developers of the
schemes prepared the following analysis with an estimate of the initial uptake,
current uptake and the time to reach this position. As discussed the ownership
structure and pricing structure of these schemes all differ from RWSS but
nonetheless it does provide some guidance as to the value that farmers place on
water and the relative time taken to reach a reasonable level of uptake.
Table 8: Irrigation
Scheme Uptake Timeline
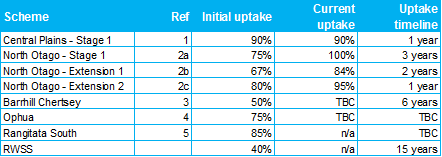
Sensitivity analysis showed a high case
forecast uptake at the initial period of 54%, and a forecast full uptake
achieved by year 11. A more extreme low case showed forecast uptake at the
initial period of 40%, and a forecast full uptake not achieved until 2040 (over
20 years). We understand that the low case was intentionally structured to be
disproportionate to ‘moderate’ the high case scenario.
The Figure opposite is
sourced from the business case and demonstrates the change in land use
anticipated by the base case demand analysis prepared by Castalia.
Figure 6: Existing and Anticipated Land Use
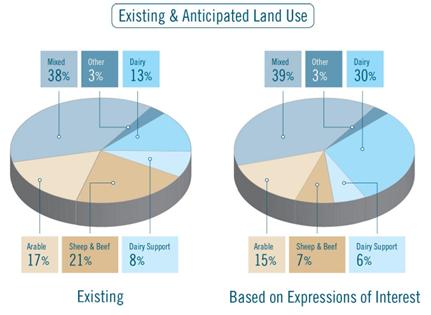
We note that the Castalia
analysis results in different expectations of land use change to that assumed
by Macfarlane based on their analysis of the most profitable land use.
While there is some
divergence between the Macfarlane assessments both parties anticipate very
significant land use change and the direction of the change is consistent.
HBRIC EOI
Process
In parallel with the above
analysis HBRIC has undertaken a process to establish a non-binding EOI for
water from the RWSS. The EOI process was run in the middle of 2013 and the
responses received indicated that water demand is c.40% of the maximum available
water.
The EOI contained key terms
and conditions which were expected to form part of a binding WUA which is
expected to be available for signing over the coming months. Key terms of the
EOI, which were expected to be carried across to the draft Water User
Agreement, are as follows:
· The WUA will be a
“take-or-pay” agreement with an initial duration of 35 years (1
Concession Period). However, water users will likely be able to supplement
their committed water take by purchasing up to an additional 100% of their
signed volume on the spot market. Prices have indicatively been estimated at 3
times those under the Agreement.
· The available water under the RWSS will be
allocated on a “first-come, first-served” basis, meaning that those
who delay signing up run the risk of receiving less water than they want or
potentially no water at all.
· The agreed delivery point for water will
likely be within 2 kilometres of the Water User’s boundary, at a pressure
or no less than 1 bar. The exact delivery location is subject to future
negotiations and will depend at least in part on the design of the distribution
network.
· The Water User will likely have to comply
with certain environmental management plans.
· If the WUA is signed before financial
close, the Foundation Water Users will be offered early uptake incentives,
which may include a discount on the water price ($0.06 per m3 for
the first 4 years of the Concession Period) as well as an opportunity to invest
in the water distributor.
· The indicative price range was $0.22 to
$0.25 per m3 (in 2013 dollar), less any applicable discounts. The
final price of $0.23 per m3 has since been selected from this range.
In addition, there will also be an energy charge of $0.03 per m3 for
delivered water.
· The Water User Agreement is transferable
in part, or in full, if the land is sold.
Draft
Water User Agreement
We have been provided with a
copy of the draft Water User Agreement (“WUA”) that is currently
being discussed with farmers. The key terms of the WUA are broadly consistent
with those tested through the EOI process. In particular we note the following
key terms:
· A volumetric charge of $0.23 m3
take or pay.
· An energy charge of $0.03 m3
for delivered water.
· An initial supply period of 35 years (to
2049).
· A right of renewal for a mutually agreed
period of up to 45 years.
· A “Foundation Water User”
discount of $0.06 m3 for 4 years.
· Condition Precedent 1 – which
requires that the RWSS LP confirms that the distribution network will service
one of the nominated delivery points.
· Condition Subsequent 1 which requires the
parties to agree the terms of a Farm Environmental Management Plan (FEMP) by
the first supply date.
· No liability for delivery failure caused
by climatic conditions.
· Payments monthly in advance commencing in
June each year 3 months prior to the start of the irrigation season.
· Credit support in the amount of two years
contracted water charges.
The WUA requires the farmer
to commit to a substantial financial obligation for an extended period. The
farmer can only be released from this obligation where the rights and
obligations under the agreement are permanently transferred to a party approved
by the RWSS LP.
As part of their investment
decision process farmers will need to assess the implications of the
requirement to commit to a FEMP. The FEMP needs to set out how the farmer
intends to comply with the RWSS consents to the extent these apply to each
particular farm.
Generation Assumptions
As discussed earlier,
revenue derived from hydro-electricity provides an additional revenue stream
for the Scheme. We understand that the long-run generation revenue is premised
on a number of key assumptions which include the following:
· The RWSS generates 26,000 megawatt hours
(“MWh”) per annum in a determined seasonal pattern. Of this
approximately half will be used for the schemes own use and the remaining
portion sold to generate electricity revenue.
· The long run price is $93.71, although
this is offset by a $12.50 discount which is the estimated discount required to
achieve a fixed price, variable volume power purchase agreement.
· A downward adjustment of 9% is applied to
electricity generated with water delivered under the RWSS to reflect the fact
that the hydro station will not be run to optimise the electricity price but
rather irrigation needs resulting in sub-optimal intra-day and intra-year
generation timing.
· Avoided cost of transmission
(“ACoT”) revenues total c.$340,000 per annum[8]. We note this
revenue stream is dependent on the scheme operating at specific times in the
year which may be outside of the control of the operator and it is therefore at
risk, The revenue only comprises approximately 1.2% of total revenue once full
uptake is achieved (or 2.4% in year 1 when uptake is assumed to be 52%) so is
not overly material to the financial returns. Further there is a review being
undertaken by the Electricity Authority on the ACoT charging regime which may
have a negative impact on the availability of these revenues, despite the
review only being at an early stage.
Operating Cost Assumptions
Unlike the Design and
Construct (“D&C”) Agreement, the Operations and Maintenance
(“O&M”) Agreement is not yet agreed. We understand that over
the coming months this part of the Scheme will be put to tender. In the
interim, the operating costs have been estimated based upon initial values
which are escalated over time. The only exceptions to this are the Centralines
charges, which also have a non-indexed component, and mitigation costs which
follow their own profile. Specifically, operating costs include:
· Pump energy
· Pump and distribution maintenance (aligned
with uptake)
· Maintenance dam, generation plan,
communications, Centralines charges
· Mitigation costs
· Special Purpose Vehicle
(“SPV”) management costs
|
Peer
Review of the Ruataniwha Water Storage Scheme Business Case
|
Attachment 1
|
Discussion
The RWSS is a complex Scheme
that differs from other similar schemes in several important respects in
particular:
· The scale of the Scheme;
· The motivation for the Scheme is heavily
influenced by environmental and wider social and economic benefits in addition
to the on-farm economic benefits of accessing reliable water;
· The Scheme is not farmer owned to any
material degree;
· There is expected to be a substantial
shortfall between available and contracted water at financial close.
However, in other respects
the RWSS is expected to mirror the experience of other schemes. In particular
access to reliable water is expected to drive changes in land use and farm performance
to improve farm profitability to a degree which justifies contracting for water
at the proposed price.
The possibility of the RWSS
has been mooted for an extended period. Further, the benefits of access to
reliable water are well understood and there are extensive examples as to how
such access promotes land use change and improvements in on-farm performance.
Nonetheless the decision to
sign up to the WUA represents a major investment decision by farmers both in
terms of the financial obligation that they assume and the on-farm capital
expenditure that they will need to commit to in order to benefit from access to
water.
HBRIC and its advisors have
undertaken extensive analysis to try and estimate likely demand both
immediately and over time. While in the long run it is reasonable to expect
that land use will trend toward the end state projected by Macfarlane in the
short term numerous factors could impact on farmer willingness to sign up
within the window through to the end of September 2014.
In this regard we note that
the draft BOI require more stringent controls on nitrogen than had been
proposed by HBRC. We expect that these requirements will add a further element
of uncertainty to farmer decision making particularly if these requirements are
considered to reduce or eliminate transition to certain of the farming systems
envisaged by Macfarlane.
Conclusion
The pace at which farmers
contract to take water from the RWSS is a major driver of the financial
performance of the scheme. HBRIC and its advisors have undertaken extensive
analysis to assess the likely demand for water under the terms and at the price
point currently proposed.
While farmers have had a
considerable period of time in which to contemplate potentially contracting for
water until recently there has been considerable uncertainty. The iterative
nature of the overall process has looked to consolidate construction price,
water price, capital structure and the consenting framework simultaneously and
as a result there has been uncertainty for farmers as to whether or not the
RWSS would proceed.
We believe that the work
undertaken by Macfarlane and Castalia does provide comfort that farmers will
value access to certain water and therefore will contract for water in the
necessary volumes over time. Evidence from other schemes provides additional
comfort in this regard notwithstanding the unique characteristics of the RWSS.
However, farmers are being
asked to make a significant contractual commitment – with consequent
requirements for significant on-farm capital expenditure – within a
relatively short period of time and with the added complexity of having to
assess the implications of the draft BOI determination.
|
Peer
Review of the Ruataniwha Water Storage Scheme Business Case
|
Attachment 1
|
7. Ownership
Model and Investment Structure
Introduction
During financial feasibility
BNZ Advisory determined that a demand uptake gap was likely to exist relative
to a level that would attract sufficient capital at market returns. Accordingly
a significant challenge for the RWSS has been to develop a hybrid capital
structure that can provide sufficient capital in total to fund the Scheme while
meeting the investment return and risk requirements of different categories of
investor until the Trigger Date.
The final capital structure
is yet to be locked down but is expected to be provided from a combination of
arm’s length sources (institutional investors and bank debt), related
parties (farmers, local investors and local Iwi) and discounted capital (Crown
Irrigation and HBRIC). We discuss below the current status of the ownership
model and investment structure as documented in the business case.
Ownership Model and Investment Structure
CIIL is a Crown-owned
company, established to make bridging investments in regional water
infrastructure development on behalf of the New Zealand Government. HBRIC has
been in discussions with CIIL in relation to potentially providing funding to
the RWSS. It understands that CIIL is prepared to consider accepting a
sub-commercial return on its investment to facilitate achievement of the
economic benefits of the Scheme.
The final RWSS capital
structure is expected to balance a mix of public and private sources of funding
and financial instruments to suit each investor’s risk and return
requirements. The following table summarises the capital structure (subject to
final negotiations) which is assumed in the Base Case.
Table 9: Base Case Capital Structure
|
Financing
Sources
|
Indicative
Investment
|
|
HBRIC Ltd
|
Up to $80
million
|
|
Institutional
Investors
|
> $50
million
|
|
Crown
Irrigation Investments Ltd[9]
|
TBD
|
|
Tukituki
Investments LP / He Toa Takitini
|
> $10
million
|
|
Total
funding sources
|
$276
million
|
It has not yet been determined whether the
capital structure will include senior debt at financial close.
The RWSS will be
implemented as a BOOT contractual arrangement with a 70 year Concession Period
from the start of construction. At the end of the Concession Period, RWSS LP
assets will transfer back to the community: primarily Council, but with a
minority interest continuing under eligible investors in the Tukituki Investments
LP, and potentially local Maori interests. The business case includes the
following diagram to illustrate the likely ownership structure and investment
model.
Figure 7: Business Case Capital Structure
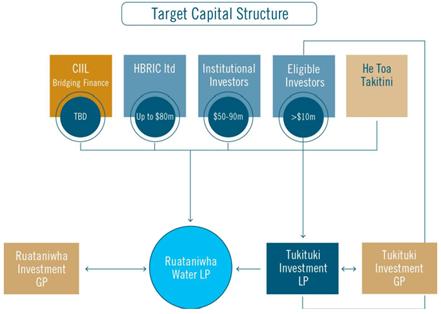
The limited
partnership structure is intended to allow for flexibility of classes of
financial instruments, with each investor having bespoke requirements with
different risk appetites, incentives, and investment exit needs. Therefore, a
mixture of debt, hybrid, and equity financial instruments are required.
Capital Structure Composition and
Milestones
The capital
structure composition between public and private investors is envisaged to
change throughout the Concession Period based on investors’ requirements.
RWSS milestones, and resultant changes in the RWSS capital structure, are
summarised in the following diagram sourced from the business case with
approximate dates based on Base Case assumptions. The diagram shows the
transition from majority public funding (comprised of HBRIC and CIIL) and the
repayment of the CIIL funding with a full exit of CIIL at full uptake. The
diagram also shows a continuing of this trend which is the result of increasing
amounts of bank debt. The Base Case then assumes a repayment of this debt at
the 2050 resource consent renewal (not shown) and subsequent refinancing post
the consent approval. As discussed later there are a number of options
available to RWSS at this point which may in fact result in a different capital
structure to that shown below.
Figure 8: Changes to RWSS Capital Structure through 70 Year
Concession Period
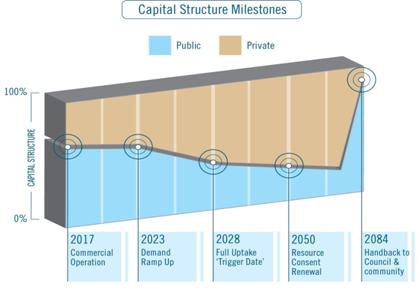
|
Peer
Review of the Ruataniwha Water Storage Scheme Business Case
|
Attachment 1
|
HBRIC LTD (Equity Investment)
It is currently
anticipated that HBRIC will invest up to $80 million in the RWSS LP. The final
amount invested by HBRIC will be scaled based on the level of securities
subscribed to by other investors in the RWSS LP.
HBRIC’s
investment will be an ordinary equity security in all respects, other than the
share of distributions during the demand uptake period. Equity allows HBRIC to
have proportional ownership of the RWSS LP and share in the demand uptake risk
to ensure the RWSS proceeds. This includes the right to appoint directors to
the board of Ruataniwha Water GP.
Cash flow
distribution to HBRIC is based on free cash flow after operating costs, debt
servicing (on bank debt and Tukituki Investments LP hybrid security), CIIL
coupons and repayments, and Institutional Investors’ investor fee. Free
cash flow is then proportionally distributed to HBRIC LTD depending on the
level of demand uptake:
· Before demand uptake reaches
the Trigger Date (earlier of 95% demand uptake plus two years, or 100% uptake),
cash distributed between HBRIC and Institutional Investors (not including
Tukituki Investments LP until hybrid security converts to equity); and
· After the Trigger Date, the
distribution is pro rata to total equity.
The distributions
are such that before the Trigger Date, HBRIC’s target return is a
sub-commercial financial return that reflects the positive externalities and
public value attributable to the Scheme outside purely financial metrics, and
the fact that the majority of assets will transfer back to the Council at the
end of the Concession Period. Post-Trigger Date, HBRIC’s return will be
the same as other equity investors, with a target return of approximately 10%
(a commercial return for similar brownfield investments).
The following description of
the key terms of the CIIL, Institutional and Farmer Note funding is all based
on the current negotiated positions as set out in the business case. We have
not evidenced any draft shareholder agreements which we would expect to set out
key investment terms and triggers for certain events. On this basis it would be
our expectation that HBRIC will use its discretion to continue to negotiate its
position with each respective funder and that the final shareholder agreements
will reflect terms at least as favourable as discussed below.
CIIL (Hybrid Security)
CIIL has
expressed a strong preference to invest in the scheme as a subordinated debt
provider to minimise its exposure to usual equity risks (for which there is
commercial appetite), focusing instead on uptake risk.
CIIL’ s
funding is particularly important for sharing demand uptake risk with HBRIC
LTD. CIIL will share in the demand uptake risk and accept a sub-commercial
return in order to facilitate the creation of the Schemes economic benefits,
including national GDP growth and employment. Whilst still being negotiated,
CIIL’s repayment structure will likely be linked to uptake. As such, if
demand uptake takes longer than Base Case model assumptions then repayment of
CIIL’s capital will likely be delayed. This benefits both the RWSS
economics and HBRIC’s risk profile as a slow uptake profile will result
in a slow repayment profile for CIIL.
As CIIL exits,
there may be a requirement for cash from investors to fund whatever part of the
CIIL debt that cannot be paid down from RWSS operating cash flows or draw-downs
of bank debt. This is particularly so in the event of very slow uptake (albeit
a phased CIIL exit partially mitigates this).
Tukituki
Investments LP (Hybrid Security)
The Preliminary
Information Memorandum for the public offer to eligible investors in the
Tukituki Investments LP has been released, with expressions of interest due by
30th April. Eligible investors are defined as persons who:
· Have signed a WUA for water
from the RWSS LP;
· Are landowners within the RWSS
irrigation footprint; or
· Are Hawke’s Bay resident
individuals or businesses; and
· Who are “eligible
persons” for purposes of the Securities Act 1978.
The minimum total
subscription is for $10 million, but the RWSS LP will accept subscriptions in
excess of this. Eligible investors will invest in a hybrid security with a cash
paid coupon converting to common equity at the Trigger Date (full or close to
full uptake).
The Tukituki
Investments LP will be an intermediate investment vehicle to pool eligible
investment. Eligible Investors (limited partners) would invest in the Tukituki
Investments LP and hold a stapled interest (providing governance but no
economic rights) in the general partner of the Tukituki Investments LP. The
Tukituki Investments LP would then invest the proceeds of the public offer into
RWSS LP. The terms of the Tukituki Investments LP include:
· Investment will be by way of an
intermediate Limited Partnership, which will have the sole purpose of investing
in the RWSS LP;
· Minimum subscription of $50,000;
· Cash paid coupon of 5.0% per annum;
· Second ranking in the cash flow waterfall,
behind bank debt only, this is the intention but may depend on the final
negotiation with CIIL regarding the priority of its funding;
· Conversion to common equity once full
uptake has been achieved;
· Perpetual ownership in the RWSS assets,
beyond the end of the Concession Period;
· Voting rights; and
· Exclusive right to nominate one of the
RWSS LP Board’s Independent Directors if subscriptions exceed $25 million
in aggregate (other investors will have the right to veto any nominations and
ask for another nomination).
The cash paid
coupon is expected to be attractive to farmers looking to invest in the RWSS
but who require certainty of cash flow to help offset the cost of funding the
investment.
He Toa Takitini
The business case
notes that there is the possibility that He Toa Takitini (a local Treaty
claimant group) may also be a direct investor in the Scheme through their
treaty settlement. The structure and quantum of investment is unknown as treaty
negotiations are currently in progress.
Institutional Investors (Equity
Investment)
It is anticipated
that Institutional Investors will subscribe to interests between $50 million to
$90 million in the RWSS LP. This will be an ordinary equity security in all
respects, but will benefit from an investor fee which is prioritised over
distributions.
Investment
returns to Institutional Investors are by way of an investor fee and free cash
flow distributions. The investor fee is designed to provide a partial shield
for Institutional Investors investment during demand uptake by targeting a
minimum return, before remaining cash flow is distributed to equity. Through
the investor fee mechanism, risk-adjusted return requirements for private
capital are below what would otherwise be required. Furthermore, the investor
fee allows Institutional Investors to realise returns at the front end of the
Concession Period, a requirement given their investment amortises to zero at
the back end when the assets are transferred back to the Council.
Importantly if
the investor fee it is unable to be paid (i.e. insufficient cash flows) the
fixed dividend will capitalise and compound but will not trigger any default.
The payment of the fixed amount (including capitalised amounts) will rank ahead
of any distributions to HBRIC. The breakeven for the fixed dividend (i.e. where
cash flows are sufficient to ensure no capitalisation) is dependent on the
overall capital structure and uptake levels. BNZ Advisory have run a scenario
which shows under the Base Case the breakeven point for full repayment (no
accrual) of the investor fee is approximately 55% to 60% uptake.
Discussion
The capital structure
currently proposed reflects the need to balance the requirements of different
investor categories and the reality that the RWSS is not a commercially viable
Scheme at establishment given the forecast level of pre-sales. We understand
that more work is required to confirm the investors, the quantum of capital
committed by each and the exact terms under which they will invest. Until these
matters are finalised the capital structure – and the implications of
this for Scheme viability – must necessarily be regarded as indicative
only.
We note that if bank debt is
incorporated into the initial capital structure, it is likely to be on the
basis of relatively low gearing. Again, this is a function of the expectation
that there will still be a substantial shortfall in take-up in the early years
of operation of the RWSS. For other similar projects where a substantial
proportion of uptake is contracted from the outset senior debt has typically
made up a very substantial portion of the initial capital structure. While this
is a limitation of the RWSS initially as the Scheme trends toward full uptake
then the ability to access and service a significant quantity of senior debt
will improve.
We understand from
discussions with BNZ Advisory that the possibility of introducing some senior
debt into the opening capital structure is being considered and that terms for
senior debt are in the process of being negotiated.
The combination of public
and private capital in the proposed capital structure creates additional
complexity. It is essential therefore that all investors understand how their
returns adjust under different scenarios. At our request BNZ Advisory has
undertaken extensive sensitivity analysis to demonstrate and explain how the
returns to HBRIC and other investors vary as key assumptions underpinning the
financial projections are varied.
Conclusion
As noted above the capital
structure for the RWSS has yet to be finalised. The make-up of this capital structure
is as important as the quantum of capital raised. In particular:
· The aspirations of the different investor
categories need to be compatible;
· The terms under which investors are
prepared to commit their capital need to be acceptable to HBRIC and the other
investors;
· A substantial portion of capital needs to
be provided on non-commercial terms through the initial period.
In this respect the terms
and quantum of the CIIL investment are critical. Not only is it proposed that
this capital be priced on below commercial terms the proposed redemption
profile is linked to water uptake. This aspect of the CIIL investment provides
significant protection to HBRIC through the initial period and is critical to
the viability of the Scheme.
In addition to providing
capital, investors in projects of this nature can typically bring other
positive attributes including technical knowhow and governance skills. In this
regard it is disappointing that Trustpower has decided to withdraw from the
Scheme. We understand that Trustpower had played a valuable role through the
procurement process and in validating the financial analysis of the RWSS
undertaken by BNZ advisory. The technical skills that Trustpower might have
been expected to contribute through the balance of the construction phase in
particular, will now need to be replaced by professional advisors unless an
investor with similar attributes to Trustpower can be identified.
The analysis undertaken
below demonstrates that the financial case for the RWSS investment is finely
balanced. Therefore, any material change to the current capital structure or
related terms could impact on the risk of HBRIC’s investment.
|
Peer
Review of the Ruataniwha Water Storage Scheme Business Case
|
Attachment 1
|
8. Financial
Projections
Base Case financials under
the two capital scenarios
As noted above the key drivers
of the financial performance of the RWSS are:
· The capital cost to establish the RWSS
infrastructure;
· The operating cash flows which are
primarily influenced by assumptions as to demand uptake; and
· Capital structure which allocates the
operating cash flows between the different investor categories.
The capital costs and
operating model are largely locked down – although the actual operating
performance of the Scheme will depend on the rate of uptake which we have noted
is uncertain. However, at this stage there is still considerable uncertainty as
to the final capital structure both as to the mix of investors and the quantum
of capital that each will introduce.
The capital structure
settled on is important as this:
· Influences the relative risk assumed by
each category of investor;
· Impacts on the phasing of cash flows and
the returns achieved by the different investor categories;
· Will be underpinned by investment
documentation that sets out the rights and obligations of investors under
different scenarios;
· Determines the degree of financial
flexibility in the capital structure.
Until this capital structure
is finalised any financial projections need to be considered as illustrative
only.
For the purposes of our
analysis we have assumed two Base Case capital structures being:
· Structure A – assumes no senior debt
at financial close but introducing debt in the first few years of operations
· Structure B – assumes senior debt at
financial close
The diagrams below
illustrate the capital composition under each structure.
Figure 9: Capital Structure Scenarios
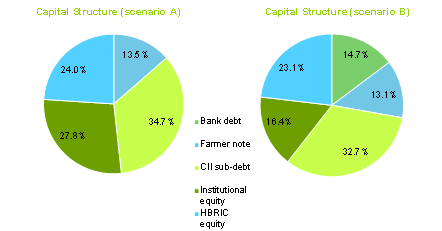
Under Structure A HBRIC
equity is drawn down first followed in tandem with the first tranche of the
farmer note, then CIIL capital and institutional equity. Under Structure B
senior debt is drawn down alongside HBRIC from day one of construction.
The diagrams opposite
illustrate the phasing of capital drawdown during construction under each
structure.
Figure 10: Construction Funding Mix (Capital Structure A)
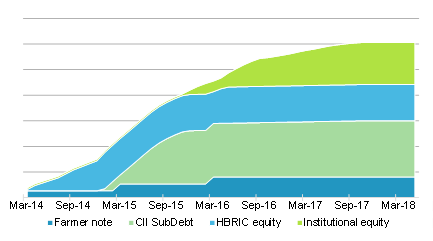
Figure 11: Construction Funding Mix (Capital Structure B)
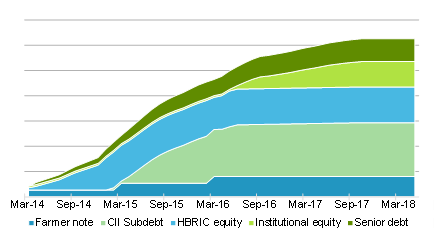
|
Peer
Review of the Ruataniwha Water Storage Scheme Business Case
|
Attachment 1
|
Capital Costs
The following table
summarises the total capital cost for the RWSS and capitalised operating costs
during the design and construction period, which is expected to run from financial
close to the start of the 2017 irrigation season (estimated to be the fourth
quarter of the 2017 calendar year).
Breakdown
of capital costs
Table 10: Breakdown of Capital Costs
|
Item
|
$
|
%
|
|
Dam, Generation & Distribution
|
$243.0 million
|
87.9%
|
|
Development costs, land, ancillary roads and surveying
|
$21.8 million
|
7.9%
|
|
Construction Period Operating Costs
|
$11.7 million
|
4.2%
|
|
Total Capital Cost
|
$276.5 million
|
100.0%
|
The capital cost expenditure profile is
established in the Model in line with the agreed milestone payment schedule
provided by the OHL - Hawkins consortium. This profile appears broadly in line
with a standard s-curve profile. Operating costs during construction are
expected to follow a reasonably linear trajectory over the construction period.
Land acquisition costs are assumed to be incurred at financial close at which
point the existing (largely spent) development costs are also capitalised into
the Scheme and treated as an upfront equity contribution from HBRIC.
The following table sets out
the construction cash flows at respective financial year end.
Table 11: Construction Expenditure Profile
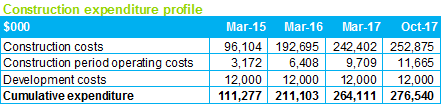
The capital costs include a
budget for operating costs during construction. A breakdown of these costs is
show below. The majority of these costs relate to monitoring of construction
progress and costs by HBRIC’s independent engineer SMEC. Other costs
relate to the RWSS project team including additional resources to support the
continued signing up of new water user agreements and development of the Farm Environmental Management Plan’s
which need to be in place in order for water users to receive water. Additional
costs related to running the special purpose vehicle (“SPV”)
include covering administration and finance functions and Board costs. The
costs shown are the aggregate over the construction period.
Table 12: Construction Period Operating Costs
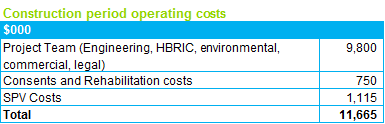
|
Peer
Review of the Ruataniwha Water Storage Scheme Business Case
|
Attachment 1
|
Operating Cash Flows: Key
Assumptions
The following is a summary
of the key operating revenue and cost assumptions for the RWSS as set out in
the Appendix to the Business Case to Council: Financial Case dated 3 April
2014.
Revenue
Contracted water
distribution revenues
Contracted water revenue
comprises the majority of the Scheme revenue (approximately $26 million at full
uptake in 2014 dollars), with the following assumptions built into forecasts:
‘Full Uptake’ has been defined as 104 M m3.
· The financial model assumes contracted
revenue caps out at 97.5% of full uptake (104 M m3) for conservatism
reasons providing a small additional buffer. We have not tested the impact of
increasing this level to 100%;
· The uptake curve used in the base case
financial model has been provided by Castalia Strategic Advisors and assumes
full uptake by 2028, as discussed further below a range of uptake profiles have
been tested.
Additional
‘Spot’ Water Revenues
The financial model assumes
water users will purchase a small level of additional water both during the
uptake period, and thereafter (with either sales to additional or existing
users on a variable basis).
Spot revenue is assumed at
less than 9% of contracted water revenues (approximately $2.3 million (in 2014
dollars) at full uptake), increasing proportionately with uptake.
The current consensus from
the project team is that spot revenues are expected to generally be higher than
the underlying water price, in which case the additional volume implied by the
spot revenue assumptions is lower than 9%. We have not verified this other than
to note that it would be counterproductive to offer a price of less than the
contracted price so on par is a reasonable basis. In an average year there is
approximately 55M m3 of surplus water above environmental flow and
contracted requirements (and more prior to full uptake).
The following figure sets
out the Base Case water volumes. Volumes for 2018 are a part irrigation year of
only 6 months. Ground water consent holders are assumed to be 3.9M m3
and in 2023/24 are shown as part of the contracted water (excluding early
birds) volumes.
Figure 12: Base Case Water Volumes (Million m3)
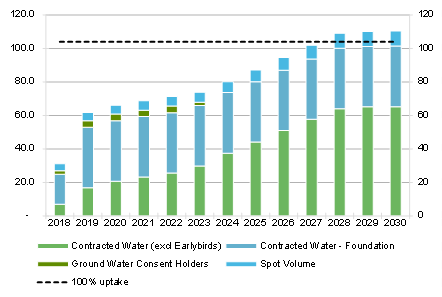
Water Pricing
Water distribution price of
26c/m3 (in 2014 dollars) which as discussed is comprised of:
· Base 23c/m3 (in 2014 dollars)
take or pay portion (regardless of the schemes supply / ability to supply due
to dry year). The draft water user contract assumes that there is no liability
to the Scheme for failure to deliver water;
· A 3c/m3 variable charge
designed to cover variable pumping costs. As this revenue portion is variable
it will fluctuate on an annual basis depending on the level of irrigation
demand.
The Model assumes a flat
26c/m3 price (2014 dollars) with no volume variation because it is
expected if the water volume is lower than contracted take-or-pay volume in any
year (due to either low inflows or low irrigation demand (assumed to be during
a wet year), then the percentage of the 3c/m3 variable charge which
is not received can be replaced by either additional generation revenues
(because this is likely to coincide with a wet year) or offset by a reduction
in variable operating costs, e.g. pumping costs etc. (in setting the 3c charge
we understand that analysis by the technical team indicated that variable
charges are at least 3c and therefore any reduction in revenue received should
be 100% offset by the cost saving in not supplying water.
As discussed it is assumed
that a “Foundation Water User” discount of 6c/m3 (2014
dollars) is applied for the first 4 years of operation for users who commit
prior to financial close. As there is a condition precedent for 40M m3
the Base Case Model assumes this level:
· A reduced price of 10c/m3 (2014
dollars) for deep ground water users for the first 5 years;
· Inflation of 2.0% (in line with all other
inflation assumptions) – the underlying price inflation mechanism in the
water contract is CPI;
· Revenues received monthly (as per proposed
billing, as described in the water contract).
Water Price Affordability
In assessing the
affordability of the scheme to farmers a number of considerations have been
made. As part of the MacFarlane analysis the range of water prices were assumed
with the 2012 report using a 20c m3 assumption (but
non-pressurised). The updated Castalia
demand forecasts assume a 25c m3 price and most importantly the EOI
process used a price range of 22c to 25c m3. In addition to these
project specific reference points it is worth noting the comparability to other
schemes as these are ultimately the litmus test for an affordability band.
Irrigation New Zealand
(“INZ”) has compared standardised costs for the delivery of water
to the farm gate for 20 irrigation schemes throughout the country, primarily in
Canterbury. The analysis includes adjusting for differences in share costs,
fixed costs, variable costs, delivery pressure, any on-farm storage
requirements, and reliability. As the Business Case notes there are two key
differences between the RWSS and existing Irrigation schemes make comparisons
of the RWSS with the INZ report difficult. The first is the capital structure
and the second is volumetric charging for water.
The capital structure of
existing irrigation schemes have a bias towards a co-operative type structure,
this generally involves the investment of capital which does not provide a cash
return but is rather used to provide the lowest possible water price. The RWSS
is focussed on providing an arm’s length water price and does not require
investment by Farmers as a condition for water delivery.
The nature of many of the
schemes considered by INZ is such that they are not really comparable to RWSS
given the historical nature of the investments. The Business Case selects
several schemes for specific comparison to the RWSS after discussions with INZ.
These schemes are seen as being comparable to the RWSS based on a combination
of both age (built within the last 15 years) and the quality of the
infrastructure (i.e. they are not due for significant upgrade). The schemes
are:
· Opuha Water Ltd – Kakahu
· Opuha Water Ltd – Sutherland
· Opuha Water Ltd – Totara Valley
· Barrhill Chertsey Irrigation Ltd
· North Otago Irrigation Company
The following figure sets out a comparison
of the schemes on a hectare and volumetric basis:
Figure 13: Comparison of INZ Selected Schemes to RWSS
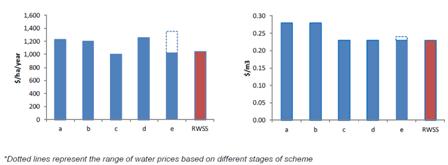
Water distribution costs
range from $1,045/ha/year to $1,348/ha/year, with the RWSS in the bottom half
of the group on this metric; and on a cubic metre range from $0.21m3
to $0.28m3 with the RWSS also in the bottom half of this group. We
note there are a number of simplifying assumptions as part of the analysis and
as such while these are useful as a means of assessing the reasonableness of
the pricing proposed by the RWSS the key proof of the affordability of the
scheme will be in the level of take-up both in the period up to and following
financial close.
Electricity Revenues
We understand that Tonkin
and Taylor has predicted that the power station will produce an average of
26,000 MWh or a capacity factor of 46%. Of this, half (13,000 MWh) is assumed
to be sold to generate revenue with the balance (13,000 MWh) used to offset the
RWSS’ own power requirements for pumping. In addition to the 13,000 MWh
there is an additional amount of 4,800 MWh which is assumed to be purchased
separately. This amount corresponds to the predicted power that is needed to
operate pumps as the power produced is unlikely to be able to meet 100% of
power requirements due to timing differences between RWSS production and RWSS power
demand. These won’t correspond at all times. This cost is assumed as an
operating cost and discussed in the section following.
It is assumed that as the
dam will primarily be used to meet irrigation demand, rather than optimising
for power prices that the power station will not achieve the same level of
profitability as a power station which was built solely for electricity
generation revenues. As a result the Model includes:
· A peaking factor[10] of 91% reflecting
the fact that the dam will primarily be used for irrigation and accordingly may
receive sub-average power prices due to sub-optimal intra-day and intra-year
generation timing (from a power price perspective); and
· A discount factor of $12.5/MWh based on
assumed power purchase agreement with fixed price and variable volume terms.
As discussed above it is
assumed the Scheme will receive ACoT revenues totalling $340,000. While we
consider there is a certain level of risk around this revenue source we
consider this to be a reasonable assumption.
The following chart shows
the electricity prices assumed in the Model. The Australian Securities Exchange
(“ASX”) operates a New Zealand Electricity Futures market for base
load quarterly contracts with a node in the North and South Islands (being
Otahuhu and Benmore respectively). The prices are publically available and we
understand these prices are the basis for the forecasts in the Model. The
prices are based on those observed on 20 February 2012. The pricing for 2017 of
$93.7 has been used as the long run forecast. We have compared the pricing to
current pricing and note that current prices are between 15% and 20% lower.
Since 2012 there have been a number of downward pressures on forward views of
the forecast for electricity prices in NZ the most material being uncertainty
regarding Rio Tinto, concern regarding the proposed Labour/Greens single buyer
market and excess capacity and soft demand forecasts.
With regard to the longer
run forecasts the Model assumes that $93.7 MWh (2014 dollars) is the long price.
This price falls within the range of our own views which fall in the range of
$80 MWh to $95 MWh. We note that there is a wide range of plausible price
outcomes but a reasonable consensus of the views would see lower pricing for
longer (out as far as 2018) before increasing towards the long run marginal
cost which sits anywhere in the range of $80 MWh to $110 MWh.
Figure 14: Electricity Price Path
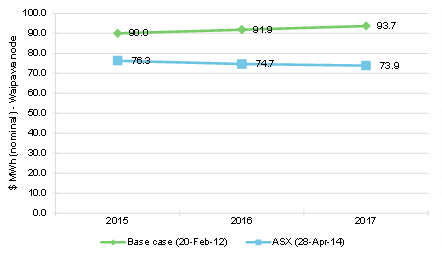
Operating
Cost Assumptions
The maintenance and
operations contract for the Scheme has not yet been tendered. It has been
determined by the D&C evaluation committee that the risk and uncertainty
premium that would be applied to such a contract would be unnecessarily high.
This is driven by two key factors, firstly there is at least a 3 year period
between financial close and the start of the operating period and that the
final Scheme design for the secondary distribution network is unknown. It has
been determined that the risk of not contracting is acceptable given the very
high operating margin providing significant headroom.
Despite there being no
firm contracted position for the operating costs, the costs can be estimated to
a reasonable degree of accuracy and are not a material driver of financial
performance. It is difficult for us to benchmark the costs other than to
comment on the process that has been used to estimate them. We understand that
Trustpower in its former capacity as a potential investor and member of the
Investor Representative Committee provided the initial estimates of operating
costs for the first three items in Table 13 below. These costs have then been
reviewed by SMEC and are considered reasonable over the Concession Period.
The Centralines charges
relate to the upgrade of the transmission and lines network. While it would be
possible to include a portion of these costs in the construction costs it is
generally assumed that electricity distribution companies have one of the
lowest costs of capital and instead it is assumed the cost will be recovered
through the Scheme paying an ongoing operating charge to Centralines.
We understand that the
mitigation costs comprise mitigation, offsets and environmental costs which
were estimated by the consenting team and included as part of the package
during the Board of Inquiry process. We have not tested these in detail as we
understand the cost is fixed and it will be to the discretion of HBRIC and RWSS
if additional is to be spent. Mitigation costs vary across time starting off
with larger investments of $965,000 in year 1, $725,000 years 2 and 3, $473,000
year 4 to 10 and then $147,000 thereafter. We note the financial model assumes
a decrease at year 30 to $96,500.
In the financial case
provided to us it was noted that in discussions with Trustpower when it was a
potential equity investor indicated on balance the costs to be appropriate, it
had noted that the SPV costs were light but that other cost items compensated.
A subsequent review by SMEC
broadly aligns to this view but in addition SMEC has noted that maintenance
cost assumptions are most likely high for the first 25 years as these costs are
more likely to be deferred into an overhaul type event after about 25 years.
From discussions with BNZ
Advisory we understand that no allowance for capital expenditure has been
included in the financial projections. Any requirement for expenditure to
maintain the operating capacity of the Scheme’s assets is considered to
have been built into the operating budget.
We note that total
operations and maintenance costs comprise around 40% of operational expenses
and are close to 1% of the overall capital expenditure. We have tested a
sensitivity to a 25% increase in all operating costs. Given the relative
fixed/known nature of the Centralines costs and mitigation costs (which
comprise close to 45% of costs) this would provide nearly 50% buffer for all
other costs. Under this scenario the investor IRR decrease around 50 – 75
basis points and at no point does the cumulative cash flow to HBRIC turn
negative for the period to full uptake.
Table 13: RWSS Operational Expenses
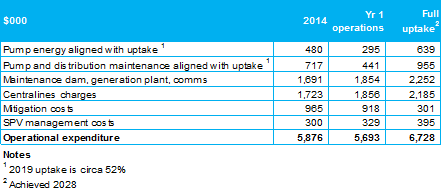
Asset life and
depreciation
We understand that the
current view is that the dams economic/planned life should be in excess of 100
years. The dam and remaining components of the Scheme are depreciated over a
range of various terms which results in a depreciation charge of $14.4 million
in FY19 which decreases on a diminishing value basis to around $8.1 million in
FY28 (full uptake). The following table sets out the depreciation rates used
for the various construction components.
Table 14: Depreciation Rates for Construction Components
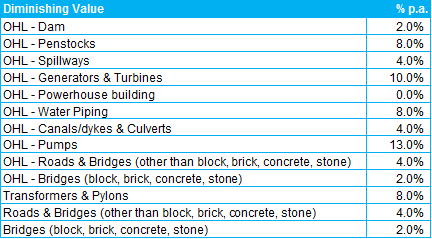
We note that in line with
the observations from SMEC it is possible that annual maintenance costs may be
lower for a period and then comprise a larger capital refurbishment. The result
would be that taxable income would be higher for a period and that the costs
would be of a capital nature and therefore the tax benefit would be realised
over time through the depreciation charge as opposed to an operating cost
deduction.
Tax losses
As HBRIC’s investment
is expected to be treated from a tax perspective as an interest in a
partnership, HBRIC will be allocated its proportionate share of the
partnership’s income and expenditure, which will be passed through under
the limited partnership structure. It is anticipated that the partnership will
be in a tax loss position until approximately 2023 (including for the
construction period), before turning into a taxpaying position. To the extent
that losses arise, these losses can be set off against the taxable profits of other
entities in the HBRIC group assuming 66% or greater common ownership.
We understand that HBRIC has
received tax advice from PricewaterhouseCoopers (“PWC”) which sets
out their view on how the tax losses/income should be distributed. During the
construction period assessable income/losses is assumed to be passed to HBRIC
in line with its contributed capital. During the operational phase assessable
income/losses are assume to be passed in line with cash distributions. The
result of this is that HBRIC receives a timing benefit during the early stages
of construction given it contributes capital first and in operations the
institutional investors and Farmer note receive a timing benefit up until the
conversion date given the nature of their respective fixed interest
instruments.
Senior Debt
As discussed, it has not yet
been determined whether there will be bank debt within the initial capital
structure. If there is debt at financial close the current view is that it is
not likely to be more than $50 million.
During the operating period
bank debt will likely be drawn down progressively as uptake increases. The base
case includes assumptions in this regards, based on a structure that
demonstrates covenant compliance on a historical and forecast basis, and repayment
prior to the end of the resource consent period with a 1-2 year tail before the
end of each consent period. We note that there are a number of bank covenants
which are used to size the debt including debt service and interest service
cover ratios.
We have not yet sighted a
draft term sheet indicating the availability of debt on the terms modelled but
note that BNZ Advisory has been in dialogue with commercial lenders regarding
the Scheme in particular around ensuring the project documentation and construction
contract are sufficient to cover the needs of the lenders.
Base Case financials under the two
capital scenarios
Overview
of Projected Operating Revenues and Costs
The following section sets
out a review of the operating cash flows from the Scheme and assesses
HBRIC’s returns under various sensitivities and scenarios. In undertaking
our analysis we have been focused on:
· Whether the HBRC can have comfort
that its exposure to calls on capital can be limited to its current funding
envelope of up to $80 million;
· The circumstances under which HBRC may be
required to contribute additional capital and where possible the quantity of
those potential calls and the risks that such calls could eventuate;
· The extent to which HBRC can have comfort
that the projected returns on its investment have been accurately calculated
and are based on reasonable assumptions; and
· How investment returns could vary under
different scenarios.
The preceding section has
already outlined the assumptions which have been used to generate the projected
returns so this section is primarily focused on addressing points 1, 2 and 4.
Summary
of business model
The proposition is to invest
approximately $276 million to construct, over a 3 year period, a dam which will
provide access to 104 M m3 per annum of water to be used for
irrigation with 95% reliability. The water will be sold under contract on a
take or pay basis for $0.26 m3 generating approximately $27 million
revenue (2014 dollars). In addition a 6.5 MW hydro station will generate
electricity, half of which will be used for the Schemes pumping requirements
and half sold for revenue. The Scheme has a steady state operating cost of
approximately $6 million which will generate operating profit in a steady state
of approximately $25 million in 2014 dollars. The following table shows a
breakdown of theoretical operating profit at full uptake and several other key
milestone dates. The table illustrates the very high operating profit margin at
over 80% once full uptake is achieved.
Table 15: Operating Profit (Base Case)
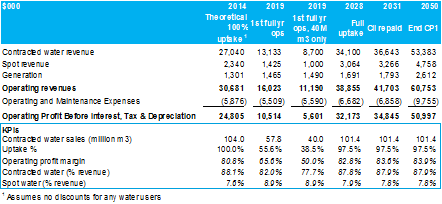
One of the Conditions
Precedents to financial close is to sign up take or pay Water User Agreements
representing 40M m3 of annual water use. Breakeven analysis
demonstrates that, from an operating cash flow perspective, the Condition
Precedent uptake volume is more than sufficient to ensure positive operating
profits from the commencement of operations, with sufficient buffer for further
adverse impacts (for example, lower than expected spot water sales or higher
than expected operating costs).
BNZ Advisory as part of the
financial case has undertaken further scenario analysis based on the inclusion
of 15% bank debt gearing (interest only) which results in circa $35 million
debt at financial close and a further $10 million capitalised interest and fees
by the end of construction. Under this scenario bank debt interest in year 1
would be around $3.4 million which would leave circa $1.9 million headroom and
therefore not require a capital call for senior debt servicing. The head room
in that year would almost be sufficient for payment of the farmer note coupon
(circa $2 million) however would not cover any further servicing for CIIL or
the institutional fixed interest portion.
The following charts
summarise the projected operating revenues and profits under the Base Case and
some of the key assumptions underpinning these for the first 25 years of the
forecast period.
Projected revenues and
operating profits under the Base Case are summarised in the following chart.
Under this scenario, operating revenues increase proportionately with projected
water demand, which is discussed in more detail below. The Scheme’s main
source of revenue is water sold under the take-or-pay Water Use Agreements for
$0.26 per m3. However, spot water sales and generation revenue also
contribute between 10% and 15% of the operating revenue, even once the demand
has begun to stabilise at its long-run level.
The main drivers of the
losses in the early stages of the Scheme are the large depreciation charges and
the relatively large financing costs incurred on the bank debt (if any) and the
CIIL interest portion. In fact it is not until the financial year ended 31
March 2024 that the Scheme first makes its first operating profit ($2.4
million) when water demand is approximately 72%. The main operating expenses
relate to maintenance and Centralines charges. While depreciation has an impact
on operating profit before tax, the Scheme is forecast to earn positive cash
flows immediately.
Figure 15: Projected Revenue and Operating
Profit
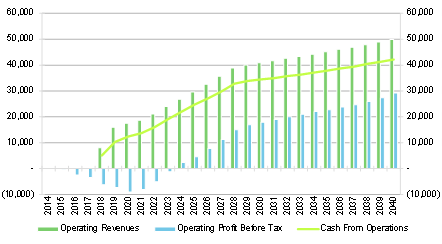
Cash Cascade
The following section
discusses how cash flows from operations are distributed under the proposed
capital structure. It is important to note that the current capital structure
remains in a state of flux and as a result the final negotiated outcome may
differ to that described below. Despite this there are a number of key features
between the proposed structures which are the same:
· Senior debt interest and principal has
first ranking priority and is paid ahead of all other distributions. Failure to
do so is likely to result in a breach of banking covenants and would require
immediate remedy by the ordinary shareholders or face default;
· Before the conversion date, the 5% fixed
interest portion on the Farmer Note is currently assumed to rank ahead of CIIL;
· The CIIL sub-debt assumes a small cash
interest cost to meet CIIL’s operating costs, with the balance likely to
be capitalised ;
· Importantly the phased CIIL repayments
will likely need either bank debt, contributed capital, or both. It will be for
a General Partner decision at that time whether this is met by retained
earnings, a capital call amongst all investors, a capital call amongst
investors of a certain class, bank debt, or a mixture thereof. Scenario
modelling demonstrates that the full amount could be available from bank debt
whilst still staying within reasonable gearing levels;
· Before the conversion date institutional
investors will receive a proportion of their return from a fixed investor feet
payment. It is expected this investor fee will be paid however it will have the
ability to capitalise without triggering any default or capital call;
· Prior to conversion all remaining cash
flows are distributed between HBRIC and the institutional investors;
· After conversion the Farmer Note (Tuki
Tuki Investments), HBRIC and institutional investors will receive distributions
on a pro-rata basis after servicing interest and principal payments on bank
debt.
HBRIC
Distributions and Investment Return
HBRIC as an equity investor
receives its return from the Scheme based on a proportion of equity
distributions.
The calculation of
HBRIC’s return on its investment is comprised of three key cash flows:
1. Distributions
HBRIC receives a proportion
of free cash flow after payment of all required distributions which rank prior
(other than cash which the RWSS GP may elect to retain). In the period up to
the conversion date (pre-trigger), assumed to be June 2028, distributions are
made on a fixed percentage. After the conversion date they are based on the
pro-rata proportion of investment.
Should the negotiated
position starts to move materially away from the shareholding percentages and
terms currently assumed then the sensitivity and scenario analysis undertaken
below should be redone so as to ensure that HBRIC is not providing any
additional protection for the other investors in downside scenarios.
2. Tax losses
HBRIC has received tax
advice from PWC which sets out their view on how the tax losses/income should
be distributed. During the construction period assessable income/losses is
assumed to be passed to HBRIC in line with its contributed capital. During the
operational phase assessable income/losses are assume to be passed in line with
cash distributions.
3. Capital contribution
toward repayments of CIIL
The Base Case model assumes
that 25% of CIIL repayments are met from ordinary shareholders (being HBRIC and
institutional investors) which is simply assuming funds are paid out and then
recycled back to repay CIIL. In effect the same outcome could be achieved by
setting retained earnings at a level such that it covered the CIIL repayments
and distribute the remaining proportion.
We note under a range of
unfavourable sensitivities that these payments will continue to be required to
CIIL. While the Model shows the payments coming from the respective parties
(which results in negative cash flows to HBRIC), in practice it will be for the
Scheme to determine at the time whether it wants to manage CIIL repayments via
retained earnings, bank debt or capital calls. If it is the latter HBRIC could
chose not to participate and instead have its shareholding diluted.
Investment
Returns
The following section sets
out the calculation of HBRIC’s investment returns. We understand that
HBRIC’s investment has been structured such that it will earn lower
project returns during the uptake period, compared with institutional
investors, to reflect the material positive externalities including economic
and environmental benefits to the Hawkes Bay region. Once full uptake is
achieved HBRIC’s returns will revert to a commercial arrangement and earn
project returns on a basis consistent with all other investors and targeting
approximately 10% return which is HBRIC and BNZ Advisory’s target for a
commercial brownfield[11]
infrastructure investment.
The IRR, or internal rate of
return is not a coupon rate. In its simplest form the IRR is the discount rate
which makes the net present value of a series of cash flows equal to zero. The
IRR calculation can generate the same return for a series of small regular cash
flows or a single large bullet return at the end of the analysis period.
It is therefore important to
note that these investment returns are over the life of the respective analysis
period and comprise a series of cash inflows and outflows which are not
uniform.
The calculation for pre and
post measurement date includes a calculation of the inferred market value of
HBRIC’s shareholding at the conversion date. This is calculated by
discounting the cash flows post measurement date at a discount rate of 10%.
This rate is set as the discount rate from the perspective of an incoming
brownfield infrastructure investors based on benchmarking BNZ Advisory has
undertaken. Given the uncertainty in estimating market discount rates
approximately 15 years into the future we would expect the rate to fall within
a range of 8% to 12%, so a mid-point of close to 10% seems reasonable. We do
note that the pre-measurement date IRR will be sensitive to assumptions
regarding the discount rate used to calculate the market value, although this
has no impact on cash that would be received by HBRIC (unless it elected to
sell at a point when the market was unfavourable). A higher discount rate
assumption would result in a lower return being calculated with the opposite
effect for a lower discount rate assumption.
The post measurement date
return of 10% is the same target under all capital structure scenarios. The
post measurement date return assumes that an investor would need to pay the
market value of HBRIC’s investment in order to receive the benefit of the
future cash flows.
The following three charts set out
the cash flows used to establish the returns. We note the large distribution in
2050 is the result of the re-gearing of the Scheme following the start of the
second consent period.
We note the repayment and subsequent
investment in 2016 and 2017 of circa $8m relates to an assumption within the
financial model which provides a repayment to HBRIC following the 3rd
tranche of the farmer note which is required to be drawn down again the
following quarter. In practice the required drawdowns for HBRIC in the quarters
following would be reduced rather than a repayment. The impact on the
investment returns are immaterial (i.e.1bps).
Figure 16: HBRIC Cash Flow - Whole Concession
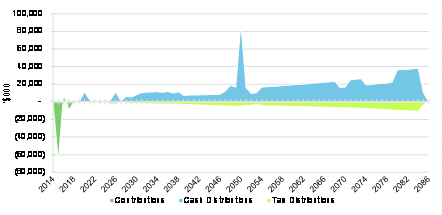
Figure 17: HBRIC Cash Flow - Pre Trigger Date
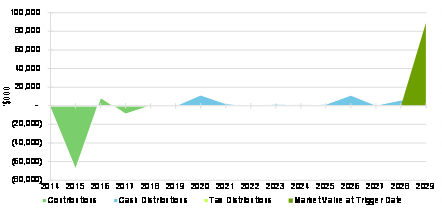
Figure 18: HBRIC Cash Flow - Post Trigger Date
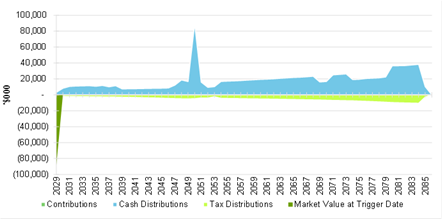
Risks and
Mitigants
HBRIC and BNZ Advisory have
provided us with a comprehensive list of the risks faced by the Scheme and we
requested a series of scenarios and sensitivity analysis which sets out the
impact on investor returns (in IRR terms) to HBRIC’s return. In addition
consideration has been given to scenarios which may result in additional
capital calls for HBRIC.
In broad terms however the
risks are allocated as follows:
· Design and construction risks are borne by
the D&C contractor. These include cost over runs and timing delays (where
there is no scope change initiated by the Scheme); The financial impact to
investors is largely expected to be covered by liquidated damages
(“LDs”) however we note that there will be a cap on the LDs level,
as is standard construction contract practice.
· Demand and uptake risk is borne by HBRIC
and the portion of Institutional Investor returns other than the investor fee
firstly. CIIL provides a timing buffer through the proposed repayment mechanism
which depresses the repayment while uptake remains low thereby making a higher
proportion of cash flows available to HBRIC and institutional investors than
would otherwise be the case. If uptake was very slow then it would also be
likely to impact institutional investors investor fee and then part of CIIL
interest would likely capitalise.
· Operating costs and performance is largely
met by all parties in the post trigger date period, however in the ramp up
period HBRIC is bearing a larger proportion of the risk given the majority of
its return ranks behind other cash distributions including the institutional
investor fee payment.
· Regulatory risk is borne by all investors
equally, assuming that the trigger date is reached prior to the end of the
first consent period.
Scenarios/Sensitivity Analysis
The following section sets
out an overview of the scenarios and sensitivities which BNZ Advisory has run
as part of the financial case.
Demand
Scenarios
HBRIC and BNZ
Advisory have undertaken sensitivity analysis in relation to demand ramp up:
· Under the “Moderate High
Case” (see Figure 22), which assumes full uptake is reached 2 years
earlier, under the capital structure scenarios run, HBRIC’s project IRR
increased moderately: by approximately 20 basis points;
· Under the “Extreme Low Case”
(see below), which assumes full uptake is not reached until 2040, HBRIC’s
project IRR reduces by less than 1% under the capital structure assumptions;
In addition to
the upside and downside demand scenarios provided to us we have added a further
scenario which provides a very aggressive downside which assumes that demand
never reaches full uptake and caps out at 75%. This scenario has been provided
in response to questions from HBRC and in our view given the long run value of
water is unlikely to transpire. Under this case, HBRIC’s project IRR fell
by approximately 150 basis points, although HBRIC would recover its capital
after 29 years and earn a positive return over the life of the Concession
Period.
Figure 19: Projected Demand Uptake
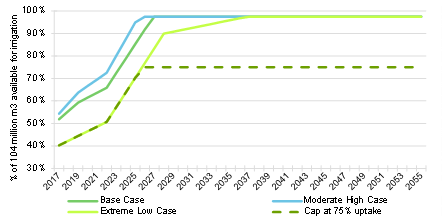
Sensitivity
Analysis
The table opposite
highlights the impact of a number of key sensitivities on HBRIC’s
investment returns under the current base case. Appendix 6 has further detail
and commentary on each sensitivity. At a high level we note there is
significantly more sensitivity for the returns to the trigger date (14 years)
as opposed to over the full concession period (70 years). This is primarily
because the returns to trigger date are comprised of generally low cash returns
and are largely the result of several one off events such as the gearing up of
the Scheme in 2018 and release cash from reserve accounts.
Table 16: Investment Returns
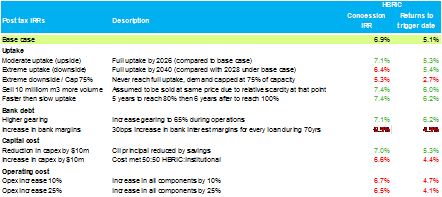
We note that for all
scenarios the behaviour of returns for investors depends materially on the
agreed repayment profile and backstop date with CIIL and the Farmer Notes. For
the purposes of the analysis presented for the extreme downside where demand
never exceeds 75% of capacity BNZ Advisory has assumed the Farmer Note converts
in 2040 (the same as the full uptake under downside case) regardless of uptake
never getting to 100%. Under this same scenario HBRIC’s initial
investment is recovered after 29 years.
In addition to the scenarios
above we asked BNZ Advisory to consider a scenario which had 100% uptake at day
1 of operations. Under this scenario a reasonable commercial capital structure
is considered to be:
· 75% bank debt gearing via project finance
(with this higher level of gearing able to be obtained on the back of
pre-contracted full uptake); and
· The balance funded by institutional
investors solely (that is, no public funding).
This scenario results in
institutional investor IRR which would be in a reasonable range for
institutional investors investing in an infrastructure project with no uptake
risk. This demonstrates that public sector participants are effectively being
required to cover for the uptake gap in an otherwise commercial project.
Regulatory Risk
Resource Consent with
acceptable terms is a Condition Precedent to financial close as a result for
the first consent period it is not a risk which should impact investors.
Assuming the Condition Precedent is met, the Scheme will have residual resource
consent risk in the renewal of the resource consent at the end of the first 35
year consent period. BNZ Advisory believe that, based on past experience of
renewals of similar resource consents, that the risk of non-renewal is very
remote. They consider the more likely risk being the possibility of additional
or more onerous consent conditions applicable for the second half of the
Concession Period. This aligns to our experience where we observe for a number
of the electricity generation assets in New Zealand consent renewals are
usually renewed but generally with higher environmental standards and
significantly higher compliance monitoring levels.
While the Scheme has a
reasonably small contribution (in the context of operating cash flows) to
mitigation measures, the measures align to the proposals made to the Board of
Inquiry. In assessing ways to mitigate re-consenting risk BNZ Advisory have
increased the operational expenditure on mitigation costs The following
graph demonstrates the post-tax cash distribution impact on HBRIC Ltd of
increasing the resource consent mitigation costs from $96,500 per annum over
the long term to $1,500,000 per annum from year 35 (plus inflation). On the
Base Case scenario with capital structure A the movement in HBRIC’s post
tax IRR over the 70 year concession is a negative movement of around 10 basis
points.
Equity raising for the retirement of
CIIL
CIIL repayments will likely be phased
and aligned with uptake. However the RWSS GP will need to determine whether it
meets this cash requirement from retained earnings, bank debt, or as part of
its capital structure scenario modelling, BNZ Advisory has tested the impact of
CIIL’s repayment, and the concept of there being further rights issues to
assist in meeting CIIL repayments. For example, a number of scenarios have been
run whereby one quarter of CIIL repayments are met by investor rights issues,
with HBRIC and Institutional Investors electing to subscribe for half (i.e.
12.5%) (We note however that there is no contractual obligation to commit more
capital). The repayment is assumed to be incremental and in line with uptake
and for HBRIC it is never more than approximately $2.5 million per annum. We
note that the 25% contribution is a modelling assumption only and not a
contractual obligation. It will be for the Scheme to determine at the time
whether it wants to manage CIIL subordinated debt repayments via retained
earnings, bank debt, or capital calls.
The following graph prepared by BNZ
Advisory summarises cumulative net distributions (excluding the original
contribution) for HBRIC Ltd for the first 20 year period assuming the following
scenarios:
1. As per Base Case financial model
(capital structure A): HBRIC and Institutional Investors each contribute 12.5%;
2. CIIL repayments met from retained
earnings and existing bank debt (no equity calls, and bank debt assumptions as
per Base Case);
3. CIIL repayments met from retained
earnings and an increase in bank debt gearing assumptions, no equity calls;
4. No bank debt drawn during the
operating period at all, and no capital calls capital calls to meet CIIL
repayments increased to 20% each for HBRIC Ltd and Institutional Investors to
enable CIIL repayments without excessive retention of earnings;
5. Scenario 4 above, assuming the
downside uptake scenario; and
6. Scenario 3 above (no equity
calls, bank debt increased), assuming extreme downside uptake.
The scenarios and analysis demonstrate
the following:
· Even if rights issues equal to 12.5% of
CIIL repayments for HBRIC are decided upon by the Scheme; under Base Case
assumptions, these capital calls will not exceed cumulative distributions
received to that point.
· From a cash flow perspective, no equity
calls are required under Base Case uptake and bank debt assumptions.
· Under Base Case assumptions, an increase
in bank debt - in our view this is unlikely until full uptake is reached - in
lieu of no further rights issues would result in favourable IRR and cash flow
returns for Institutional Investors and HBRIC.
· If strictly no bank debt is available
during the operating period, approximately 40% of CIIL repayments may need to
be met from rights issues (or by retained earnings). Under this scenario, if
HBRIC subscribes for half of this rights issue, its net cumulative exposure
could increase to approximately $12 million at its peak (before
subsequently reducing). Alternatively, HBRIC could elect not to participate in
the rights issues and be diluted.
· Under an extreme downside uptake scenario,
again with no bank debt, the results for HBRIC (from a net cash investment
perspective) are slightly less severe due to the deferral of CIIL repayments
under a downside scenario.
· Even under an extreme downside uptake
scenario, if approximately 60% gearing was available to the Scheme (which we
note as unlikely); no capital calls are actually required from a cash flow
perspective.
Figure 20: Cumulative Post Tax Distributions to HBRIC
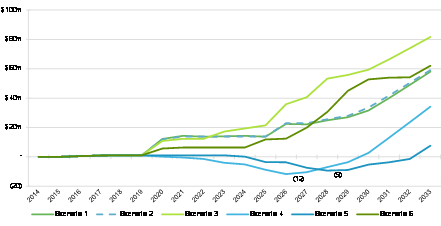
Discussion
The financial analysis prepared by BNZ
Advisory produces financial projections that reflect the interplay between
assumptions as to the initial capital cost of the scheme, earnings and cash
flows from operations and the assumed capital structure.
The analysis set out above is focussed
on demonstrating how assumptions made in relation to these factors come
together to produce a base case set of earnings and investment returns and how
these vary under an alternative capital structure and as key assumptions are
changed.
Conclusion
The base case financial
projections show HBRIC achieving a sub commercial internal rate of return
(“IRR”) on its investment up to the point of full uptake which the
Base Case assumes is June 2028 (the “Trigger Date”) with an IRR of
approximately 10% beyond that point. We are satisfied that the IRRs have been
correctly calculated but note that a number of factors influence these
calculations and in particular assumptions as to:
· Uptake
· The quantum and timing of the introduction
of debt
· Interest rate assumptions
· The assessed value of HBRIC’s
investment at full uptake
· Refinancing
The Base Case IRRs are
sensitive to changes in key assumptions such as the rate of uptake and
increases in capital expenditure. We note however that the proposed structure
of the CIIL capital significantly mitigates the risk to HBRIC of a lower than
projected uptake in the period up to the Trigger Date.
At full uptake the RWSS will
generate sufficient operating cash flows to provide market returns to all
capital providers. Further, at this point a range of options will be available
to HBRIC as to how it structures its investment. In particular infrastructure
assets such as the RWSS once fully committed are typically capable of
supporting a significant amount of bank debt thereby creating the opportunity
to return capital to the original investors. The Base Case assumes a
refinancing event on the second year of operations which releases funds
available to distribute. Following this there is a gradual gearing up of
the Scheme to a relatively lowly geared level relative to the market value of
the Scheme.
9. Other Benefits
Introduction
As discussed previously the
RWSS as currently proposed cannot be justified as an investment by HBRIC on
purely commercial terms. A significant motivation for the RWSS is the
environmental and wider economic benefits anticipated from the Scheme. These
considerations have been extensively canvassed in other reports and were
subject to scrutiny through the BOI process. It is not the purpose of our
review to undertake further investigation into these matters. However,
for completeness we summarise below the key additional benefits anticipated
from the RWSS and which are critical to the HBRC’s consideration of the
investment proposal. Fundamentally HBRC is being asked to accept a less than
commercial rate of return on its investment in order to achieve these wider
benefits.
Environmental Benefits
The HBRIC
prepared business case for the RWSS summarises the role that the RWSS is
intended to play in improving the integrated management of the Tukituki
catchment. The business case notes that the current environmental issues associated
with the Tukituki Catchment occur during the summer months when river flows are
lowest. Generally there is a nutrient imbalance in the system with excessive
phosphorus generating slime and algae growth. In addition, current water
allocation exceeds Regional Plan limits contributing to frequent very low flows
during summer. This, combined with the braided nature of the river bed, leads
to the warming of river water, accelerating slime and algae growth.
The water stored
by the RWSS and designated for environmental purposes will enable minimum flows
to be increased through the summer months. These increased flows combined with
the setting of appropriate nutrient levels will improve environmental and
cultural outcomes. The Tukituki Plan Change 6 (a land and water management
plan) was developed to achieve these benefits, and has been subject to a
decision through the BOI process.
In the absence of
the RWSS improvement in flows would require water user allocation limits would
need to be adjusted resulting in existing irrigators having significantly
reduced security of supply, with resulting economic impact. Furthermore, given
water allocation and quality issues, there is little or no prospect of
substantial additional irrigation development in the Tukituki Catchment through
groundwater abstraction or surface water takes.
Working in tandem
with Plan Change 6, RWSS is expected to allow the HBRC to improve water quality
and minimum flows, while off-setting the economic impacts of Plan Change 6.
The Butcher
Report
In addition to
the environmental benefits anticipated from the RWSS the Scheme is also
expected to unlock the significant agriculture potential of the Tukituki
Catchment through providing high reliability water for irrigation, allowing
further economic development. This is considered to be particularly important
for the future of the Hawke’s Bay economy where the temperate climate and
high sunshine hours offer a key competitive advantage for the Region through
primary production and processing of food for export. While the Region
contributes 3.4% of national gross domestic product (“GDP”),
primary production and processing is more than double this at over 7%.
Additionally, RWSS will, to the extent of its area of influence, assist in
buffering the regional economy from the predicted impacts of climate change,
with forecasts suggesting a drying trend with more droughts.
Butcher was
engaged by HBRIC to undertake an assessment of the RWSS as well as a Cost
Benefit Analysis (“CBA”) from a commercial perspective. In
undertaking this analysis Butcher referenced the report entitled Ruataniwha
Water Storage Scheme: Project Description, Tonkin & Taylor (May 2013) and
the work undertaken by Macfarlane previously referred to in this report.
Butcher breaks
its analysis of regional economic impacts into two categories being the one-off
construction impacts associated with the construction of the physical
infrastructure of the RWSS and the on-going impacts arising from increased farm
production.
The one off
construction impacts estimated by Butcher are summarised in the table opposite
(one-off effects spread over 12 years):
Table 17: One Off Construction Impacts Estimated by Butcher
|
|
Output
($m)
|
Jobs
(job-years)
|
Value Added
($m)
|
Household
Income
($m)
|
|
Direct impacts
|
690
|
N/A
|
N/A
|
N/A
|
|
Total impacts
|
1,200
|
4,700
|
410
|
270
|
The on-going impacts arising from
increased farm production estimated by Butcher are summarised in the table
below:
Table 18: On-going Impacts From Increased Farm Production
Estimated by Butcher
|
|
Output
($m per
annum)
|
Jobs
(FTEs)
|
Value Added
($m per
annum)
|
Household
Income
($m
per annum)
|
|
Farming and farm support
|
325
|
1,310
|
135
|
59
|
|
Processing and processing support
(high uncertainty)
|
380
|
1,210
|
120
|
67
|
|
Potential total impacts per year
(rounded)
|
705
|
2,520
|
255
|
126
|
|
Potential NPV of impacts
8% over 35 years
5% over 70 years
|
2,500
4,900
|
19,000
37,000
|
1,850
3,700
|
970
1,900
|
We note that
the on-going impacts are broken into a further two categories being farming and
farm support and processing and processing support. Both categories are
dependent on assumptions made as to land use change which have been sourced
from Macfarlane. Given the draft determination of the BOI it is likely that
some of the land use assumptions made by Macfarlane may need to be revisited.
This in turn may require the Butcher analysis to similarly be updated.
We also note that
Butcher considers the process and processing support benefits to be
“highly uncertain”. This does not mean that such benefits are
unlikely but rather that predicting the form and quantum of such benefits is
more challenging than is the case for farm and farm support benefits. We also
note that while the farm and farm support benefits are spread relatively evenly
between pastoral and arable farming, orchards and vineyards and farm support
the processing and processing support benefits are heavily weighted towards
vegetables and wine.
Since issuing its
report Butcher has revisited their calculations and has revised downward their
estimate of the one-off construction benefits to $330 million and their
estimate of ongoing benefits to $3,300 million. They have also revised their
estimate of jobs created under the ongoing benefits analysis from 2,500 FTEs to
32,500 job years.
Nimmo-Bell &
Company Limited (“Nimmo-Bell”) was engaged by HBRIC to review the
original and updated Butcher report. This evaluation specifically assessed the
report’s methodology and findings on:
· Cost-benefit analysis for
Scheme investors and farmers;
· Economic impact assessment
nationally, regionally and sub-regionally/local authority district level; and
· While Nimmo-Bell note some
differences between their analysis and that of Butcher they note that
“overall, it is considered that these differences are not of such a
magnitude as to negate the overall conclusion of Butcher that the RWSS will
have a very positive net economic impact for the Hawkes Bay economy.”
Impact on Existing Irrigators
HBRIC commissioned two
reports on the implications of minimum flow proposals contained in Tukituki
Plan Change 6 in the event that the RWSS did not proceed. Harris Consulting
prepared a report “Tukituki River catchment: Economic Impact of Minimum
Flow Proposals on Existing Irrigators (February 2013) and Horticulture NZ
prepared a report “Economic Impact of Proposed Minimum Flows on
Horticulture Irrigators on the Tukituki river (March 2013).
Under the HBRC’ s
proposed regime, minimum flow levels would be higher than their present levels
at Red Bridge and Taipairu Road on the Tukituki River and at State Highway 2 on
the Waipawa River.
The proposed minimum flow levels are
likely to increase the frequency, severity and duration of restrictions on
water use. Currently, if restrictions come into force, they can be extreme and
often occur at key points in the production cycle, impacting both the quantity
and quality of the resulting output.
Based on the Harris Consulting and
Horticulture NZ analysis HBRIC have estimated the RWSS’s ability to
reduce the negative economic impacts of Plan Change 6 associated with the
increased minimum flow requirement to have a NPV of between $16 million to $41
million.
Discussion
The environmental and wider economic
benefits from the RWSS are the reasons why HBRC is prepared to accept a less
than commercial return on its investment in the Scheme. These benefits have
been subject to extensive scrutiny and analysis by independent advisors. The
projected benefits were also scrutinised through the BOI process.
The projection of
economic benefits from major infrastructure projects can never be an exact
science. They necessarily require assumptions to be made in relation to factors
many years into the future the majority of which are beyond the control of the
HBRC. Actual outcomes will vary from those currently assumed and may be either
more or less favourable.
Fundamentally
expected benefits are underpinned by the assumption that primary sector will
remain a major part of the Hawkes Bay economy over the long term and that the
performance of this sector will be such that viability is maintained. This is
likely to require continued productivity improvements and the maintenance of
commodity prices in real terms at a minimum.
Conclusion
The importance of
the environmental and economic benefits in the context of the RWSS business
case has necessitated extensive analysis of both. However, no amount of
analysis can eliminate the risk associated with the prediction of economic
benefits far into the future.
Based on the
information available today the economic benefits from the RWSS would appear to
be very considerable. Ultimately realisation of these benefits will depend on
the continued strong performance of the New Zealand primary sector which in
turn will depend on the ability to continue to achieve productivity
improvements and to maintain a good level of commodity prices.
|
Peer
Review of the Ruataniwha Water Storage Scheme Business Case
|
Attachment 1
|
10. Other
Matters
Governance Model
The governance model for the
RWSS LP has yet to be finalised. This will
ultimately be settled on through the as part of the process for finalising
investor term sheets and the RWSS LP agreement (the “RWLP
agreement”).
We consider that a Board
size of 5 to 6 members is an appropriate size for an entity of the size and
nature of the RWSS LP. What is more important from the perspective of effective
governance is to ensure that the Board has the right balance of capability and
that the objectives of all shareholders are aligned and accurately reflected in
the terms of the RWLP agreement.
It is important that the
composition of the Board is revisited periodically. For example the
governance skills required through the construction phase are likely to be
different from those once the RWSS becomes operational.
Management Model
The management of the RWSS can
be broken into two phases being management through the construction period and
then management of the Scheme when it is operational post construction.
A delivery structure has
been established for delivery of the RWSS through the construction phase. The
business case notes the intention to establish a project team to oversee the
delivery of the construction phase. A Project Execution Plan
(“PEP”) has been prepared to guide the development, execution and
control of the construction process. Primarily this will involve coordinating
and monitoring the activities of the key parties to the process being the
OHL/Hawkins JV, the owners engineer, the environmental management team, the
HBRC (as regulator of water allocation) and the Ruataniwha Water GP (as operator
of the Scheme).
The project team will be led
by a Project Director supported by an administrative team providing legal,
financial and general administrative support. A Commercial Manager will be
appointed to drive water uptake through the construction phase. The project
team will receive additional support from an Expert Panel who will provide
technical oversight throughout the construction process.
We understand that the
members of the project team have yet to be appointed, given that the RWSS is
not yet at financial close. Given the complexity of the engineering and
legal dimensions of projects of this nature having the right capability in the
core project team with access to relevant technical advice is critical. The
decision by Trustpower to withdraw from the RWSS increased the dependence on
third party advisors.
As noted above considerable
attention has been paid to limiting investors’ risk through various
contractual processes. However, effective risk management requires a high level
of appropriate capability to be dedicated to the management of the initial
construction project and then the ongoing business on a day to day basis.
Therefore, recruiting appropriately skilled and experienced personnel into key
positions is vital.
|
Peer
Review of the Ruataniwha Water Storage Scheme Business Case
|
Attachment 1
|
Planning
The business case sets out
the planning that has been undertaken in relation to how the Scheme will be
managed through the construction phase and post completion. However, as noted
above the wider economic benefits anticipated for the Hawkes Bay region are a
critical driver of the investment in the RWSS. Fully capturing the benefits
from the RWSS and minimising the downside from the Scheme will require careful,
coordinated planning between local and central government agencies and at a
local community level.
The increase in employment
in the region will have implications for local amenities and infrastructure and
the make-up of communities. The benefits from the RWSS are not a free good. The
more the economic and social changes consequent upon the investment in the RWSS
are anticipated and planned for the greater the likelihood that the full
benefits from the Scheme will be realised.
|
Peer
Review of the Ruataniwha Water Storage Scheme Business Case
|
Attachment 1
|
Appendix 1 –
Terms of Reference
HAWKES BAY REGIONAL
COUNCIL
PROPOSED
RUATANIWHA WATER STORAGE SCHEME
BUSINESS CASE PEER
REVIEW
TERMS OF REFERENCE
INTRODUCTION
The Hawke’s Bay Regional Council is
considering investing up to $80million, (through its wholly owned subsidiary
Hawke’s Bay Regional Investment Company Limited (HBRIC)), to acquire a
substantial but minority shareholding in a company to be formed to implement
the Ruataniwha Plains Water Storage Scheme (RWSS). The new company will build
and own a reservoir and dam in the Tukituki Catchment in Central Hawke’s
Bay to be used to collect and store water and distribute it from the reservoir
to farmers and other stakeholders on the Ruataniwha Plains on commercial terms.
HBRIC has completed its own evaluation of
this investment, recommending it to the Council and asking the Council to fund
up to the $80million required.
The size and nature of the proposed
investment is likely to have a substantial impact on the structure and
performance of the Council’s investment portfolio and potentially on its
operating surplus over a considerable period. On the other hand the scheme is
expected to help economic development of the region and add to its regional GDP
over time.
As part of its ongoing public engagement
the Council has committed to a Special Public Consultative Process (SPCP) the
adoption of a Statement of Proposal to underpin this. The Council has therefore
decided to conduct its own review of the strategic, financial and economic
elements of the proposed investment and their likely impacts on its broader
economic development, financial performance and environmental protection responsibilities,
as well as its risks to its ratepayers and other stakeholders.
As part of this process, the Council
requires an independent Peer review of the business case for the investment
developed by HBRIC. This document contains the Terms of Reference for the
required Peer Review.
BACKGROUND
The new company will be responsible for
designing, constructing and operating a dam and reservoir and distribution
system to collect and store water from the Tukituki Catchment in Central
Hawke’s Bay and supply it to farmers and other customers and stakeholders
on the Ruataniwha Plains. It will charge users for its services and is
intended to become commercially viable and generate financial returns to its
investors over time.
Design and construction of the infrastructure,
development of the business case for investment in the scheme and establishing
funding for it is the responsibility of and is managed by HBRIC. Council and
HBRIC are jointly seeking the appropriate consents required to enable the
scheme to be implemented.
HBRIC has already secured investor
interest, and both Ngai Tahu Holdings and Trustpower Limited have joined with
HBRIC to form an investor group in which all three parties are contributing
funds towards the costs of design and consenting processes.
In addition, Crown Irrigation Investments
Limited (CIIL), a state owned enterprise, has formally notified its interest in
investing in the scheme and is working with HBRIC and the investor group to
progress its interest to a final decision whether to invest. Indicatively CIIL
could invest up to $80million.
The proposed investment has been presented
in LTP2012-2022 and publicly consulted on in 2012 and included in the
Council’s Annual Plans for 2013/2013 and 2013/2014. However the Council
has committed to undertaking a SPCP on the proposed investment once its terms
have been finalised and all conditions satisfied. This is expected take place
following the completion of the Council’s evaluation, (including this
Peer Review of the Business Case), of HBRIC’s final proposal.
The Council assumes HBRIC will have
resolved all design and construction matters and the EPA Board of Inquiry
consent process will resolve the major environmental and social and cultural
matters. In its decision-making role the Council will therefore only be called
upon to consider strategic, financial and economic issues and any legislative
requirements in making its decision about investment in the RWSS.
TERMS OF REFERENCE - KEY ISSUES
The key issues for the Council in evaluating
HBRIC’s business case are:
· Financial
feasibility – is the Council’s investment supported by a sound
business case? What are the strengths and weaknesses of the business case?
· Returns on
investment – what financial returns can the Council expect from its
investment and over what time period are these expected to occur?
· Business Risks
– what risks does the company face and how will these be managed or
mitigated?
These issues are expected to be addressed
by the independent peer reviewer by reviewing the business case projections,
their underlying assumptions and its assessment of impacts of changes in a
range of market, management and financial variables, including:
· Market demand,
including projected farmer take up and on farm profitability;
· Pricing of services
and sensitivity of revenue to price changes;
· Financial
projections including revenues, margins, expenses, operating position and free
cash flow;
· Financial
position/balance sheet of the new company including the financing plan, debt/equity
structure and conditions (if any) required by shareholders that will/may affect
profitability and application of free cash flows;
· Risk
identification, evaluation, management and mitigation both in respect of the
initial capital investment and ongoing operations;
· Returns to
shareholders;
· Planned application
of free cash flows; and,
· Management model.
TERMS OF REFERENCE – DETAILED ISSUES
TO BE CONSIDERED
The Peer Review should be in the nature of
an “audit” of the HBRIC prepared business case, but should include
assessment of the critical business case factors, including all assumptions
underlying it, and key elements such as the market for water storage and
distribution services, projected demand by farmers and others, the resources
required to establish and operate the business and the company’s
projected operating and financial performance and financial position over time.
This will include review of the impacts and sensitivities (if any) of
assumptions and information available about:
Market Demand - Farmer/Irrigators
· Projected farmer
demand/take-up;
· Projected on-farm
investment, future farm production, farmer profitability and their
ability to pay water distribution charges;
· Projected demand
from other users and for other services (e.g. for supply of hydro power); and,
· Terms of sale of
water storage and distribution services to farmers (for 35 years or lesser
periods).
Operating model
· Operating structure
for delivering services to be sold;
· Operating and
marketing plans underlying the business case; and,
· Risk management
plans for managing conditions imposed on the business by regulators (consents),
shareholders, bankers and others.
Management Model
· Proposed management
structure; and,
· Proposed use of
external advisors/consultants.
Governance Model
· Size of Board;
· Board membership;
and,
· Chairperson.
Financial projections
· All revenues,
whether from distribution service charges or other sources, and operating
expenditures, including discussion of major issues of insurance, repairs &
maintenance and environmental controls;
· Gross margins and
gross profit and their sensitivity to service price changes;
· Operating surplus;
· Cost of funds;
· EBIT & EBITDA;
· Depreciation and
amortisation;
· Income tax position;
· Net profit after
tax;
· Capital
expenditure; and,
· Free cash flow.
Funding model
· How the invested
funds are to be used;
· Funding Structure
(equity & debt components);
· Provision of
working capital requirements for ongoing operations;
· Funding
compensation for acquisition of existing consent holders right to their
consents (if any);
· Sensitivity of
funding model to varying cash flows as a result of changes in farmer uptake and
water distribution price improving over time;
· Long term capital
management plans; and,
· Provision (if any)
for contingencies, especially during the construction stage.
Investment Returns
· Sustainability of
returns over the long term; and,
· Projected
distributions of net profits and proposed dividend policy.
Ownership Model
· What implications
there may be for the operation of the business from the structure of the
shareholding partnership in the new company – who the partners are (CIIL,
Ngai Tahu Holdings, Trustpower, other private investors), what their class of
investment and respective rights to dividends (e.g. ordinary shareholders or
preference shareholders), fees, dividends and other payments are and what
the relationships will be (such as shareholder agreement on pre-emptive
acquisition rights, and board membership)?
· What effect (if
any) will arise from pre-emptive acquisition rights in the new company planned
for customers and other stakeholders?
· Relative returns to
shareholders and rationale/justification for any differences as between
shareholders.
· Impact of shareholder’s
planned exit requirements/strategies.
Business Case Risks
Including risk identification and
evaluation, mitigation plans, and management and control plans arising from:
· market demand and
famer uptake;
· project completion;
· business operation;
· variations in
farmers ability to pay water distribution prices over time;
· regional
environmental issues, especially from possible adverse effects on the
Ruataniwha Plains;
· funding &
financial structures, costs and obligations;
· uncompleted contracts
or agreements, including farmer’s contractual obligations to make
payments over the 35 years of water distribution contracts; and,
· external
environment (economy, legislative etc).
Non-business financial issues
· Significance of
recreational functions (if any) from using the reservoir; and
· Costs to be
incurred by the new company (if any) for establishing and maintaining
recreational facilities and access to them.
Peer Review Findings & Recommendations
· Overall summary of
business case Peer Review findings on the proposed investment in the new
company in financial, economic and operational terms compared with investment
in alternatives.
· Recommendations (if
any) of steps Council could/should take to meet concerns raised from the
findings of the Peer Review.
DELIVERABLES
A comprehensive report of the scope, work
and findings of the Peer Review together with any recommendations for Council
action as a result of the findings is required.
If necessary, the Peer Reviewer may be
called on to make a presentation of its findings and discuss them with Council.
DUE
DATE
Assuming HBRIC’s final proposal is
received by the Council in February 2014, the peer review of the business case
should be completed and a draft report delivered to the Council no later than
3-4 weeks after receipt of a full business case.
Background material and a briefing will be
provided to the Peer Reviewer in early February 2014 so that the Peer Reviewer
will be as well informed as possible and can move to full review of the business
case immediately upon its receipt from HBRIC.
23 December 2013
Hawke’s Bay
Regional Council – Peer Review of Business Case: Terms of Reference
© Copyright
Hawke’s Bay Regional Council, December 2013
Appendix 2 –
Documents Reviewed
In forming this opinion, we have reviewed and relied upon the
following principal sources of information:
· 120919 Financial Feasibility Final for
Public Distribution.pdf;
· Various scenarios and analysis undertaken
by BNZ Advisory to support the business case;
· 14819412_RWS Scheme Water User Agreement
21.3 Clean.doc;
· 15155180_ Draft RWS Scheme Concession
Deed.doc;
· 15382339_Draft RWS Scheme Project
Agreement .doc;
· 15580670_Trustpower MoU (fully executed)
18 Sept 2013.pdf;
· 15581138_Ngai Tahu MoU (fully executed) 18
Sept 2013.pdf;
· 16214015_Ruataniwha NZS3910_2003 contract
(with design) - updated 20 Mar 2014.doc;
· 20140320 RWSS Business Case to
Council.pdf;
· Additional budget detail to Consortia
Submissions - March 2014.xls;
· Anderson Case Study 231013.pdf;
· Butcher Modified Ruataniwha Tables - Feb
17 2014.doc;
· Castalia Nov 13 RWS Demand Model
Integration 2.pdf;
· Castalia Sep 12 RWS Demand
Report.pdf;
· CI note 27 January.docx;
· Dam reservoir landowner budget costs
provisions - RMac Review Input.xls;
· Feasibility Report to
Council_FINAL_sept2012_web.pdf;
· Harris S 2013 - Economic Impact of Minimum
flow proposals and seasonal allocation.pdf;
· Horticulture NZ_and_others_Evidence_Stuart
Ford - Appendix - Economic Impact on Irrigators.pdf;
· PIM Final March 14.pdf;
· Revised Project Assessment.doc;
· Ruataniwha WSP Review of Farm
Profitability 5 Sept 2012.pdf;
· RWSDemandReport.pdf;
· RWSS A7 (Regional Economic Impact
Assessment) - Butcher (May 2013).pdf;
· RWSS_RFP document_Project Overview_02May13_for
issue.pdf;
· RWSS_RFP document_Supporting
Information_02May13 for issue.pdf; and
· Other publicly available info.
We have also held
discussions with a number of parties and been provided with a modelling outputs
and explanatory information from BNZ Advisory.
|
Peer
Review of the Ruataniwha Water Storage Scheme Business Case
|
Attachment 1
|
Appendix 3 –
RWSS Overview Map
Figure 21: RWSS Overview Map
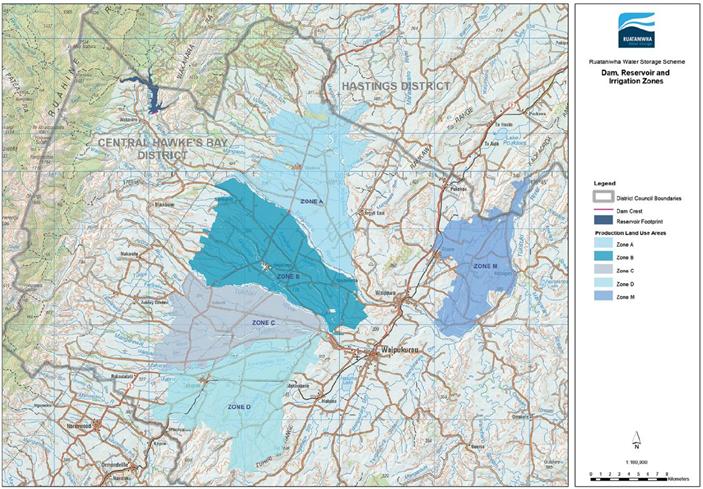
|
Peer
Review of the Ruataniwha Water Storage Scheme Business Case
|
Attachment 1
|
·
Appendix 4 – Construction Risk Register
Table 19:
Construction Risk Register
|
Peer
Review of the Ruataniwha Water Storage Scheme Business Case
|
Attachment 1
|
·
Appendix 5 – MacFarlane Product Price Assumptions
Table 20:
MacFarlane Product Price Assumptions
|
Product
|
Price
|
|
Milk solids
|
$6.50/kg
|
|
Weaner bull
|
$3.90/kg
|
|
Manufacturing beef
|
$4.25/kg
|
|
Store bull beef
|
$1.90/kg
|
|
Store lamb
|
$2.70/kg
|
|
Lamb
|
$6.00/kg
|
|
Wool
|
$4.00/kg
|
|
Feed wheat
|
$470/t
|
|
Feed barley
|
$440/t
|
|
Italian ryegrass seed
|
$1,700/t
|
|
Maize grain
|
$450/t
|
|
Vining peas
|
$400/t
|
|
Squash
|
$700/t
|
|
Russet potatoes
|
$220/t
|
|
Baby beans
|
$430/t
|
|
Grapes
|
$1,744/t
|
|
Apples
|
$26/ctn
|
|
Peer
Review of the Ruataniwha Water Storage Scheme Business Case
|
Attachment 1
|
·
Appendix 6 – Sensitivity Analysis
Table 21: Investment Returns
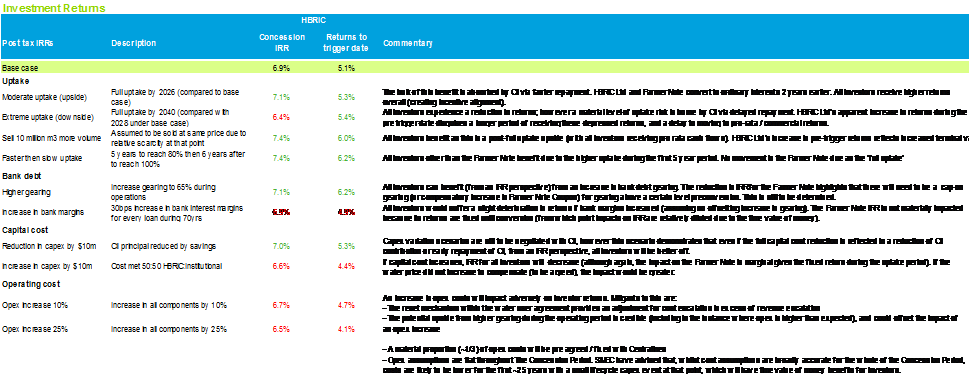
HAWKE’S BAY REGIONAL
COUNCIL
Wednesday 28 May 2014
SUBJECT: Affixing of Common Seal
Reason for Report
1. The Common Seal of the Council has been affixed to the following
documents and signed by the Chairman or Deputy Chairman and Chief Executive or
a Group Manager.
|
|
|
Seal No.
|
Date
|
|
1.1
|
Residential
Leasehold Land Sales
1.1.1 Lot 2
DP
4488
CT 55/121
- Agreement for Sale and
Purchase
1.1.2 Lot 218
DP 10728
CT B4/126
- Agreement for Sale and
Purchase
- Transfer
1.1.3 Lot 16
DP 9651
CT 167/63
- Agreement for Sale and
Purchase
- Transfer
1.1.4 Lot 65
DP 12780
CT E1/743
- Agreement for Sale and
Purchase
1.1.5 Lot 112
DP 13039
CT E2/1252
- Agreement for Sale and
Purchase
1.1.6 Lot 1
DP 13751
CT g3/1002
- Agreement for Sale and
Purchase
|
3777
3778
3781
3779
3783
3780
3782
3784
|
6 May 2014
6 May 2014
15 May 2014
6 May 2014
21 May 2014
9 May 2014
21 May 2014
21 May 2014
|
Decision Making Process
2. Council is required to make every decision in accordance with the
provisions of Sections 77, 78, 80, 81 and 82 of the Local Government Act 2002
(the Act). Staff have assessed the requirements contained within these sections
of the Act in relation to this item and have concluded the following:
2.1 Sections 97 and 88 of the Act do not apply;
2.2 Council can exercise its discretion under
Section 79(1)(a) and 82(3) of the Act and make a decision on this issue without
conferring directly with the community or others due to the nature and
significance of the issue to be considered and decided;
2.3 That the decision to
apply the Common Seal reflects previous policy or other decisions of Council
which (where applicable) will have been subject to the Act’s required
decision making process.
|
Recommendations
That Council:
1. Agrees that the decisions to be made are not significant under the
criteria contained in Council’s adopted policy on significance and that
Council can exercise its discretion under Sections 79(1)(a) and 82(3) of the
Local Government Act 2002 and make decisions on this issue without conferring
directly with the community and persons likely to be affected by or to have
an interest in the decision due to the nature and
significance of the issue to be considered and decided.
2. Confirms the action to affix the Common Seal.
|
|
Diane Wisely
Executive
Assistant
|
Liz Lambert
General
Manager (Operations)
|
Attachment/s
There are no
attachments for this report.
HAWKE’S BAY REGIONAL
COUNCIL
Wednesday 28 May 2014
SUBJECT: Register of Members' Interests
Reason for Report
1. Following are the Interests registered by each elected
representative and the Chief Executive of the Hawke’s Bay Regional
Council. This ‘Register’ (confirmed as correct 30 April 2014)
is presented as a means for Councillors and the Chief Executive to advise
Council of any changes to their interests, and to ensure that the Council
record is current at all times.
|
Councillor Richard Barker
|
Property Ownership in Hawke’s Bay
|
|
|
409 Burnett Street, Hastings
|
|
|
409A Burnett Street, Hastings
|
|
|
18 Thorn Place, Onekawa
|
|
|
Shareholding/Partnerships/Trusts or
Trading Interests
|
|
|
Barker Family Trust
|
|
|
Directorships or Trusteeships
|
|
|
Barker Family Trust
|
|
|
Other Interests
|
|
|
None declared
|
|
|
Directorships or Businesses of
partners/spouses
|
|
|
None declared
|
|
Councillor Peter Beaven
|
Property Ownership in Hawke’s Bay
|
|
|
35A McHardy Street, Havelock North
|
|
|
Shareholding/Partnerships/Trusts or
Trading Interests
|
|
|
None declared
|
|
|
Directorships or Trusteeships
|
|
|
Lagoon Family Trust
|
|
|
Prevar Ltd
|
|
|
Pipfruit NZ
|
|
|
100% Pure NZ Ltd
|
|
|
Other Interests
|
|
|
None declared
|
|
|
Directorships or Businesses of
partners/spouses
|
|
|
None declared
|
|
Councillor Thomas Belford
|
Property Ownership in Hawke’s Bay
|
|
|
40 Raratu Road, RD 14, Havelock North
|
|
|
Shareholding/Partnerships/Trusts or
Trading Interests
|
|
|
Belford Partnership – interest 50%
|
|
|
BayBuzz Ltd – interest 100%
|
|
|
Directorships or Trusteeships
|
|
|
None declared
|
|
|
Other Interests
|
|
|
None declared
|
|
|
Directorships or Businesses of
partners/spouses
|
|
|
None declared
|
|
Councillor Alan Dick
|
Property Ownership in Hawke’s Bay
|
|
|
3 Newbury Place, Taradale, Napier
|
|
|
227 Taradale Road, Greenmeadows, Napier
|
|
|
Shareholding/Partnerships/Trusts or
Trading Interests
|
|
|
Aliz Investments Ltd (not trading)
|
|
|
Directorships or Trusteeships
|
|
|
Aliz Investments Ltd (not trading)
|
|
|
Napier Academy Trust Inc (Trustee)
|
|
|
ME/CFS Support HB (Committee member and
Treasurer)
|
|
|
Other Interests
|
|
|
Gisborne Rail Establishment Group
(Interim Chairman)
|
|
|
Directorships or Businesses of
partners/spouses
|
|
|
Elizabeth Dick, Director of Aliz
Investments Ltd and employed as part-time co-ordinator for ME/CFS Support HB,
also part-time field officer (Napier) for the Stroke Foundation
|
|
Councillor Rex Graham
|
Property Ownership in Hawke’s Bay
|
|
|
Eastella, 232 St Georges Road, Hastings
|
|
|
Shareholding/Partnerships/Trusts or
Trading Interests
|
|
|
Graham Greene Ltd
|
|
|
RGA Holdings Ltd
|
|
|
Fresh New Zealand Ltd
|
|
|
NZ Fruit Tree Company Ltd
|
|
|
Zeesweet Ltd
|
|
|
John Morton Ltd
|
|
|
Shennong Variety Management Ltd
|
|
|
Graham Family Trust
|
|
|
Eastella Trust
|
|
|
Directorships or Trusteeships
|
|
|
Gladeye Ltd (Chairman)
|
|
|
Te Aranga Ltd (Director
|
|
|
Te Aranga-O-Heretaunga Marae Charitable
Trust (Trustee)
|
|
|
HB Regional Sports Park Trust (Trustee)
|
|
|
Te Matau a Mau Voyaging Trust (Trustee)
|
|
|
U-Turn Charitable Trust (Chairman)
|
|
|
Other Interests
|
|
|
None declared
|
|
|
Directorships or Businesses of
partners/spouses
|
|
|
None declared
|
|
Councillor Deborah Hewitt
|
Property Ownership in Hawke’s Bay
|
|
|
227 Porangahau Road, Waipukurau
|
|
|
238 Pourerere Beach Road, Aramoana
|
|
|
Shareholding/Partnerships/Trusts or
Trading Interests
|
|
|
None declared
|
|
|
Directorships or Trusteeships
|
|
|
Hewitt Agribusiness Ltd
|
|
|
Hewitt Livestock Ltd
|
|
|
Hewitt Family Trust
|
|
|
Other Interests
|
|
|
None declared
|
|
|
Directorships or Businesses of
partners/spouses
|
|
|
None declared
|
|
Councillor David Pipe
|
Property Ownership in Hawke’s Bay
|
|
|
25 Vigor Brown Street, Napier
|
|
|
Shareholding/Partnerships/Trusts or
Trading Interests
|
|
|
Napier Community House Trust –
Chair (Charitable Trust)
|
|
|
Directorships or Trusteeships
|
|
|
Hawke’s Bay Tourism
|
|
|
Other Interests
|
|
|
None declared
|
|
|
Directorships or Businesses of
partners/spouses
|
|
|
None declared
|
|
Councillor Christine Scott
|
Property Ownership in Hawke’s Bay
|
|
|
43 Napier Terrace, Napier
|
|
|
Shareholding/Partnerships/Trusts or
Trading Interests
|
|
|
RM & CH Family Trust
|
|
|
Directorships or Trusteeships
|
|
|
ACW Ltd
|
|
|
WASSTB
|
|
|
Other Interests
|
|
|
None declared
|
|
|
Directorships or Businesses of
partners/spouses
|
|
|
None declared
|
|
Chairman Fenton Wilson
|
Property Ownership in Hawke’s Bay
|
|
|
141 Maromauku Road, Wairoa
|
|
|
80 Maromauku Road, Wairoa
|
|
|
Shareholding/Partnerships/Trusts or Trading
Interests
|
|
|
Oruru Land Company Ltd (5%>)
|
|
|
Directorships or Trusteeships
|
|
|
Wairoa Community Development Trust
|
|
|
St Vedas Trust/AH Gordon Trust/Gary
Wilson Family Trust
|
|
|
Other Interests
|
|
|
Smedley Advisory
|
|
|
Directorships or Businesses of
partners/spouses
|
|
|
None declared
|
|
Elizabeth Lambert (CE)
|
Property Ownership in Hawke’s Bay
|
|
|
1 Eton Street, Taradale, Napier
|
|
|
34A Kensington Drive, Napier
|
|
|
Shareholding/Partnerships/Trusts or
Trading Interests
|
|
|
None declared
|
|
|
Directorships or Trusteeships
|
|
|
HB Local Authority Shared Services Ltd
(Director)
|
|
|
Other Interests
|
|
|
None declared
|
|
|
Directorships or Businesses of
partners/spouses
|
|
|
None declared
|
|
|
|
Decision Making
Process
2. Council is required to make a decision in accordance with Part 6
Sub-Part 1, of the Local Government Act 2002 (the Act). Staff have
assessed the requirements contained within this section of the Act in relation
to this item and have concluded that, as this report is for information only
and no decision is to be made, the decision making provisions of the Local
Government Act 2002 do not apply.
|
Recommendations
That Council
confirms the Interest Register is correct as at 28 May 2014.
OR
That Council
records the following changes to the Interests Register as:
1.
2.
|
|
Liz Lambert
Chief
Executive
|
|
Attachment/s
There are no
attachments for this report.
HAWKE’S BAY REGIONAL
COUNCIL
Wednesday 28 May 2014
SUBJECT: Amendment of Council's Investment Policy
Reason for Report
1. This paper
proposes an amendment to Council’s current investment policy in order to
enable Council to achieve the best quoted interest rate on the investment of
its available funds.
Comment
2. Council’s investment policy as adopted as part of the Long
Term Plan 2012-22 (LTP) provides that investments with any one institution at
any time are limited to the greater of:
2.1. $5 million or
2.2. 25% of its
investment class.
3. The purpose of setting up these limitations is to ensure that all
Council’s available funds are not invested in one financial institution
but are spread over a number of financial institutions.
4. The relevant part of the investment policy, covering investing in
banks licensed by the Reserve Bank of New Zealand and other institutions, is
set out in Attachment 1 to this paper.
5. A copy of the maturity profile and allocation by institution for the
investment of Council’s funds as at 31 March 2014 is included in
Attachment 2. This extract is from the financial report presented to Council on
30 April 2014. Given the possibility that Council will need to allocate funds
in the short term to the Ruataniwha Water Storage Scheme (RWSS), funds are
invested in New Zealand trading banks.
6. Changes in circumstances since this investment policy was
introduced, that now give rise to the need to reconsider the limitations
established in it, are:
6.1. The number of
banking institutions available for investment under this policy has been
reduced from six to five with the merging of the ANZ and National banks.
6.2. Council
currently has large sums of money to be invested due to the sell down of Napier
leasehold properties to lessees and the capitalisation of remaining Napier
leasehold cash flows. Therefore the funds that are currently available for
investment are in the order of $80 million.
6.3. There have
recently been significant variations in interest rates offered by the major
trading banks, driven by their requirement for funds at any specific time.
6.4. In September
2013 a report was received from Bancorp Treasury Services Ltd recommending an
approach to investment of funds which would take account of the need to ensure
availability of funds for the RWSS project. The report established that
there were considerable variations in the interest quotes by the major
banks. The report also noted that Council’s current investment
policy setting limits to the holdings for each major bank to 25% of the total
portfolio placed significant constraint on the choice of term deposits and
restricted Council’s ability to achieve the best quoted rate. That
report made the following recommendation.
6.4.1. “That
Council amends its investment policy by increasing the limit able to be
invested with any one institution from the current level of 25% up to
40%.”
7. This paper therefore proposes that Council amends its current
investment policy to reflect the change to “40% in any one
institution”.
8. The Local Government Act 2002, section 102 - Funding and Financial
Policies, provides that such change can be given effect by a resolution of
Council.
9. Staff have also discussed this proposed amendment with
Council’s auditors.
Decision Making
Process
10. Council
is required to make a decision in accordance with the requirements of the Local
Government Act 2002 (the Act). Staff have assessed the requirements
contained in Part 6 Sub Part 1 of the Act in relation to this item and have
concluded the following:
10.1. The decision
does not significantly alter the service provision or affect a strategic asset.
10.2. The use of
the special consultative procedure is not prescribed by legislation.
10.3. The decision
does not fall within the definition of Council’s policy on significance.
10.4. As the amendment of the
investment will enable Council to achieve maximum interest returns from bank
deposits, all persons in the regional community will be affected by increased
Council revenues.
10.5. Options that
have been considered include the recommended change to increase the
exposure of investments in any one bank to 40%, along with the option to leave
the investment policy at the current 25% level.
10.6. The decision
is not inconsistent with an existing policy or plan.
10.7. Given the
nature and significance of the issue to be considered and decided, and also the
persons likely to be affected by, or have an interest in the decisions made,
Council can exercise its discretion and make a decision without consulting
directly with the community or others having an interest in the
decision.
|
Recommendations
That Council:
1. Agrees that the decisions to be made are not significant under the
criteria contained in Council’s adopted policy on significance and that
Council can exercise its discretion under Sections 79(1)(a) and 82(3) of the
Local Government Act 2002 and make decisions on this issue without conferring
directly with the community and persons likely to be affected by or to have
an interest in the decision due to the nature and
significance of the issue to be considered and decided.
2. Approves the amendment of Council’s investment policy
(section 7.1), increasing the limit able to be invested in any one institution
to 40% from the current 25%.
3. Notes that the Local Government Act 2002, section 102 –
Funding and Financial Policies, allows for Council’s Investment Policy
to be amended by resolution of Council and does not require a special
consultative process be undertaken.
|
|
Paul Drury
Group
Manager
Corporate
Services
|
|
Attachment/s
|
1
|
HBRC
Investment Policy - Section 7.1
|
|
|
|
2
|
HBRC
Financial Assets Maturity Profile and Allocation by Institution at 31 March
2014
|
|
|
|
HBRC
Investment Policy - Section 7.1
|
Attachment 1
|
Extract
from LTP 2012-22 Investment Policy covering investing in banks licensed by the
Reserve Bank of New Zealand and other institutions
7.1. Investment Instruments
Investment
instruments include bonds, fixed interest securities and term deposits.
Investments
made under this investment class are only made with:
· Any bank licensed by the Reserve Bank of New Zealand which has a
minimum credit rating as issued by Standard & Poors (or other credit rating
agencies of similar reputation) of:
“A” for short term debt (i.e. for up to 12 months);
“A” for long term debt (i.e. for longer than 12
months).
· Any institution whose debt is issued by or guaranteed by the New
Zealand Government.
· Local authorities, but excluding Council controlled organisations
and Council controlled trading organisations.
· Any corporation, State Owned Enterprise or other legal entities
which have minimum credit ratings for their short and long term debt as set by
Standard & Poors (or other credit rating agencies of similar reputation)
of:
“A” for short term debt (i.e. for up to 12 months);
“A+” for long term debt (i.e. for more than 12 months)
Investments
with any one institution at any time are limited to the greater of:
· $5million, or
· 25% of this investment class.
|
HBRC Financial Assets
Maturity Profile and Allocation by Institution at 31 March 2014
|
Attachment 2
|
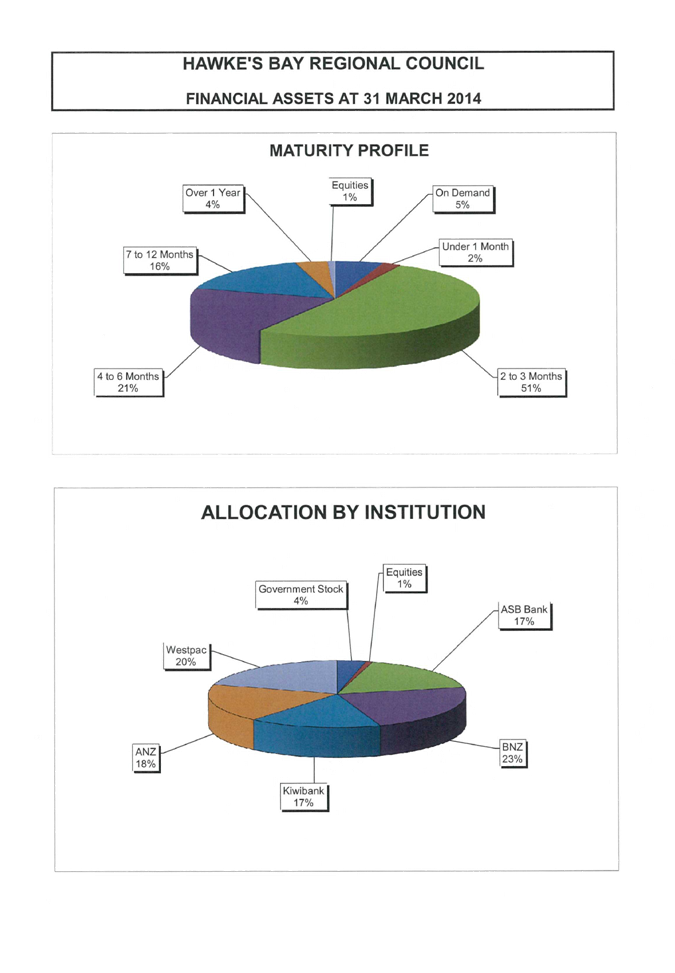
HAWKE’S BAY REGIONAL COUNCIL
Wednesday 28 May 2014
SUBJECT: HBRIC Ltd 2014-15 Statement of Intent
Reason for Report
1. To meet Local Government Act 2002 legislative timeframes, the
Hawke’s Bay Regional Investment Company Limited (HBRIC Ltd) is required
to present its final Statement of Intent (SOI) to Council (as shareholder) for
approval by 30 June.
2. The Council’s investment company (HBRIC Ltd) is a Council
Controlled Trading Organisation (CCTO) and a strategic asset in terms of the
Local Government Act 2002 (the Act).
3. HBRIC Ltd’s first draft of its SOI was submitted to Council on
26 February 2014 in accordance with the requirements of the Act to submit a
draft SOI prior to 1 March each year.
4. Council requested the opportunity to further discuss the draft SOI
at a later date with this taking place at the Council meeting held on 30 April
2014.
5. The draft was further refined by HBRIC Ltd at its Board Meeting held
on 12 May 2014, and is now presented for Council’s final comment and
approval.
Changes from Draft SOI Presented to
Council
6. HBRIC Ltd has
amended the SOI to incorporate changes advised by Council when the draft SOI
was presented on 26 February 2014 and 30 April 2014. These changes are:
6.1. The removal
of the words “a majority of” in the first paragraph on page
7 of the SOI which refers to Council’s strategic objective for HBRIC Ltd
holding the shares in the Napier Port.
6.2. A change in
the date in which the Transition Board will be replaced with an ongoing Board
as set out on page 8 of the SOI. This was presented in the first draft of the
SOI as being from 1 July 2014 but following a delay in financial close of the
RWSS this date has been amended to now be “after the date of the RWSS
financial close”.
7. The HBRIC Ltd
Board, at its meeting held on 12 May 2014, have further refined the SOI that
was presented to Council on 26 February 2014 and 30 April 2014. These changes
are:
7.1. An update to
the detail of HBRIC Ltd’s proposed investment in the RWSS which reflects
a more up to date assessment of the scheme’s progress since the first
draft of the SOI which was presented in February 2014. These changes are
reflected in the last two paragraphs under the heading “Ruataniwha Water
Storage Scheme” on page 7 of the SOI.
7.2. An update to
the Ratio of Shareholders’ Funds to Total Assets in Table 1 on page 10 of
the SOI. The changes to this table reflect the delay in financial close of the
RWSS which results in Council’s advances to HBRIC Ltd not being
capitalised to equity until some point in the 2014/15 financial year.
Council Review
8. Council officers have reviewed the Statement of Intent and confirm:
8.1. It complies
with the requirements of Schedule 8 Clause 9 of the Act
8.2. It is
consistent with and complies with the requirements of the Council’s
Investment Policy as stated in the Long Term Plan 2012-2022.
9. It is also noted the performance targets set by HBRIC Ltd will, if
achieved, ensure dividends will be paid to the Council by HBRIC Ltd at a level
sufficient to meet the Council’s own targets for investment revenue in
2014/15.
Decision Making
Process
10. Council
is required to make a decision in accordance with the requirements of the Local
Government Act 2002 (the Act). Staff have assessed the requirements
contained in Part 6 Sub Part 1 of the Act in relation to this item and have concluded
the following:
10.1. The decision
does not significantly alter the service provision or affect a strategic asset.
10.2. The use of
the special consultative procedure is not prescribed by legislation.
10.3. The decision
does not fall within the definition of Council’s policy on significance.
10.4. The persons
affected by this decision are all persons with an interest in the management of
Council’s investments.
10.5. There were no
other options considered as the requirements and timeframes are legislated.
10.6. The decision
is not inconsistent with an existing policy or plan.
10.7. Given the
nature and significance of the issue to be considered and decided, and also the
persons likely to be affected by, or have an interest in the decisions made,
Council can exercise its discretion and make a decision without consulting
directly with the community or others having an interest in the decision.
|
Recommendations
That Council:
1. Agrees that the decisions to be made are not significant under the
criteria contained in Council’s adopted policy on significance and that
Council can exercise its discretion under Sections 79(1)(a) and 82(3) of the
Local Government Act 2002 and make decisions on this issue without conferring
directly with the community and persons likely to be affected by or to have
an interest in the decision due to the nature and
significance of the issue to be considered and decided.
2. Notes that this Statement of Intent for HBRIC Ltd, as a Council
Controlled Trading Organisation, is required to be presented to Council as a
shareholder of HBRIC Ltd under the provisions of the Local Government Act
2002.
3. Approves HBRIC Ltd’s submitted Statement of Intent, and
notes that the Statement of Intent reflects the Council’s objectives
for HBRIC Ltd and has been prepared in accordance with the requirements of
the Local Government Act 2002.
|
|
Heath Caldwell
Management
Accountant
|
Liz Lambert
Chief
Executive
|
Attachment/s
|
1
|
HBRIC Ltd
2014-15 Statement of Intent
|
|
|
|
HBRIC
Ltd 2014-15 Statement of Intent
|
Attachment 1
|

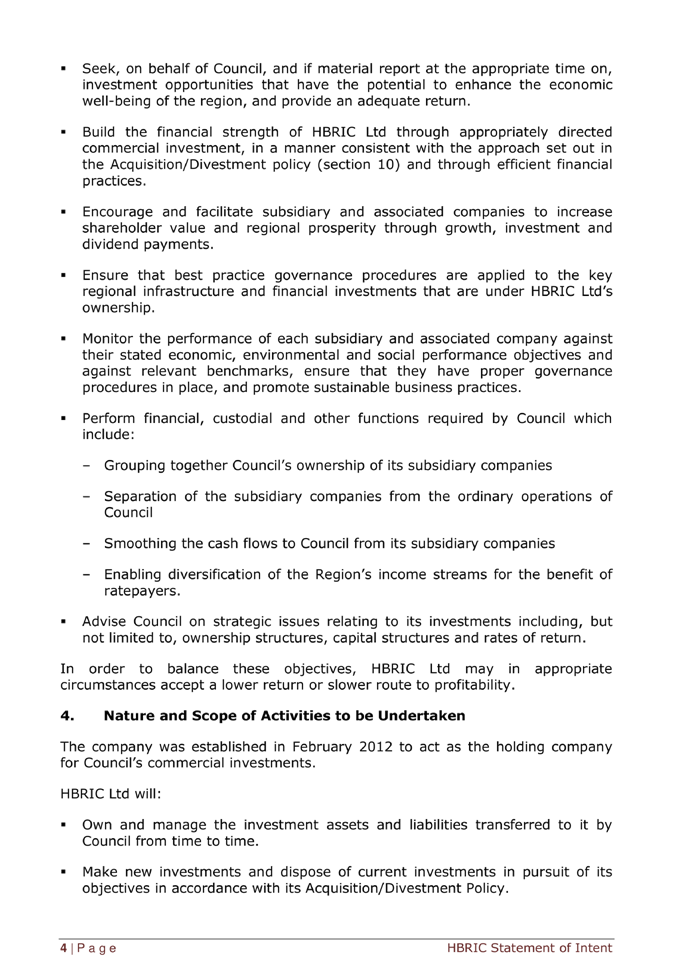

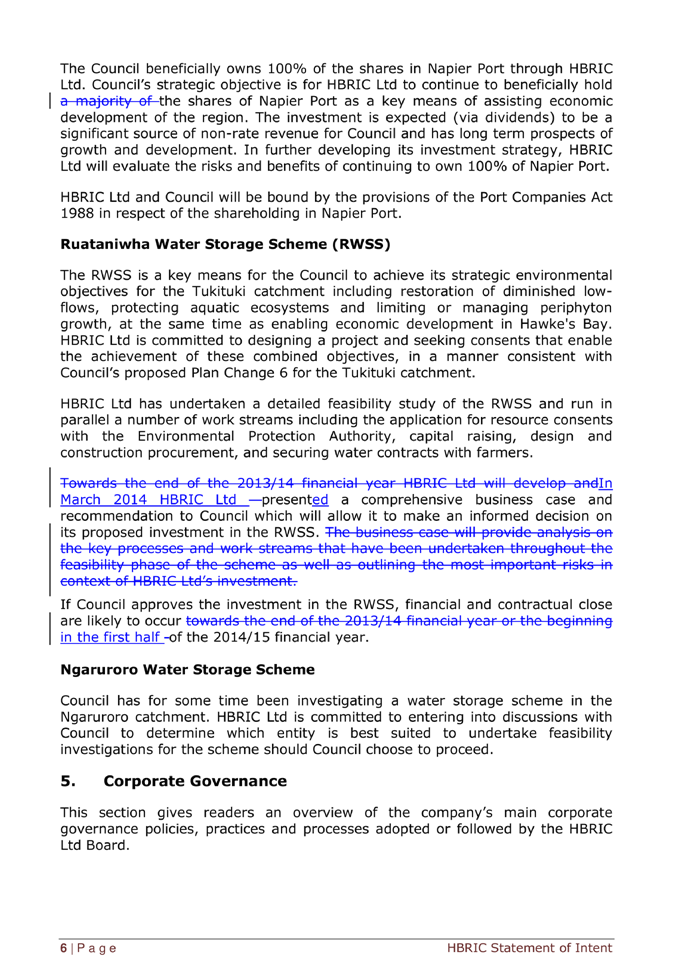

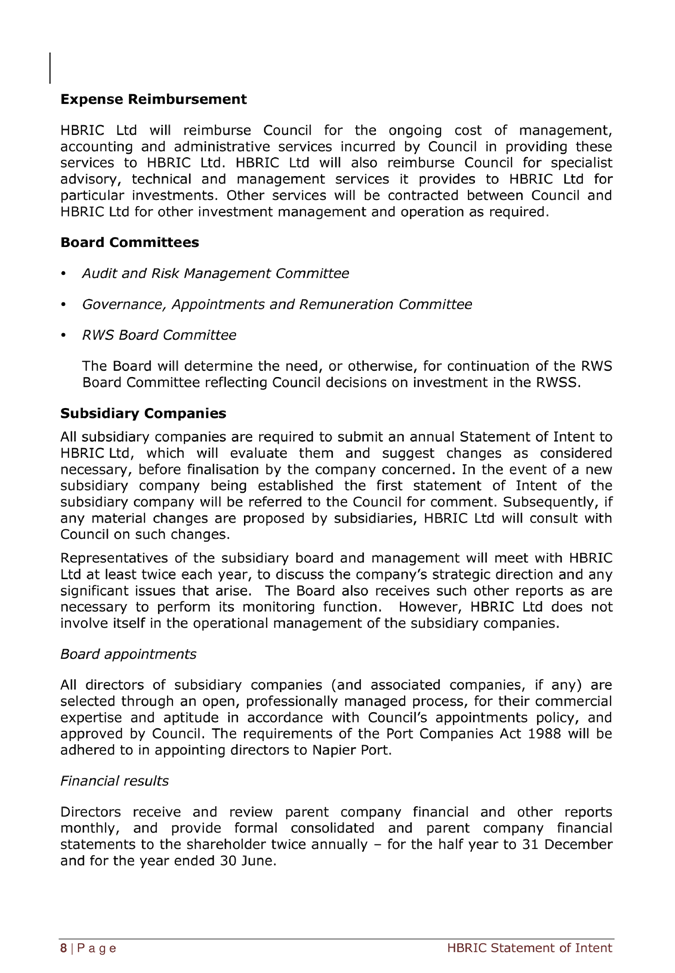
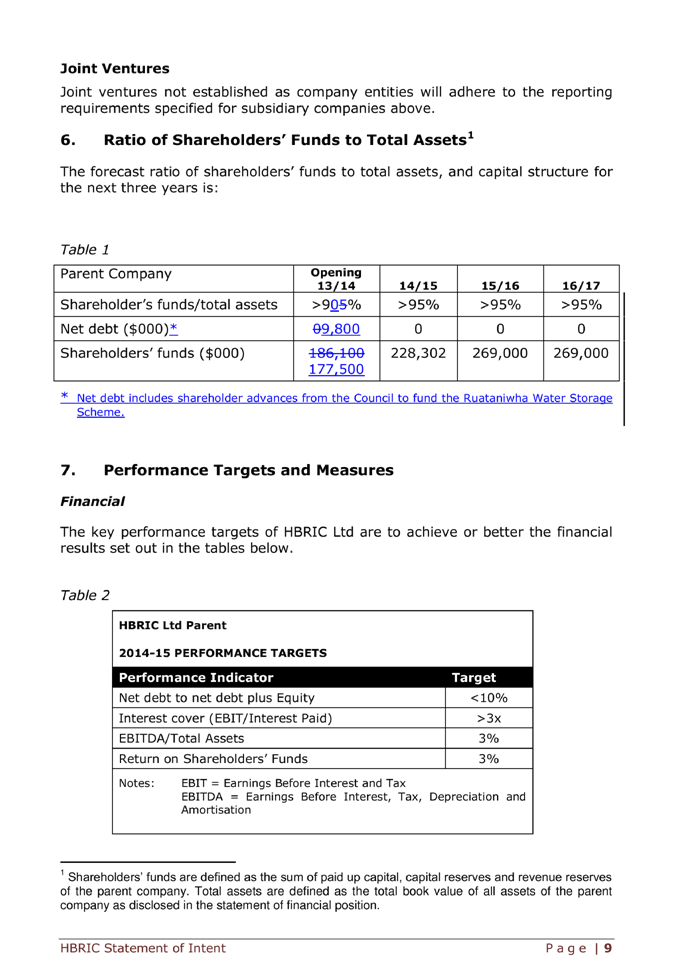

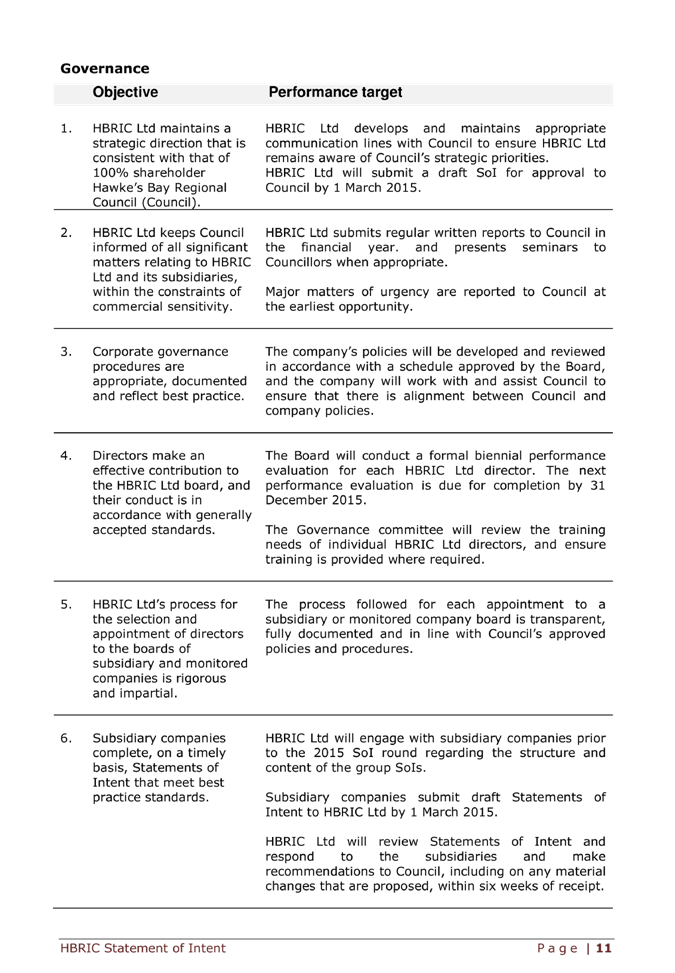
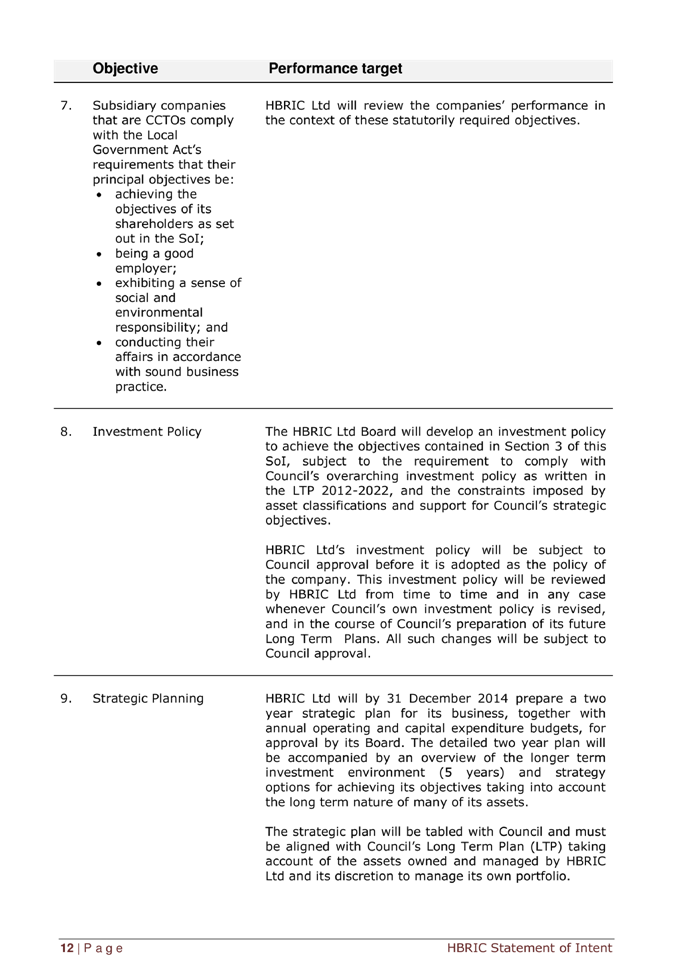
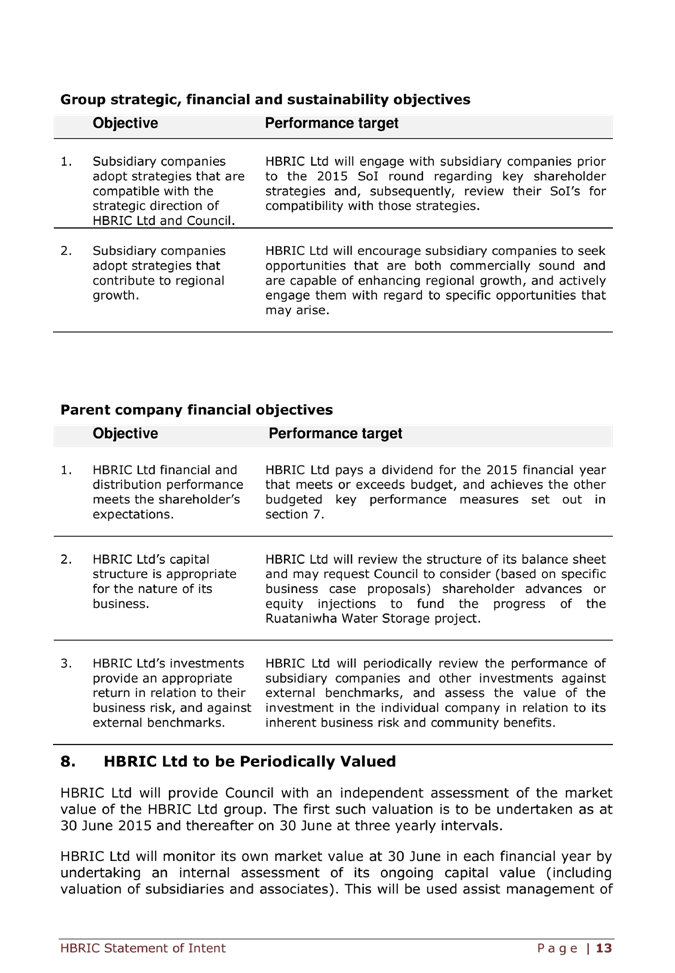


HAWKE’S BAY REGIONAL COUNCIL
Wednesday 28 May 2014
SUBJECT: Recommendations from the Maori Committee
Reason for Report
1. The following
matter was considered by the Maori Committee on 29 April 2014
and is now presented to Council for consideration and approval.
Decision Making
Process
2. This item has
been specifically considered at the Committee level.
|
Recommendations
That Council:
1. Agrees that the decisions to be made are not significant under the
criteria contained in Council’s adopted policy on significance and that
Council can exercise its discretion under Sections 79(1)(a) and 82(3) of the
Local Government Act 2002 and make decisions on this issue without conferring
directly with the community and persons likely to be affected by or to have
an interest in the decision due to the nature and
significance of the issue to be considered and decided.
Heat Smart Grants
and Loans Programme
2. Targets the programme at landlords in those identified areas with
the greatest need for both insulation and clean heat support.
3. Continues
to work with the Hawke’s Bay District Health Board to identify areas
where the provision of its financial assistance will have the greatest impact
on health status in terms of home heating and in reducing PM10 emissions.
|
|
Liz Lambert
Chief
Executive
|
|
Attachment/s
There are no
attachments for this report.
HAWKE’S BAY REGIONAL COUNCIL
Wednesday 28 May 2014
SUBJECT: Hawke's Bay Tourism Quarterly Report
Reason for Report
1. The purpose of this paper is to provide Council with Hawke’s
Bay Tourism Limited (HBTL) results for Quarter 3 of the 2013-14 financial year.
Background
2. At its meeting on 25 May 2011 Council resolved to approve the
funding agreement between the Hawke’s Bay Regional Council and HBTL, for
payment of $850,000 each year for three years commencing 2011/12. Section 11 of
this funding agreement provides for quarterly and annual reports to be
presented to Council to enable Council to monitor the outputs/outcomes being
achieved and the financial progress against budget.
3. The report from HBTL setting out achievements, progress towards the
key performance indicators as set out in the funding agreement, together with
the Company’s financials for the third quarter of the 2013-14 financial
year is attached to this paper.
Decision Making
Process
4. Council is required to make a decision in accordance with Part 6
Sub-Part 1, of the Local Government Act 2002 (the Act). Staff have
assessed the requirements contained within this section of the Act in relation
to this item and have concluded that, as this report is for information only
and no decision is to be made, the decision making provisions of the Local
Government Act 2002 do not apply.
|
Recommendation
1. That Council receives the Hawke’s
Bay Tourism Quarterly Update report for the period ending 31 March 2014.
|
|
Paul Drury
Group
Manager
Corporate
Services
|
|
Attachment/s
|
1
|
HB Tourism
Quarter 3 2013-14 Report
|
|
|
|
2
|
HB Tourism
2013-14 Financials to 31 March 2014
|
|
|
|
HB
Tourism Quarter 3 2013-14 Report
|
Attachment 1
|
Hawke’s Bay Tourism
Ltd – Quarter 3, 2014 
Prepared by Annie Dundas,
GM Hawke’s Bay Tourism
Overall
Hawke’s Bay Tourism Limited
was officially formed in July 2011 and began a three year strategy for
implementing visitor growth to the region supported by a three-year funding commitment
from the Hawke’s Bay Regional Council as well as privately pledged funds
and membership fees. A set of KPI’s were developed and Hawke’s Bay
Tourism has completed all KPI’s to date.
This report will focus on the
January – March 2014 period.
1. Visitor
Statistics
In an effort to take a broader
industry view of what is happening within Hawke’s Bay we will use the
following measures to record visitor arrivals and economic impact.
· Regional Tourism Estimates –
reflecting visitor spend (Please see appendix with graph). The RTEs provide regional
stakeholders with absolute dollar estimates of tourism expenditure at a
detailed regional level (i.e. by regional council, territorial authority,
visitors’ country of origin and industry). Dollars spent is measured by dollars spent in
accommodation, food and beverage services, retail sales, retail sales fuel,
other tourism products and other passenger transport.
· International Visitor Survey –
international visitor arrivals
· Commercial Accommodation Monitor
– hotels, motels, holiday parks and backpackers
· Private Household Monitor
– a measure of friends and family staying in Hawke’s Bay
Overall,
Hawke’s Bay has seen a gradual increase in both domestic and
international visitors staying in the region. This quarter saw good initial
growth but this has slowed in March due to Easter and the school holidays
falling in April (Easter fell in March in 2013). Spend figures show
international visitors spent $85m in the region year end March 2013 and
domestic visitors spent $372m over the same period. (Source Regional Tourism
Estimates) – MBIE – see Appendix for breakdown of spend.
Arrival results for Hawke’s
Bay year end March 2014 combining Commercial Accommodation and Private
Household guest nights show a positive result with an estimated 129,200 extra
guest nights year on year spent in Hawke’s Bay. Commercial nights rose
0.8% year end March and private stays are up 4.6% year on year.
Hawke’s Bay
Tourism, 19 Waghorne Street, Ahuriri, Napier. PO Box 12009, Ahuriri, Napier
4144, New Zealand
WEB:
www.hawkesbaynz.com TWITTER: www.twitter.com/visitorHB
FACEBOOK:
www.facebook.com/hawkesbaynz
Commercial Accommodation and Private Household Monitor -
Hawke's Bay
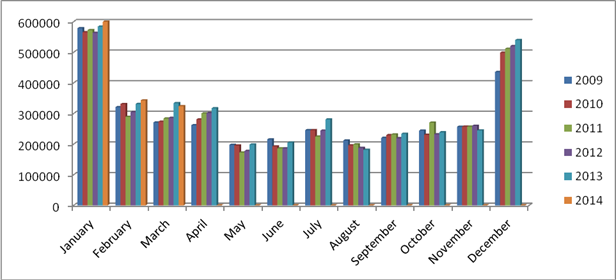
Commercial Accommodation Monitor
Hawke’s Bay
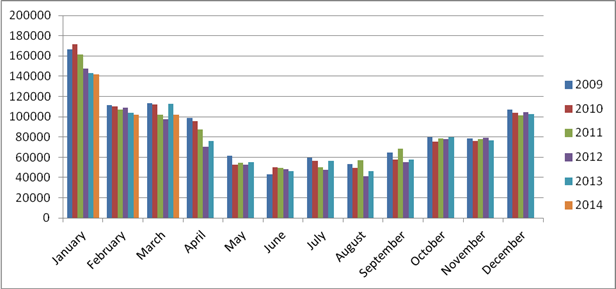
Commercial Accommodation Monitor
(CAM) year end March 2014 shows Hawke’s Bay guest nights up 0.8%%
compared to the same period year end March 2013.The month of March saw a
decline overall which directly relates to Easter falling in April in 2014.
Private Household Monitor
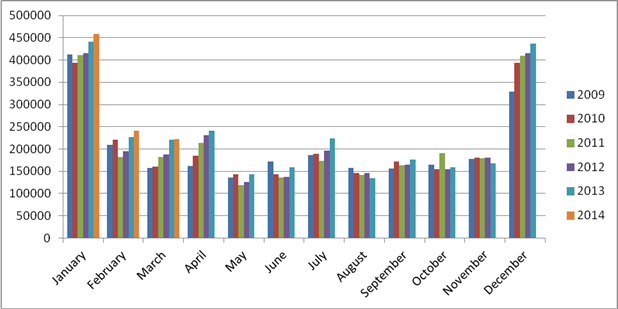
The Private Household Monitor
estimated 58,770 visitors to the Hawke's Bay Region stayed 22,100 nights in
private accommodation during March 2014. This was an increase of 1,021 guest
nights on the previous March. Visitors stayed 3.8 nights. Note this
excludes those who stayed in holiday homes and baches, but includes children
aged 15 or under. The major reasons for visiting Hawke's Bay were visiting
friends and family (74.4% of total nights stayed), and general holiday or
leisure (6.6%) of total nights stayed.
International visitor arrivals into
New Zealand also felt the brunt of Easter with a negative arrival result
overall of -6.3%. Australian arrivals were down 13.4% and the UK was down
19.4%. USA growth continued with arrivals +9.5% and China was up 11.9% for the
month. Year end March 2014 international arrivals were +5.4% or the 12 month
period.
|
International
Visitors to NZ
|
March 2014
|
Year end March
2014
|
|
Total
|
253,561
|
-6.3%
|
2,752,257
|
+5.4%
|
|
Australia
|
99,520
|
-13.4%
|
1,221,152
|
+4.3%
|
|
China
|
23,200
|
+11.9%
|
239,712
|
+14%
|
|
USA
|
26,528
|
+9.5%
|
207,664
|
+10.4%
|
|
UK
|
18,720
|
-19.4%
|
191,872
|
+1.3%
|
Commercial
Accommodation
|
March 2014
|
Year end March
2014
|
|
Hawke’s Bay
|
|
|
|
|
|
Total visitors
|
45,460
|
|
440,793
|
|
|
Total guest nights
|
101,830
|
-9.7%%
|
943,297
|
+0.8%
|
|
International
guest nights
|
31,745
|
-13.8%
|
238,227
|
-3.1%%
|
|
Domestic guest
nights
|
70,085
|
-7.8%
|
705,070
|
+2.2%
|
|
Average length of
stay
|
2.24
|
Up from 2.22
|
2.14
|
Down from 2.15
|
|
Overall occupancy
rate
|
40.9%
|
Down from 42.1%
|
32.9%
|
Up from 31.3%
|
|
Occupancy excl
Holiday Parks
|
57.9%
|
|
45.5%
|
|
|
Hotels
|
14,694
|
-27%
|
147,384
|
+4.0%
|
|
Motels
|
55,630
|
+2.5%
|
497,137
|
+5.1%
|
|
Backpackers
|
15,235
|
+8.8%
|
114,611
|
-4.0%
|
|
Holiday Parks
|
16,272
|
-33.2%
|
184,166
|
-8.8%
|
|
Napier guest
nights
|
52,721
|
-25.7%
|
527,177
|
+0.1%
|
|
Hastings guest
nights
|
41,038
|
-10.5%
|
343,337
|
-0.7%
|
|
Wairoa and Central
Hawke’s Bay
|
8,071
|
+7.2%
|
72,783
|
+3.7%
|
|
Other Regions
Total Guest Nights
|
|
|
|
|
|
Coromandel
|
78,230
|
-10.4%
|
729035
|
0%
|
|
Bay of Plenty
|
95,031
|
-13.4%
|
1,069,526
|
+7%
|
|
Rotorua
|
160,761
|
-7.5%
|
1,792,225
|
+3%
|
|
Taupo
|
86,102
|
-17.7%
|
954,518
|
0%
|
|
Gisborne
|
30,954
|
-6.6%
|
326,153
|
+4%
|
|
Wellington
|
228,814
|
-2.2%
|
2,390,143
|
+2%
|
|
Nelson
|
134,236
|
-0.7%
|
1,224429
|
+2%
|
|
Wanaka
|
59,707
|
-8.1%
|
627,158
|
-7%
|
|
Queenstown
|
268,443
|
+5.2%
|
2,837,398
|
+9%
|
|
Private Household
Monitor
|
March 2014
|
March 2014
|
|
Total Visitors
|
58,770
|
+15%
|
672,631
|
+8.4%
|
|
Total Visitor
nights
|
222,100
|
+0.5%
|
2,762,022
|
+4.6%
|
Key
Performance Indicators for Hawke’s Bay Tourism
The organisation has been
working towards the goals and objectives set out in the Strategic Plan signed
off by HBRC in May 2011.
In the third quarter of
the 2013 2014 financial year the following KPI’s have been met;
1. Hawke’s
Bay Tourism - the Regional Tourism Organisation is well established
and has almost completed three years of operation.
2. Brand
– The “Hawke’s Bay” brand continues to be widely used
and is well established and used consistently in all marketing activity. Many
Hawke’s Bay entities such as Business Hawke’s Bay, Food
Hawke’s Bay, Central Hawke’s Bay, Havelock North Business
Association, and Education Hawke’s Bay have adopted the brand for their
own representation. Regional collateral also carries this brand which covers
the Hawke’s Bay Visitor Guide, The Art Guide, The Food Trail Map, The
Hawke’s Bay Trails Map, The Wine Trail Map and the Hawke’s Bay
Summer Guide. In addition Hawke’s Bay Tourism has created and owns the
F.A.W.C! brand as well as The Big Easy brand.
3. Consumer Marketing -
· Advertising - “Get
me to Hawke’s Bay”
“The Get me to
Hawke’s Bay” is the tagline used in all campaign activity.
Campaign activity has run
through the third quarter online. The focus of activity through this period has
been to target families (up until the end of January) and boomers for late
summer and autumn travel. Hawke’s Bay Tourism has utilised the video
assets created in conjunction with Napier Tourism Services and Hastings
District Council and pushed them via targeted online channels. Channels used include
Youtube and Facebook and websites such as stuff.co.nz and nzherald.co.nz.
Advertising to promote
the Big Easy focused on using a new Big Easy video clip posted via Facebook.
One paid for post generated over 34,500 views.
· Search engine marketing
also continues.
· Public relations
Hawke’s
Bay Tourism has hosted the following media in region between Jan-March:
· Times Life
India
· Taste
Magazine
· Jetstar
Inflight Magazine
· Jose Cuancas
VIP USA
· Wine NZ
Magazine
· Escape Travel Supplement,
Australia (Hawke’s Bay Trails cycling specific story) News Limited
syndication
· Golf Magazine,
Australia - 35 000 readers monthly
· Golf Travel, China
readers 400 000
· Golf traveller, China
· Motorcylist Magazine, USA
206 000 readers, 500 000 unique users per month
· Motorhome Magazine, USA
350 000 readers
· San Fran Chronicle USA
400 000 readers
· Niijiro Jean TV, Japan
(Art Deco W/e) 8 million viewers per episode
· Asian Food Channel NEW
· Arthub, Australia (Art
Deco Weekend)
· Livelounge, Australia(Art
Deco Weekend)
· Baccarat, Indonesia (Art
Deco Weekend) 50 000 readers
· MSN Canada (Art Deco
Weekend) 9.6 million unique users per month
· Ensemble Vacations,
Canada 120 000 readers
· Financial Times UK 236
000 readers
· Marie Claire Travel, UK
230 000 readers
Media Results from Jan –March
include:
· India Times
http://articles.economictimes.indiatimes.com/2014-02-09/news/47149191_1_bike-tour-wineries-vineyards
· ArtHub
http://www.artshub.com.au/news-article/festival/news-article/news/festivals/art-deco-comes-to-life-198254
· http://www.artshub.com.au/news-article/news-article/feature/design/art-deco-capital-embraces-tragic-gift-198245
· http://www.artshub.com.au/news-article/festival/news-article/feature/festivals/eight-reasons-new-zealand-is-now-a-cultural-destination-198279
Digital Strategy
www.hawkesbaynz.com is performing
well with unique visitation up 16%. Over 20,000 people visit the site each
month. In addition Hawke’s Bay Tourism also owns www.fawc.co.nz and
www.thebigeasy.co.nz . Both of these sites are generating strong traffic. The
region’s official facebook page has 27,000 followers.
|
www.hawkesbaynz.com
|
Year
end March 2013
|
Year
end March 2014
|
+/-
|
|
Visits
to site
|
218,859
|
247,095
|
+12.90%
|
|
Unique
Users
|
156,046
|
181,368
|
+16.22%
|
Research
A monthly one-page
tourism monitor has been established and is distributed to stakeholders and
industry each month.
4. Trade Marketing
Trade
Shows
· Explore Central North
Island Expo – Hawke’s Bay Tourism coordinated the Hawke’s Bay
branded area where 11 Hawke’s Bay operators attended the show in Auckland
to showcase their businesses to over 150 travel sellers specializing in free
and independent travel for international visitors.
· Convene Tradeshow –
Hawke’s Bay Tourism coordinated the Hawke’s Bay branded area where
8 Hawke’s Bay operators attended this show in Auckland which focuses on
corporate and conference business.
Trade
Familiarisations
· 8 American based travel
agents attended Art Deco Weekend in order to experience the event to then
package and sell in the USA to potential travelers. This activity was part of
HBT’s commitment to the Major Event Funding received by the Art Deco
Trust.
· 8 North American agents
from travel seller Goway visited Hawke’s Bay on a two day famil program.
Goway is the largest wholesaler in North America.
Product
Workshops
· Hawke’s Bay Tourism
attended the Tourism New Zealand UK/European Workshop in London, representing
the Pacific Coast Highway. Sixty-six appointments were had with buyers from the
UK and Europe. Explore Central North Island (three touring routes – Thermal
Explorer Highway, Pacific Coast Highway and the Volcanic Loop) is made up
of eight central North Island regions. Each contributes an annual marketing fee
to be represented at Tourism New Zealand run events in our key visitor markets.
Trade Collateral
· Hawke’s
Bay Luxury brochure has been developed and sent to key luxury travel sellers
· A Chinese
language Hawke’s Bay tool kit has been developed for the China market
Conference Activity
Key business won in this
quarter -
· Bus and Coach Conference
– Oct 2015 – 300 pax – venue pending due to Hawke’s Bay
Opera House closure
· Harcourt’s Real
Estate – the executive board and 100 top sellers - 2014
· Air NZ Wine Awards
– confirmed Pettigrew Arena, November 2014
5. Events
Regional Events Strategy
· A renewed focus to the
events strategy has been undertaken due to the priority given to events by both
Napier City Council and Hastings District Council having employed key event
staff. Hawke’s Bay Tourism is coordinating the regions effort with close
collaboration with both Councils and Sport Hawke’s Bay. The key objective
is to increase visitor nights in the region, particularly in the off-season.
Event Activity
· Art Deco Weekend was held
over 20-23 February 2014 and it attracted crowds of 35,000 - 40,000.There were 200+
events held (mixture of free and ticketed events) with approximately 70% of
tickets available sold. There were increased international visitors to
Hawke’s Bay, + 39.5% on the previous year’s attendance. HBT played
a large part in supporting this event with a substantial media and travel agent
programme running alongside the event.
· Cricket World Cup 2015
– Hawke’s Bay Tourism will lead the Community Engagement Group
– made up of Councils, Cricket Associations and promotions groups. HBT
has sent a plan to Cricket New Zealand for consideration which will be worked
on with all Councils. We hope to include an Art Deco cricket game at the
Clifton County Cricket Club.
Events being worked on by HBT
· The Big Easy at Easter
and the ‘Not so Easy”, April 18/19, 2014 in conjunction with Napier
City Council, Hastings District Council, Hawke’s Bay Regional Council and
Sport Hawke’s Bay.
· Four Weekends of Winter
F.A.W.C! June 6-29
· The All Black vs. Argentina
Test September 6, 2014
Hawke’s
Bay Tourism – Financial Statement
Hawke’s Bay Tourism
Ltd is tracking favourably to the end of the third quarter in 2014. The
variance reflects greater campaign and event management spend in Q3 which we
had planned for in Q4.
External/Other Revenue
includes F.A.W.C! (Summer and Winter) ticket sales. This is collected by
Hawke’s Bay Tourism and then passed on to event managers. This also
includes income from The Big Easy which goes towards the running of the event.
Membership changes have
resulted in 214 financial members joining the organization, the total
membership is approximately 800.
Appendix
Spend data: Regional
Tourism Estimates Year end March 2013
|
Sum of Spend ($m) by origin
|
|
|
|
|
|
|
|
|
Product
|
Accommodation
|
Food and
beverage serving services
|
Other
passenger transport
|
Other
tourism products
|
Retail
sales - fuel and other automotive
|
Retail
sales - other
|
Grand
Total
|
|
Domestic
|
38
|
43
|
34
|
156
|
90
|
123
|
483
|
|
Auckland
|
9
|
8
|
6
|
7
|
11
|
15
|
57
|
|
Bay of Plenty
|
3
|
2
|
1
|
39
|
5
|
6
|
57
|
|
Canterbury
|
2
|
3
|
2
|
2
|
3
|
6
|
17
|
|
Gisborne
|
1
|
1
|
2
|
2
|
4
|
4
|
15
|
|
Hawke's Bay
|
2
|
9
|
12
|
11
|
31
|
46
|
111
|
|
Manawatu-Wanganui
|
4
|
4
|
2
|
17
|
9
|
12
|
48
|
|
Marlborough
|
0
|
0
|
1
|
0
|
0
|
1
|
2
|
|
Nelson
|
0
|
0
|
0
|
0
|
0
|
0
|
1
|
|
Northland
|
0
|
0
|
0
|
4
|
1
|
1
|
7
|
|
Otago
|
1
|
1
|
1
|
1
|
1
|
1
|
5
|
|
Southland
|
0
|
0
|
0
|
0
|
0
|
1
|
2
|
|
Taranaki
|
1
|
1
|
0
|
6
|
1
|
4
|
13
|
|
Tasman
|
0
|
0
|
0
|
0
|
0
|
0
|
2
|
|
Waikato
|
3
|
4
|
2
|
58
|
7
|
8
|
83
|
|
Wellington
|
10
|
8
|
5
|
9
|
15
|
18
|
64
|
|
West Coast
|
0
|
0
|
0
|
0
|
0
|
0
|
0
|
|
International
|
15
|
27
|
9
|
5
|
7
|
22
|
85
|
|
Australia
|
6
|
11
|
4
|
2
|
3
|
9
|
36
|
|
Japan
|
1
|
1
|
0
|
0
|
0
|
1
|
3
|
|
Germany
|
1
|
1
|
0
|
0
|
1
|
1
|
3
|
|
Canada
|
1
|
1
|
0
|
0
|
0
|
1
|
3
|
|
Rest of Asia
|
1
|
2
|
0
|
0
|
0
|
2
|
5
|
|
Rest of Americas
|
0
|
0
|
0
|
0
|
0
|
0
|
1
|
|
Rest of Europe
|
2
|
3
|
1
|
0
|
1
|
2
|
8
|
|
Rest of Oceania
|
0
|
0
|
0
|
0
|
0
|
1
|
2
|
|
Africa and Middle East
|
0
|
1
|
0
|
0
|
0
|
1
|
3
|
|
United Kingdom
|
2
|
5
|
2
|
1
|
1
|
3
|
14
|
|
China, People's Republic of
|
0
|
0
|
0
|
0
|
0
|
0
|
1
|
|
Korea, Republic of
|
0
|
0
|
0
|
0
|
0
|
0
|
0
|
|
United States of America
|
1
|
2
|
1
|
0
|
0
|
1
|
6
|
|
Grand Total
|
53
|
70
|
42
|
161
|
97
|
145
|
568
|
|
HB Tourism 2013-14
Financials to 31 March 2014
|
Attachment 2
|
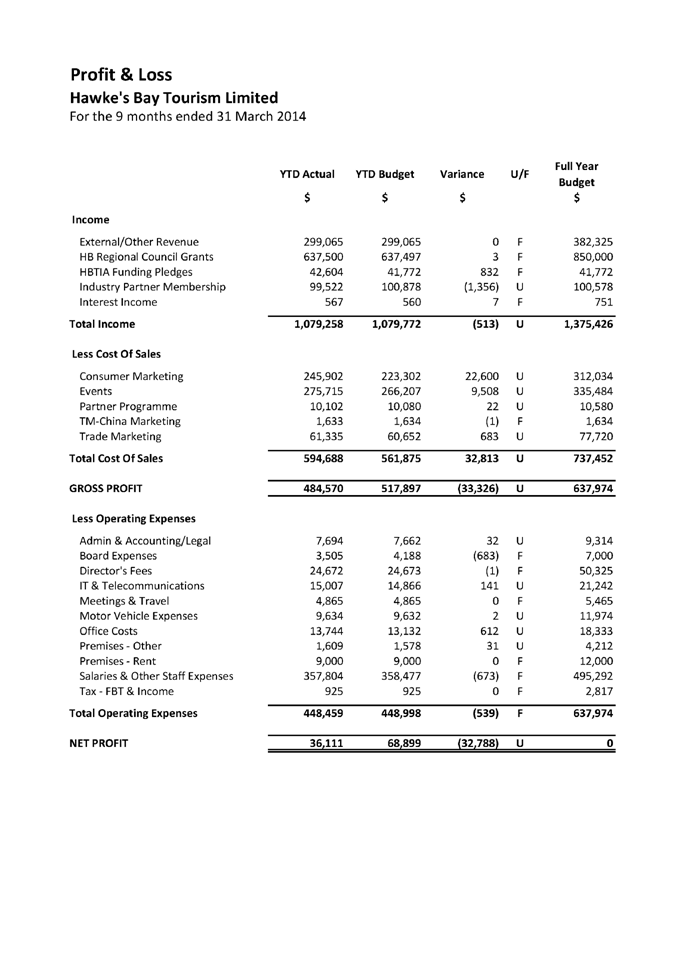
HAWKE’S BAY REGIONAL COUNCIL
Wednesday 28 May 2014
SUBJECT: Monthly Work Plan Looking Forward Through May 2014
Reason for Report
1. The table below is provided for
Councillors’ information, to provide them with an indication of issues
and activities coming up over the next month in each area of Council.
|
Group
|
Area of
Activity
|
Activity
Status Update
|
|
Asset Management & Biosecurity
|
Land Management
Engineering
Upper Makara Scheme
Open Spaces
|
- Papanui catchment pilot implementation
for Plan Change 6 being progressed. 1 further steering group meeting
planned prior to 30 June.
- Hill eountry erosion programme of in
Wairoa district and initial work in Tukituki catchment commenced.
Regional hill country programme for next 4 years being developed in
collaboration with Ministry of Primary Industries (MPI) as potential funding
application.
- Further discussions to be held with MPI
regarding potential collaboration on Maori agribusiness development.
- Huatokitoki research outcome field day to
be held on 26 June.
- Asset Management Plans for each of the
Flood Control and Drainage Schemes administered by HBRC will be progressed
during the month. Plans will need to be adopted by Council late in
2014.
- A 30 year infrastructure strategy is also
required by the Local Government Act 2002 Amendment Bill. A programme for the
development of this strategy will be developed.
- Construction work to repair the Makara No
1 Dam will be completed.
- The development of individual management
plans for Pekapeka, Tutira and Pakowhai Regional Parks initiated with
objective of completing to draft stage for consultation by 30 June 2014.
|
|
Asset Management & Biosecurity
|
Forestry
Coastal
Biosecurity
|
- A review of Council’s forestry
portfolio is being undertaken and will be reported back to Council later in
2014.
- A review of the Tangoio Soil Conservation
Reserve Management Plan has been commenced. The review process will
include consultation with a number of stakeholders. Once the
consultation process has been completed it will be brought to Council for
consideration and adoption.
- Harvesting of Stands 2.01 and 2.02 in the
Reserve underway. Harvesting is expected to take until May 2014.
- Proposal for development of a strategy
for coast between Clifton and Tangoio approved by HBRC. Liaison with
HDC, NCC and iwi continuing to enable establishment of a governance group.
- Cost benefit analysis for individual pest
species under the plan and preparation of broad plan review framework
underway.
- Cape to City trial underway.
- Transfer of 16,000ha of land from TBfree
programme to HBRC possum control area programme to be achieved by 30
June. Preparations for the transfer of a further 80,000ha in the
2014/15 year being considered.
|
|
Corporate Services
|
|
- Draft Annual Plan:
– 103 submissions received.
– Staff responses to
submissions under development, for distribution to Council with Hearing
Agenda on or before 28 May.
– Submissions hearings
scheduled for 4 & 5 June 2014.
- Adoption of the final Annual Plan for
2014/15 at the 25 June 2014 Council meeting.
- Amended proposal to be received from
HBRIC Ltd re funding the shortfall and/or amended drawdown schedule to keep
Council’s contributions to RWSS cost neutral.
|
|
External
Relations/ CE’s office
|
Communications
CE’s
Office
|
- National Horticultural Field Day
Hawke’s Bay Showgrounds – HBRC principal partner with A&P
Society – Thursday 5th June 2014.
- Coordination of responses to submissions
on Draft Annual Plan and on HBRC Statement of Proposal for Potential
Investment in the Ruataniwha Water Storage Scheme
|
|
Resource Management
|
Client Services
|
- Science charging, data verification for
year end billing.
|
|
Resource Management
|
Compliance
|
- The global consent trial with Twyford
Irrigators will be evaluated with a view to forming a template for future
consents of the same type.
- A draft compliance strategic plan has
been completed and in conjunction with recommendations for continued
compliance service will be presented to the Executive and Council.
- A request will be made to reconsider the
cost recovery regime and requirement to align with the current and projected
work stream and mix.
|
|
Resource Management continued
|
Science
|
- Science investigations for the Greater
Heretaunga and Ahuriri management zone continue
- Sediment modelling continues in the
Tukituki, and riparian mapping continues in the TANK area.
- Technical Advisory Group formed for the
proposed development of a coupled/linked surface-groundwater model has met
and decided on the initial approach. Initial groundwater model design
continues.
- Conduct of fieldwork associated with
Greater Heretaunga and Ahuriri management zone plan change continues –
surface water quality, estuarine water quality and spring-fed streams.
- The Hydrometric Network continues to be
under internal review. The review includes the potential addition of any NIWA
sites and the resulting resourcing required to operate and to archive the
data according to relevant performance standards. A paper is to be provided
to Council on this in the near future.
- Workstreams associated with the Mohaka
Plan Change implementation continue. Hawke’s Bay is working with
Environment Bay of Plenty and GNS on a collaborative investigation of catchment
boundaries and groundwater.
- Workstreams associated with the Tukituki
Plan Change implementation continue, with emphasis on phosphorus
mobilisation.
- Routine monthly SoE surface water and
groundwater monitoring programmes continue.
- Regional SoE reporting is being
developed.
- First draft of “Mohaka River
catchment characterisation report” being edited.
- The first draft of the Mohaka River SoE
report will be reviewed and edited.
- Assessing additional investigations for
Taharua/Mohaka and requirements for groundwater flow model.
- Collating available data for Lake
Poukawa. Assessing additional investigations for modelling
requirements.
- The planning and execution of the TANK
programme of work continues.
- The draft process for publishing reports
to HBRC website will continue to be developed with assistance from Corporate
|
|
Resource Management
|
Consents
|
- Ongoing consent processing
- Havelock North Fruit Co. application to
take groundwater has been limited notified. A tentative hearing date is proposed
for late May. Hearing panel to be appointed.
- NCC application for coastal protection
structure at Whakarire on hold but likely to proceed to a hearing.
- Poukawa group of consents on hold while
monitoring is identified and a Catchment Management Strategy is considered
which may avoid the need for hearing.
|
|
Strategic Development
|
Resource
Management Planning
|
- Negotiations with appellants and
associated parties continuing on Change 5 following 2 Environment Court
mediation sessions. Most parties willing to participate in 3rd
mediation session yet to be scheduled by Environment Court.
- Board of Inquiry’s draft decision
issued 15 April. Ministers have granted a further extension so
BOI’s final decision now to be issued by 28 June 2014. Work
continuing on Implementation Plan.
- TANK Group reviewing terms of reference
and meeting schedule/work programme for Phases 2 and 3 of their tasks leading
to preparation of a plan change. Next TANK Group meeting scheduled for
22 or 29 July.
- Taharua/Mohaka stakeholder discussions
continuing in parallel to science investigations. Includes hui with iwi
representatives.
- Further submission lodged in relation the
proposed Hastings District Plan. Initial discussions with other
submitters occurring prior to hearings commencing mid-late 2014 on Hastings
District Plan and Plan Change 10 to Napier District Plan.
- Further revision of first draft of HB
Biodiversity Strategy by the Core Working Group following feedback from
external Steering Group at 10 April meeting. Steering Group to meet in
July to review second draft version of Strategy.
|
|
Strategic Development
|
Transport
|
- Preparation of the Regional Land
Transport Plan and Regional Public Transport Plan has commenced, as required
by the Land Transport Management Act 2003. The Regional Land Transport
Plan is the region’s bid to central government for all transport
funding (for roading, public transport, walking and cycling, road safety
etc) for 2015-21. The Regional Public Transport Plan sets out how
public transport services will be provided in the region for 2015-18.
Preparation of this plan will commence with a review of the existing bus
service.
- Initial results from the New Zealand
Transport Agency’s review of funding assistance rates have been
announced and councils in the region are evaluating the effects on their
transport budgets from 2015 onwards.
- The Ministry of Transport has advised
that consultation on the Draft Government Policy Statement for Land Transport
has been delayed until early June.
|
|
Civil Defence & Emergency Management
|
HB CDEM Group - Draft Group Plan
|
- Submissions heard on 11 April by Joint
Committee Meeting; the outcome of that meeting being some minor changes to
the draft plan which was sent to the Minister of Civil Defence for her
comments. These are expected back before the end of May.
|
Decision
Making Process
2. Council is required to make a decision in accordance with Part 6
Sub-Part 1, of the Local Government Act 2002 (the Act). Staff have assessed the
requirements contained within this section of the Act in relation to this item
and have concluded that as this report is for information only and no decision
is required in terms of the Local Government Act’s provisions, the
decision making procedures set out in the Act do not apply.
|
Recommendation
1. That Council receives the Monthly Work Plan
Looking Forward Through June 2014 report.
|
|
Mike Adye
Group
Manager
Asset
Management
|
Helen Codlin
Group
Manager
Strategic
Development
|
|
Paul Drury
Group
Manager
Corporate
Services
|
Ian Macdonald
Group
Manager/Controller Hawke's Bay Civil Defence Emergency Management
|
|
Iain Maxwell
Group
Manager
Resource
Management
|
Liz Lambert
Chief
Executive
|
Attachment/s
There are no
attachments for this report.
HAWKE’S BAY REGIONAL
COUNCIL
Wednesday 28 May 2014
SUBJECT: Minor Items Not on the Agenda
Reason
for Report
1. Under standing orders, SO 3.7.6:
“Where an item is not on the agenda
for a meeting,
(a) That item may be discussed
at that meeting if:
(i) that
item is a minor matter relating to the general business of the local authority;
and
(ii) the
presiding member explains at the beginning of the meeting, at a time when it is
open to the public, that the item will be discussed at the meeting; but
(b) No
resolution, decision, or recommendation may be made in respect of that item
except to refer that item to a subsequent meeting of the local authority for
further discussion.”
2. This document has been prepared to assist
Councillors note the Minor Items Not on the Agenda to be discussed as determined
earlier in Agenda Item 6.
|
Item
|
Topic
|
Councillor
/ Staff
|
|
1.
|
|
|
|
2.
|
|
|
|
3.
|
|
|
|
4.
|
|
|
|
5.
|
|
|