Meeting of the Hawke's Bay Regional Council Maori
Committee
Date: Tuesday 28 June 2011
Time: 10.15am
|
Venue:
|
Council Chamber
Hawke's Bay Regional Council
159 Dalton Street
NAPIER
|
Attachments
Excluded From Agenda
item subject page
12. Taharua
and Upper Mohaka Draft Strategy
Attachment 1: Draft
Taharua and Upper Mohaka Strategy
15. Tukituki
High Flow Allocation Modelling
Attachment 1: Tukituki
River Catchment High Flow Allocation Modelling Report
|
Draft Taharua and Upper Mohaka Strategy
|
Attachment 1
|


|
Tukituki River Catchment
High Flow Allocation Modelling Report
|
Attachment 1
|
|
Tukituki River Catchment High Flow
Allocation Modelling Report
|
Attachment 1
|
|
Tukituki River Catchment High Flow
Allocation Modelling Report
|
Attachment 1
|
|
Resource
Management Group
|
|
Environmental
Science Section
|
|
|
|
Tukituki River Catchment
High
Flow Allocation Modelling
|
|
|
|
Prepared by:
Rob Waldron – Hydrology
Resource Analyst
|
………………………………………………..
Signature:
|
|
|
|
|
|
|
|
Reviewed by:
Rob Christie – Principal
Scientist, Surface Water Quantity
|
………………………………………………..
Signature:
|
|
|
|
|
Approved:
Darryl Lew, Group Manager – Resource Management
|
………………………………………………..
Signature:
|
|
|
|
|
June 2011
ISSN 1179 8513
emT
11/02
HBRC Plan No. 4258
© Copyright: Hawke’s Bay Regional Council
|
|
Tukituki River Catchment High Flow
Allocation Modelling Report
|
Attachment 1
|
|
Tukituki River Catchment High Flow
Allocation Modelling Report
|
Attachment 1
|
executive summary
Water resources in Hawke’s Bay
are facing increasing pressure from consumptive abstraction. The region is
characterised by a warm dry climate with long dry periods with low rainfall and
low river flow conditions. The core allocation in many Hawke’s Bay catchments
is now over-allocated and the Hawke’s Bay Regional Council is currently
exploring different water management options for the region.
One method used to mitigate the
interruption of water supply during periods of low flow conditions (reducing
the exposure to abstraction bans) is by sustainably harvesting and storing
water during periods when river flows are high. High flow abstractions are an
intrinsic component of water storage solutions.
This
report assesses the effect of different potential methods of water allocation
during high river flows within the winter and spring months of June to
November, from four established hydrological sites on rivers in the Tukituki
Catchment: Tukipo River at State Highway 50, Tukituki River at Tapairu
Rd, Waipawa River at RDS and Tukituki River at Red Bridge.
The
most suitable methods for each site have been selected based on the results of
hydrological, ecological and security of water supply analyses, in terms of
providing a sustainable flow (high flow allocation threshold) above which high
flow allocation is made available, combined with a sustainable allocation limit
(allocation cap) allowing for abstraction without adversely impacting on flow
variability and instream ecological requirements, while providing an optimum
security of supply.
Eight different high flow
allocation scenarios were developed for each site which use high flow
allocation thresholds (HFA thresholds) set as either mean or median flow
combined with either of two selected high flow allocation caps (HFA caps) for
each site. A flow sharing approach has been used in all scenarios where either
50% or 33% of flow above the HFA threshold up to the HFA cap is allocated for
abstraction, with the rest (50% or 67% respectively) remaining in the river.
Hydrological analyses identified
minor variations between the naturalised and modelled flow records for each
high flow allocation scenario. Allocation scenarios with a median flow HFA
threshold produced the greatest change (although still ≤17.5%) to all key
hydrological statistics.
The availability of water for
abstraction under each allocation scenario was assessed. The quantity of the
allocation that can be utilised for abstraction depends on the duration and
magnitude of high river flows.
The potential security of supply
to water users provided by each high flow allocation scenario was assessed in
terms of the percentage of time water is available for abstraction. All
scenarios with median flow HFA thresholds provide water available for
abstraction for a greater percentage of time than scenarios with mean flow HFA
thresholds. Therefore all scenarios with median flow HFA thresholds provide
high flow allocations with the greatest security of supply to water users.
The FRE3 analyses (a hydrological
index identified by Clausen & Biggs (1997) as the most ecologically
relevant for characterizing hydrological regimes in New Zealand streams and
rivers) showed that all modelled scenarios for each site alter the FRE3 by less than 10 percent and were therefore supported as potential high flow
allocation regimes.
An analysis based on the Range of
Variability Approach (RVA) developed by Richter et al. (1997), investigated the
degree of hydrologic alteration between the naturalised and modelled flow
records.
The investigation highlighted
that it is essential to first establish the key river values that require
protection and identify the level of change to the natural flow regime or
degree of hydrologic alteration that must not be exceeded in order to maintain
and sustain the required protection of river values.
Until establishing the degree of
hydrologic alteration and the level of change to the natural flow regime that
will sustain and maintain the protection of key values for rivers in the Tukituki
Catchment, a conservative approach to selecting the most preferable allocation
methods from those modelled in this investigation was necessary. In terms of
hydrologic alteration, scenarios which produced the lowest average percentage
of hydrologic alteration (≤10%) were considered as potentially suitable
allocation methods.
Based on the results of the
hydrological and ecological analyses and the assessment of security of supply
to water users, the most suitable high flow allocation scenarios for each site
have been selected in terms of those which produced the least amount of change
to the natural flow regime (where the disturbance to the structure and function
of the riverine ecosystem is minimal) while providing a high flow allocation
with the greatest security of supply to water users.
The following table presents the
high flow allocation scenarios selected as the most suitable for each site:
The Selected High Flow Allocation Scenarios
The high flow allocation
scenarios modelled in this investigation are all based on a 50% flow share
approach. A flow sharing approach enables water to be abstracted from a river
whilst maintaining a level of flow variability in the river. The
practicalities of implementing high flow allocation methods based on a flow sharing
approach need to be carefully considered. One possible approach could be to
issue global/group water take consents to water user groups (instead of the
current allocation process which issues consents to individual water users)
whereby the abstraction is managed collectively by the group, employing
measures such as rationing and rostering to ensure abstraction complies with
any abstraction restrictions.
Before undertaking further
hydrological and ecological analyses on any alternative high flow allocation
methods, the regulatory tools that are currently available to implement and
manage high flow allocation need to be identified and assessed to ultimately
determine what type of high flow allocation methods can realistically be
implemented and managed effectively.
|
Tukituki River Catchment High Flow
Allocation Modelling Report
|
Attachment 1
|
table of contents
1 INTRODUCTION. 1
1.1 Background. 1
1.2 Investigation Objectives. 2
1.3 Previous Investigations. 2
1.4 Water Allocation. 3
1.5 Water Harvesting. 5
2 High Flow Allocation at Regional Councils. 7
3 RESOURCE MANAGEMENT Policy for THE Tukituki
CATCHMENT. 9
3.1 Regional Resource Management Plan. 9
3.1.1 Ecological
Instream Management Objectives. 9
3.1.2 Surface
Water Quantity Management Objectives. 10
4 Methodology. 13
5 Existing Tukituki Catchment Hydrology. 15
5.1 Site Details. 15
5.2 Hydrological Records. 16
5.3 Hydrological Statistics. 17
5.3.1 Tukipo
River at State Highway 50 - Naturalised Flow Statistics. 18
5.3.2 Tukituki
River at Tapairu Rd Naturalised Flow Statistics. 21
5.3.3 Waipawa
River at RDS Naturalised Flow Statistics. 24
5.3.4 Tukituki
River at Red Bridge Naturalised Flow Statistics. 27
6 High Flow Allocation Scenarios. 31
7 Hydrological Consideration of High Flow
Allocation Scenarios. 35
7.1 Comparison of Hydrological Statistics. 35
7.1.1 Tukipo
River at State Highway 50 Scenario Flow Statistics. 35
7.1.2 Tukituki
River at Tapairu Rd Scenario Flow Statistics. 37
7.1.3 Waipawa
River at RDS Scenario Flow Statistics. 39
7.1.4 Tukituki
River at Red Bridge Scenario Flow Statistics. 41
7.2 Availability of Water for Abstraction. 43
7.2.1 Abstraction
Rates and Volumes. 43
7.2.2 Security
of Supply. 46
7.2.2.1 Tukipo River at State Highway 50 Scenario Abstraction
Availability. 47
7.2.2.2 Tukituki River at Tapairu Rd Selected Scenario Abstraction
Availability. 49
7.2.2.3 Waipawa River at RDS Selected Scenario Abstraction
Availability. 51
7.2.2.4 Tukituki River at Red Bridge Selected Scenario Abstraction
Availability. 53
8 Ecological Consideration of Scenarios. 55
8.1 FRE3 Analysis. 55
8.1.1 Biological
Relevance. 55
8.1.2 Analysis
of Allocation Scenario FRE3 Values. 55
8.1.2.1 Tukipo River at State Highway 50 FRE3 Analysis. 57
8.1.2.2 Tukituki River at Tapairu Rd FRE3 Analysis. 58
8.1.2.3 Waipawa River at RDS FRE3 Analysis. 59
8.1.2.4 Tukituki River at Red Bridge FRE3 Analysis. 60
8.2 Analysis of Methods against Instream Flow
Requirements. 61
8.2.1 Flow
Variability. 61
8.2.2 Maintenance
of Water Quality. 62
8.2.3 Habitat
Requirements. 62
8.2.3.1 Instream Habitat Modelling in the Context of the Naturalised
Flow Regime. 62
8.2.3.2 Fish Passage. 62
9 Range of Variability Approach (RVA) 63
9.1 Overview.. 63
9.2 IHA Summary. 66
9.2.1 Tukipo
River at State Highway 50 IHA Summary. 67
9.2.2 Tukituki
River at Tapairu Rd IHA Summary. 69
9.2.3 Waipawa
River at RDS IHA Summary. 71
9.2.4 Tukituki
River at Red Bridge IHA Summary. 73
9.3 RVA Summary. 75
9.3.1 Tukipo
River at State Highway 50 RVA Summary. 77
9.3.2 Tukituki
River at Tapairu Rd RVA Summary. 78
9.3.3 Waipawa
River at RDS RVA Summary. 79
9.3.4 Tukituki
River at Red Bridge RVA Summary. 80
10 Discussion. 81
11 Conclusion. 83
12 Recommendations. 85
13 REFERENCES. 87
APPENDIX 1
APPENDIX 2
Table InDEX
Table 1 Tukituki Catchment Minimum Flows, Core Allocatable Volumes,
and Actual Core Allocation. 3
Table 2 High Flow Allocation - Regional Plan Summary. 7
Table 3 Site Details. 15
Table 4 Tukipo River at State Highway 50 Flow Records. 16
Table 5 Tukituki River at Tapairu Rd Flow Records. 16
Table 6 Waipawa River at RDS Flow Records. 16
Table 7 Tukituki River at Red Bridge Flow Records. 16
Table 8 Naturalised Flow Statistics 1969-2008. 17
Table 9 Tukipo River at State Highway 50 - Naturalised Flow
Statistics (l/s) 1970-2007. 18
Table 10 Tukipo River at State Highway 50 - FRE3
Occurrences in Naturalised Flow Record. 18
Table 11 Tukituki River at Tapairu Rd - Naturalised Flow Statistics
(l/s) 1970-2007. 21
Table 12 Tukituki River at Tapairu Rd - FRE3 Occurrences
in Naturalised Flow Record. 21
Table 13 Waipawa River at RDS - Naturalised Flow Statistics (l/s)
1970-2007. 24
Table 14 Waipawa River at RDS - FRE3 Occurrences in
Naturalised Flow Record. 24
Table 15 Tukituki River at Red Bridge - Naturalised Flow Statistics
(l/s) 1970-2007. 27
Table 16 Tukituki River at Red Bridge - FRE3 Occurrences
in Naturalised Flow Record. 27
Table 17 Tukipo River at State Highway 50 High Flow Allocation
Scenarios. 32
Table 18 Tukituki River at Tapairu Rd High Flow Allocation Scenarios. 33
Table 19 Waipawa River at RDS High Flow Allocation Scenarios. 33
Table 20 Tukituki River at Red Bridge High Flow Allocation Scenarios. 34
Table 21 Tukipo River at State Highway 50 Residual Flow Statistics
(l/s) for High Flow Allocation Scenarios (June - November) 35
Table 22 Tukituki River at Tapairu Rd Residual Flow Statistics (l/s)
for High Flow Allocation Scenarios (June - November) 37
Table 23 Waipawa River at RDS Residual Flow Statistics (l/s) for High
Flow Allocation Scenarios (June - November) 39
Table 24 Tukituki River at Red Bridge Residual Flow Statistics (l/s)
for High Flow Allocation Scenarios (June - November) 41
Table 25 Average Monthly Abstraction Provided by SH50 Scenarios. 44
Table 26 Average Monthly Abstraction Provided by Tapairu Rd Scenarios. 44
Table 27 Average Monthly Abstraction Provided by RDS Scenarios. 45
Table 28 Average Monthly Abstraction Provided by Red Br Scenarios. 45
Table 29 Abstraction Availability for SH50 Scenarios with 100l/s HFA
Cap. 47
Table 31 Abstraction Availability for SH50 Scenarios with 400l/s HFA
Cap. 47
Table 32 Abstraction Availability for Tapairu Rd Scenarios with
1000l/s HFA Cap. 49
Table 33 Abstraction Availability for Tapairu Rd Scenarios with
4000l/s HFA Cap. 50
Table 34 Abstraction Availability for RDS Scenarios with 1000l/s HFA
Cap. 51
Table 35 Abstraction Availability for RDS Scenarios with 4000l/s HFA
Cap. 51
Table 36 Abstraction Availability for Red Br Scenarios with 2000l/s
HFA Cap. 53
Table 37 Abstraction Availability for Red Br Scenarios with 8000l/s
HFA Cap. 54
Table 38 SH50 Scenario FRE3 Analysis Summary (June to
November, 1970-2007) 57
Table 39 Tapairu Rd Scenario FRE3 Analysis Summary (June
to November, 1970-2007) 58
Table 40 RDS Scenario FRE3 Analysis Summary (June to November,
1970-2007) 59
Table 41 Red Br Scenario FRE3 Analysis Summary (June to
November, 1970-2007) 60
Table 42 Summary of IHA Parameters and their Ecosystem Influences
(Harkness 20101) 65
Table 43 Tukipo River at State Highway 50 IHA Scorecard Summary. 68
Table 44 Tukituki River at Tapairu Rd IHA Scorecard Summary. 70
Table 45 Waipawa River at RDS IHA Scorecard Summary. 72
Table 46 Tukituki River at Red Bridge IHA Scorecard Summary. 74
Table 47 SH50 RVA Analysis Summary. 77
Table 48 Tapairu Rd RVA Analysis Summary. 78
Table 49 RDS RVA Analysis Summary. 79
Table 50 Red Br RVA Analysis Summary. 80
Table 51 Selected High Flow Allocation Scenarios. 84
figure INDEX
Figure 1 Idealised River Flow Allocation on a Flow Duration Curve. 4
Figure 2 Investigation Sites. 15
Figure 3 Tukipo River at State Highway 50 - Naturalised Flow
Hydrograph and FRE3 19
Figure 4 Tukipo River at State Highway 50 - Naturalised Flow Duration
Curves. 20
Figure 5 Tukituki River at Tapairu Rd - Naturalised Flow Hydrograph
and FRE3 22
Figure 6 Tukituki River at Tapairu Rd - Naturalised Flow Duration
Curve. 23
Figure 7 Waipawa River at RDS - Naturalised Flow Hydrograph and FRE3 25
Figure 8 Waipawa River at RDS - Naturalised Flow Duration Curve. 26
Figure 9 Tukituki River at Red Bridge - Naturalised Flow Hydrograph
and FRE3 28
Figure 10 Tukituki River at Red Bridge - Naturalised Flow Duration
Curve. 29
Figure 11 Flow Duration Curves for SH50 Naturalised and Modelled Flow
Records (June - November) 36
Figure 12 Zoomed View of Flow Duration Curves for SH50 Naturalised and
Modelled Flow Records (June - November) 36
Figure 13 Flow Duration Curves for Tapairu Rd Naturalised and Modelled
Flow Records (June - November) 38
Figure 14 Zoomed View of Flow Duration Curves for Tapairu Rd
Naturalised and Modelled Flow Records (June - November) 38
Figure 15 Flow Duration Curves for RDS Naturalised and Modelled Flow
Records (June - November) 40
Figure 16 Zoomed View of Flow Duration Curves for RDS Naturalised and
Modelled Flow Records (June - November) 40
Figure 17 Flow Duration Curves for Red Br Naturalised and Modelled
Flow Records (June - November) 42
Figure 18 Zoomed View of Flow Duration Curves for Red Br Naturalised
and Modelled Flow Records (June - November) 42
Figure 19 Abstraction Availability for SH50 Scenarios with 100l/s HFA
Cap. 47
Figure 20 Abstraction Availability for SH50 Scenarios with 400l/s HFA
Cap. 48
Figure 21 Abstraction Availability for Tapairu Rd Scenarios with
1000l/s HFA Cap. 49
Figure 22 Abstraction Availability for Tapairu Rd Scenarios with
4000l/s HFA Cap. 50
Figure 23 Abstraction Availability for RDS Scenarios with 1000l/s HFA
Cap. 51
Figure 24 Abstraction Availability for RDS Scenarios with 4000l/s HFA
Cap. 52
Figure 25 Abstraction Availability for Red Br Scenarios with 2000l/s
HFA Cap. 53
Figure 26 Abstraction Availability for Red Br Scenarios with 8000l/s
HFA Cap. 54
Figure 27 Percentage Change from SH50 Naturalised FRE3
Value for SH50 Allocation Scenarios. 57
Figure 28 Percentage Change from Tapairu Rd Naturalised FRE3
Value for Tapairu Rd Allocation Scenarios. 58
Figure 29 Percentage Change from RDS Naturalised FRE3 Value
for RDS Allocation Scenarios. 59
Figure 30 Percentage Change from Red Br Naturalised FRE3 Value
for Red Br Allocation Scenarios. 60
|
Tukituki River Catchment High Flow
Allocation Modelling Report
|
Attachment 1
|
1.1
|
Tukituki River Catchment High Flow
Allocation Modelling Report
|
Attachment 1
|
1 INTRODUCTION
1.1 Background
The Hawke’s Bay region is located
on the east coast of the North Island. The region is sheltered by the Kaweka
and Ruahine mountain ranges in the west which form part of the North Island’s
main chain of mountain ranges. The region is characterised by a warm dry
climate with regular long dry periods with low rainfall and river flow
conditions.
Water resources in Hawke’s Bay
are facing increasing abstractive pressure. Many catchments in the region are
now over allocated and the climate of eastern areas of New Zealand is expected
to become warmer and drier (IPCC, 2007). In light of this, the Hawke’s Bay
Regional Council (HBRC) is currently exploring different water management
options for the region.
The HBRC manages the region’s
water resources in accordance with the Regional Resource Management Plan (RRMP)
2006, and the Resource Management Act (RMA) 1991. Minimum flows[1] and core allocatable volumes[2] have been established on rivers (and streams) in
accordance with Objective 41 and Policies 73 and 74 of the RRMP to ensure
sufficient water is left in a river to help maintain identified river values
(e.g. cultural, ecological, economical and social).
During the regions frequent dry
hot summers, rivers regularly reach low flow conditions. When rivers are
flowing at or below their regulatory minimum flows, abstraction bans are issued
by the HBRC during which all consented abstraction is restricted.
One method used to mitigate the
interruption of water supply during periods of low flow conditions, reducing
the exposure to abstraction bans, is by sustainably harvesting and storing
water during periods when river flows are high for use during periods of
restricted abstraction or for river augmentation.
High flow allocation provides
access to water for abstractive use at times when river flows are high enough
to provide adequate instream habitat. High flow allocation is also referred to
in other regions as supplementary allocation or B/C block allocation. High
flow allocation is commonly provided to encourage water harvesting and storage
(Harkness 2008).
1.2
Investigation Objectives
To
assess the effect of different potential methods of water allocation during
high river flows within the winter and spring months of June to November, from
four established hydrological sites on rivers in the Tukituki Catchment:
▪ Tukipo River at State Highway 50
▪ Tukituki River at Tapairu Rd
▪ Waipawa River at RDS
▪ Tukituki River at Red Bridge
To
determine the suitability of the modelled range of potential high flow
allocation methods in terms of providing:
a) A sustainable flow (high
flow allocation threshold) above which high flow allocation could be made
available,
b) A sustainable allocation
limit (high flow allocation cap) which will allow for abstraction without
adversely impacting on flow variability and instream ecological requirements,
c) With the optimum security
of water supply for the most sustainable allocation methods.
The
most suitable methods for each site will be selected based on the results of
hydrological, ecological and security of water supply analyses.
1.3 Previous Investigations
Two reports on high flow
allocation modelling have previously been undertaken for the HBRC on the
Ngaruroro River by MWH (Harkness 2008 & 20101).
MWH completed an investigation
into potential high flow allocation from the Ngaruroro River during the May to
October period (Harkness 2008). This investigation presented an overview of
methods used by other Regional Councils and unitary authorities throughout New
Zealand and used these as guidance to develop sixteen potential high flow
allocation scenarios for the Ngaruroro River. These sixteen scenarios were
modelled and a range of hydrological and ecological analyses were undertaken
assessing the different scenarios in terms of effects on instream values. Four
scenarios were selected as preferred high flow allocation methods.
The HBRC commissioned MWH to undertake a second investigation (Harkness 20101) into the potential for high
flow allocation from the Ngaruroro River during the June to November months (as
opposed to May to October in the 2008 investigation due to recently lengthening
irrigation seasons). The four preferred high flow allocation scenarios from
Harkness (2008) were reanalysed as part of the 2010 investigation along with
four additional scenarios developed in consultation with HBRC.
The eight high flow allocation
scenarios were modelled to determine a sustainable flow above which high flow
allocation could be made available without adversely impacting on instream
ecology requirements and flow variability (Harkness 20101).
All eight of the 2010 scenarios
were identified under the methodology used, as having only minor effects on the
flow regime and ecology and were recommended as possible methods for setting
high flow allocation on the Ngaruroro River.
1.4
Water Allocation
Core allocation relates to the
water currently allocated from rivers (and streams) in Hawke’s Bay for out of
stream use.
Minimum flows and core
allocatable volumes have been established on rivers (and streams) throughout
Hawke’s Bay in accordance with the RRMP. These are presented in Table 9 of the
RRMP (Appendix 1).
Minimum flows and core allocation
volumes for the Tukituki catchment sites used in this investigation are
presented in Table 1.
Table 1 Tukituki
Catchment Minimum Flows, Core Allocatable Volumes, and Actual Core Allocation
Minimum flows
(l/s) are set on rivers to ensure sufficient water is
left in a river to maintain identified river values (e.g. cultural,
ecological, economical and social) during low flow conditions. Minimum flows
set in the RRMP for the Tukituki catchment are based on hydrological and
instream habitat assessments. These minimum flows have recently been reviewed
(Johnson 2011) and the results of which are expected to inform changes to the
next RRMP.
The core
allocatable volumes set in table 9 of the RRMP (Appendix 1) and presented in
Table 1, are defined as the difference between the summer 7-day Q95[3] and the minimum
flow. The core allocatable volume is also presented in Table 1 as an
allocatable rate in litres per second. The actual core allocated volumes and
rates relate to the total currently consented allocated volumes and rates for
each site as of November 2010.
On the basis
of allocatable volume (m3/wk), there is no over-allocation at the four sites
(the Tukipo River has no allocation assigned), however in terms of allocation
rate (l/s), Table 1 demonstrates over allocation at all sites.
Figure
1 Idealised River Flow Allocation on a Flow Duration Curve
A generalised picture of how high
flow allocation could be managed within existing water allocation practices is
presented in Figure 1.
There are a number of approaches
that have been adopted to set high flow allocation in New Zealand rivers
(summarised in Section 1) including the use of high flow allocation minimum
flows (thresholds), allocation blocks and implementing flow sharing
arrangements. Harkness (2008) explains that a high flow allocation minimum
flow is required so that water harvesting only occurs when river flow is above
this level. A flow sharing approach for high flow allocation (e.g. a 1:1 flow
share ratio where 50% of river flow is allocated for abstraction and 50%
remains in the river) would seek to maintain flow variability in the river and
not unduly impact on ecological values such as flushing or disturbance flows
that are essential to maintaining the instream ecosystem and channel structure
(Harkness 2008).
High flow allocation should
ideally occur during winter and spring when river flows are higher, so that
harvesting of flow has only a small proportionate effect on reducing river
flows (Harkness 2008).
1.5
Water Harvesting
Harkness (2008) describes water
harvesting as:
….the practice of diverting a portion of river flows
into a suitable storage for subsequent use during periods of reduced water
availability. This enables utilisation of the available water resources for
maximum productive benefit while reducing pressure on water resources during
period of limited availability.
Water harvesting can be carried out in various ways:
▪ Setting higher minimum
flows (above the core allocation) for category B or C water permits, where
users accept a lower priority and security of supply. This ensures category A
permits have access to the core allocation.
▪ Taking water during times
of higher river flow during the irrigation months.
▪ Diverting water to storage
over winter months, when demand is low and river flows are high, and to utilise
the stored water to meet irrigation demand during summer that could otherwise
not be met from the available flow allocation.
▪ Setting higher minimum
flows to allow water abstraction for frost protection purposes.
1
|
Tukituki River Catchment High Flow
Allocation Modelling Report
|
Attachment 1
|
1
|
Tukituki River Catchment High Flow
Allocation Modelling Report
|
Attachment 1
|
2 High Flow
Allocation at Regional Councils
Harkness (2008)
undertook a comprehensive review of all regional council and unitary authority
planning documents with reference to high flow or supplementary surface water
allocation.
The existing
relevant high flow or supplementary allocation methods adopted by eight
councils across New Zealand are summarised in the following table (Harkness 2008).
Table 2 High
Flow Allocation - Regional Plan Summary
1
|
Tukituki River Catchment High Flow
Allocation Modelling Report
|
Attachment 1
|
1
|
Tukituki River Catchment High Flow
Allocation Modelling Report
|
Attachment 1
|
3 RESOURCE
MANAGEMENT Policy for THE Tukituki CATCHMENT
3.1 Regional Resource Management Plan
The Hawke’s Bay Regional Resource
Management Plan (RRMP) which was made operative in 2006 sets out a policy
framework for managing resource use activities across the region.
3.1.1 Ecological Instream Management
Objectives
The following objectives and
policies in the RRMP are relevant to the Tukipo, Tukituki and Waipawa Rivers in
terms of seeking to sustain, maintain or improve the existing aquatic
ecosystems.
Objective 25: Surface
Water Quantity
The maintenance of water
quantity of the rivers and lakes in order that it is suitable for sustaining
aquatic ecosystems in catchments as a whole….while recognising the impact
caused by climatic fluctuations in Hawke’s Bay.
Objective 27: Surface
Water Quality
The maintenance or enhancement
of the water quality of rivers, lakes and wetlands in order that it is suitable
for sustaining or improving aquatic ecosystems in catchments as a whole…
Objective 40: Surface
Water Quantity
The maintenance of the water
quality of specific rivers in order that the existing species and natural
character are sustained…
Policy 71: Environmental
Guidelines – Surface Water Quality
To manage the effects of
activities affecting the quality of water in rivers…in accordance with the
environmental guidelines set out below in Table 7 of the RRMP.
Table 7 of the RRMP – Surface
Water Quality Guidelines
Note:
* Upstream of Fernhill Bridge;
**
Between Fernhill Bridge and Expressway Bridge;
***
Downstream of Expressway Bridge.
Objective 41: Surface
Water Quantity
The maintenance of water
quantity of specific rivers in order that the existing aquatic species and the
natural character are sustained…
3.1.2
Surface Water Quantity Management Objectives
The
following objectives and policies in the RRMP are relevant to the Tukipo,
Tukituki and Waipawa Rivers in terms of the management and use of surface
water.
Objective
25: Surface Water Quantity
The
maintenance of the water quantity of the rivers and lakes in order that it is
suitable for sustaining aquatic ecosystems in catchments as a whole and
ensuring resource availability for a variety of purposes across the region,
while recognising the impact caused by climatic fluctuations in Hawke's Bay.
Objective
26: Surface Water Quantity
The avoidance
of any significant adverse effects of water takes, uses, damming or diversion
on lawfully established activities in surface water bodies.
“The demand for
water in the Hawke’s Bay region is rising, particularly as a result of
increasing crop and pasture irrigation. Inefficient use of water exacerbates
problems during summer droughts. The demand for surface water needs to be
managed in a manner which ensures that water availability is maintained and
water is allocated fairly, the impact of droughts is minimised, and economic
development is not unnecessarily curtailed.” (Harkness 20101)
Policy
34: Role of Non-Regulatory Methods
Education and
co-ordination for encouraging efficient use of water, for example water
harvesting, use of storage and consideration of alternative water supply, and
avoiding wastage of water.
Policy
35: Regulation – Water Allocation
a) To manage the taking
of water where the effects of that take may be more than minor.
b) To manage the
cumulative adverse effects of small takes, particularly in catchments:
i) that are located in
an area of low annual rainfall
ii) where the geology has
a low storage capacity
iii) for which the
location is such that there is a high potential for increased use
Policy 35 manages and controls
water takes through the resource consent process.
Policy
37: Resource Allocation – Minimum Flows and Allocatable Volumes
a) To manage takes from
those rivers listed in Table 9 of this Plan in accordance with the minimum
flows and associated allocatable volumes set out in that table.
b) To establish minimum
flows and allocatable volumes for additional rivers in accordance with the
approach set out in Table 9 or as a result of research demonstrating that lower
minimum flows or higher allocatable volumes are sustainable. Council will use
the Plan Change procedure of the First Schedule of the RMA to introduce or
change these.
c) To ensure the
protection of aquifer recharge from the effects of minimum flows.
Policy 37 establishes that takes
from rivers will be managed in accordance with prescribed minimum flows and
upper minimum flows and allocable volumes (Harkness 20101).
Policy 39:
Decision Making Criteria – Water Allocation
To allocate water from rivers
in accordance with the following approach:
a) The water requirement
for each resource consent applicant will be determined on the basis of
reasonable needs and the efficiency of end use, requiring an applicant to
determine how much water is required for their activity (for irrigation takes,
see also Policy 42).
b) Where the demand for water within a stream
management zone11 is greater than the allocatable volume as a result of a consent
application for a new activity, a consent will not be issued except where it
can be considered under d).
c) Where
the demand for water within a stream management zone is greater than the
allocatable volume as a result of a change to the minimum flow for that stream
management zone the HBRC will adopt any or all of the following approaches:
i) Review all consented
takes from that water body at the same time.
ii) Give preference to
the renewal of existing resource consents, over the granting of new consents
where it can be demonstrated that the allocation is still required.
iii) To encourage the
establishment of user groups or the seasonal or long-term transfer of water
permits in accordance with Policy 34.
iv) Where over-allocation
still exists, to reduce the allocation on a pro-rata basis except that where
the consent holder has been advised (e.g. in the consent document) that the
water allocated may no longer be available for allocation at the time of
consent renewal, in which case the consent may not be renewed.
v) To encourage the use
of alternative water sources.
d) Water may be allocated
over and above the allocatable volume, subject to a substantially higher
cut-off level than that specified in Table 9 provided that any such additional
allocations will not have any adverse effect on other lawfully established
activities, nor any other significant adverse environmental effect and assuming
allocation is subject to the implementation and/or consideration of (a), (b)
and (c).
Harkness (20101)
identified that Policy 39 establishes the overall approach for the allocation
of surface water. This policy recognises that the type of water management
required for the region’s surface water bodies is variable. As such, Policy 39
sets out that HBRC can allow for periods when water can be allocated over the
allocatable volumes (e.g. for water harvesting purposes). The ecological
protection of the river, including the maintenance of a natural “flushing”
effect is the baseline consideration for any allocations which are made under
this scenario.
Objective 41: Surface Water Quantity
The maintenance of the water
quantity of specific rivers in order that the existing aquatic species and the
natural character are sustained, while providing for resource availability for
a variety of purposes, including groundwater recharge
Policy 73: Environmental
Guidelines – Surface Water Quantity
a) To sustain aquatic
ecosystems by establishing a minimum flow in a river as that level which will
maintain the existing ecosystem.
Policy 74: Implementation
of Environmental Guidelines – Surface Water Quantity
a) Resource Allocation:
To define the allocatable volume as being the difference between the summer 7-
day Q95 and the minimum flow.
|
Tukituki River Catchment High Flow
Allocation Modelling Report
|
Attachment 1
|
1
|
Tukituki River Catchment High Flow
Allocation Modelling Report
|
Attachment 1
|
4 Methodology
A
range of high flow allocation scenarios have been modelled on flow records at four sites within the Tukituki
catchment. A number of analyses were undertaken to assess the suitability of
the potential high flow allocation methods in terms of providing a sustainable
flow (high flow allocation threshold) above which high flow allocation could be
made available and a sustainable allocation limit (high flow allocation cap)
which will allow for abstraction without adversely impacting on flow
variability and instream ecological requirements.
The work undertaken in this
investigation uses the methodology developed by Harkness (2008 & 20101)
in which high flow allocation modelling work was undertaken on the Ngaruroro
River.
The following outlines the key
stages in this investigation:
1) Derive and analyse a range of key hydrological statistics from
naturalised flow records (produced by MWH (Harkness 20102) for the
HBRC) for each of the four Tukituki catchment sites.
2) Develop a range of high flow allocation scenarios to be modelled
3) Using the naturalised flow records, model the range of scenarios
developed for each site to produce modified synthetic flow records
4) Derive key hydrological statistics from the modified flow records
and compare to the original naturalised statistics
5) Assess the availability of water for abstraction provided by each
high flow allocation scenario modelled
6) Undertake ecological analyses comparing naturalised flow records
to the modified flow records
7) Undertake a Range of Variability Approach (RVA) analysis to
assess the degree of hydrologic alteration between the modified records and the
naturalised records
|
Tukituki River Catchment High Flow
Allocation Modelling Report
|
Attachment 1
|
1
|
Tukituki River Catchment High Flow
Allocation Modelling Report
|
Attachment 1
|
5 Existing
Tukituki Catchment Hydrology
5.1 Site Details
The Hawke’s Bay Regional Council
(HBRC) operates a number of hydrological sites in the Tukituki catchment. The
locations of the four sites within the Tukituki catchment that are used in this
investigation are shown in Figure 2 with Table 3 providing some additional site details.
Figure 2 Investigation
Sites
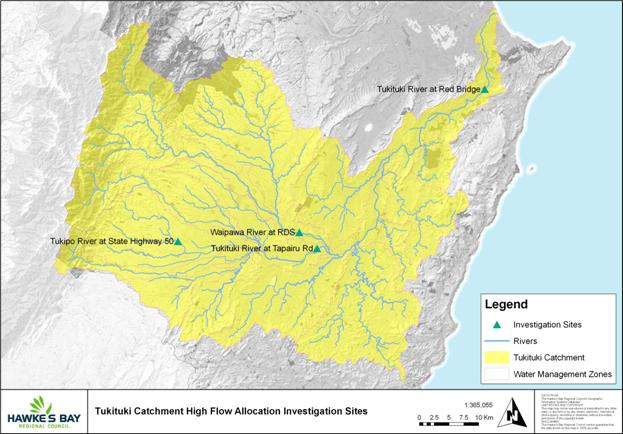
Table 3 Site
Details
5.2
Hydrological Records
Each site has a long-term rated
flow record and a naturalised flow record which are detailed in the following
tables.
Naturalised flow records were
produced by Harkness (20102) for a number of
sites in the Hawke’s Bay region. Naturalised flow records represent the
natural river flow before any abstractions or discharges occur.
Table 4 Tukipo River at State Highway 50
Flow Records
Table 5 Tukituki River at Tapairu Rd
Flow Records

Table 6 Waipawa River at RDS Flow Records
Table 7 Tukituki River at Red Bridge
Flow Records

The naturalised flow records for
the four sites are used for all modelling and analyses in this investigation
5.3
Hydrological Statistics
A range of hydrological
statistics have been calculated from the naturalised flow record for each
site. Table 8 presents key statistics calculated from
the full available naturalised records.
Table 8 Naturalised
Flow Statistics 1969-2008
Note: MALF calculated as
Jul-Jun 7 Day Moving Average, FRE3 = 3 x median flow
Hydrological statistics have been
calculated to describe the variability of each flow record. Flow variability
(i.e. the frequency, intensity and duration of flows) is important in the
assessment of instream flow regimes (MfE 1998). The modelling undertaken as
part of this investigation (detailed in later sections of this report) uses the
naturalised record from 01-Jan-1970 to 31-Dec-2007, a total of 30 years of
record.
Statistics have been calculated
for the June to November months (which represent the winter and spring months)
and for the full record between 1970 and 2007. The statistics are presented
for each site in Sections 5.3.1 to 5.3.4. After modelling various high flow
allocation scenarios (detailed in Section 1), these statistics are recalculated
and compared to the naturalised statistics (Section 7.1).
A method of describing the
frequency that river biota are disturbed by flood flows is to calculate the FRE3,
which is the number of times per year the flow exceeds three times the median
flow (Harkness 20101).
The occurrence and frequency of
FRE3 flows in the naturalised records are presented in Sections
5.3.1 to 5.3.4. FRE3 values are presented on an annual basis for
the June to November period and the entire year (January to December). Further
analyses of FRE3 flows and comparisons between naturalised and
modelled flow records are detailed in Section 8.1.
The Q95 flow value is that which
is exceeded 95% of the time. Similarly the Q80 and Q90 are the flows that are
exceeded 80% and 90% of the time, respectively.
Naturalised flow hydrographs and
flow duration curves (which represent the percentage of time any given flow is
equalled or exceeded in a flow record) for each site are also presented in
Sections 5.3.1 to 5.3.4.
5.3.1
Tukipo River at State Highway 50 - Naturalised Flow
Statistics
Table 9 Tukipo River at State Highway 50
- Naturalised Flow Statistics (l/s) 1970-2007

The river flow statistics
calculated for the June to November months are as expected, mostly higher than
those for the full record with the exception of the Q95.
Table 10 Tukipo
River at State Highway 50 - FRE3 Occurrences in Naturalised Flow
Record

The naturalised record shows a
large proportion of FRE3 events (approximately 65%) occur during the
June to November months. The June to November months show an average of 8
events per year compared to 12 for the full year. The average frequency of FRE3
flows during June to November is one occurrence every 24 days. In comparison
the average frequency of FRE3 flows for the full year reduces to one
occurrence every 30 days.
The hydrograph in Figure 3 plots the naturalised flow record (1970-2007) for
Tukipo River at State Highway 50 (with June to November months are highlighted
in red) and the FRE3 flow calculated for the site. It is clear from
the hydrograph and Table 10 that FRE3 events
are most frequent during the June to November months.
Figure 3 Tukipo
River at State Highway 50 - Naturalised Flow Hydrograph and FRE3
The naturalised flow duration for
the Tukipo River at State Highway 50 over all months from January to December
(black curve) is compared with the periods, June to November (blue curve) and
December to May (red curve) in Figure 4.
The percentage of time spent at
or above any given flow is highest during the June to November period
representing the winter/spring months. During the summer/autumn months of
December to May, the greatest percentage of time is spent at lower river flows.
Figure 4 Tukipo
River at State Highway 50 - Naturalised Flow Duration Curves
5.3.2
Tukituki River at Tapairu Rd Naturalised Flow Statistics
Table 11 Tukituki River at Tapairu Rd -
Naturalised Flow Statistics (l/s) 1970-2007

The river flow statistics
calculated for the June to November months are as expected, mostly higher than
those for the full record with the exception of the maximum and Q95.
Table 12 Tukituki
River at Tapairu Rd - FRE3 Occurrences in Naturalised Flow Record

The naturalised record shows a
large proportion of FRE3 events (approximately 65%) occur during the
June to November months. The June to November months show an average of 7
events per year compared to 10 for the full year. The average frequency of FRE3
flows during June to November is one occurrence every 27 days. In comparison
the average frequency of FRE3 flows for the full year reduces to one
occurrence every 35 days.
The hydrograph in Figure 5 plots the naturalised flow record (1970-2007) for
Tukituki River at Tapairu Rd (with June to November months are highlighted in
red) and the FRE3 flow calculated for the site. It is clear from
the hydrograph and Table 12 that FRE3 events
are most frequent during the June to November months.
Figure 5 Tukituki
River at Tapairu Rd - Naturalised Flow Hydrograph and FRE3
The naturalised flow duration for
the Tukituki River at Tapairu Rd over all months from January to December
(black curve) is compared with the periods, June to November (blue curve) and
December to May (red curve) in Figure 6.
The percentage of time spent at
or above any given flow is highest during the June to November period
representing the winter/spring months. During the summer/autumn months of
December to May, the greatest percentage of time is spent at lower river flows.
Figure 6 Tukituki
River at Tapairu Rd - Naturalised Flow Duration Curve
5.3.3
Waipawa River at RDS Naturalised Flow Statistics
Table 13 Waipawa River at RDS -
Naturalised Flow Statistics (l/s) 1970-2007
The river flow statistics
calculated for the June to November months are as expected, mostly higher than
those for the full record with the exception of the maximum and Q95.
Table 14 Waipawa
River at RDS - FRE3 Occurrences in Naturalised Flow Record
The naturalised record shows the
majority of FRE3 events (approximately 60%) occur during the June to
November months. The June to November months show an average of 5 events per
year compared to 9 for the full year. The average frequency of FRE3
flows during June to November is one occurrence every 34 days. In comparison
the average frequency of FRE3 flows for the full year reduces to one
occurrence every 42 days.
The hydrograph in Figure 7 plots the naturalised flow record (1970-2007) for
Waipawa River at RDS (with June to November months are highlighted in red) and
the FRE3 flow calculated for the site. It is clear from the
hydrograph and Table 14 that FRE3 events are
most frequent during the June to November months.
Figure 7 Waipawa
River at RDS - Naturalised Flow Hydrograph and FRE3
The naturalised flow duration for
the Waipawa River at RDS over all months from January to December (black curve)
is compared with the periods, June to November (blue curve) and December to May
(red curve) in Figure 8.
The percentage of time spent at
or above any given flow is highest during the June to November period
representing the winter/spring months. During the summer/autumn months of
December to May, the greatest percentage of time is spent at lower river flows.
Figure 8 Waipawa
River at RDS - Naturalised Flow Duration Curve
5.3.4
Tukituki River at Red Bridge Naturalised Flow
Statistics
Table 15 Tukituki River at Red Bridge -
Naturalised Flow Statistics (l/s) 1970-2007

The river flow statistics
calculated for the June to November months are as expected, mostly higher than
those for the full record.
Table 16 Tukituki
River at Red Bridge - FRE3 Occurrences in Naturalised Flow Record

The naturalised record shows a
large proportion of FRE3 events (approximately 70%) occur during the
June to November months. The June to November months show an average of 7
events per year compared to 10 for the full year. The average frequency of FRE3
flows during June to November is one occurrence every 26 days. In comparison
the average frequency of FRE3 flows for the full year reduces to one
occurrence every 35 days.
The hydrograph in Figure 9 plots the naturalised flow record (1970-2007) for
Tukituki River at Red Bridge (with June to November months are highlighted in
red) and the FRE3 flow calculated for the site. It is clear from
the hydrograph and Table 16 that FRE3 events
are most frequent during the June to November months.
Figure 9 Tukituki
River at Red Bridge - Naturalised Flow Hydrograph and FRE3
The naturalised flow duration for
the Tukituki River at Red Bridge over all months from January to December
(black curve) is compared with the periods, June to November (blue curve) and
December to May (red curve) in Figure 10.
The percentage of time spent at
or above any given flow is highest during the June to November period
representing the winter/spring months. During the summer/autumn months of
December to May, the greatest percentage of time is spent at lower river flows.
Figure 10 Tukituki
River at Red Bridge - Naturalised Flow Duration Curve
1
|
Tukituki River Catchment High Flow
Allocation Modelling Report
|
Attachment 1
|
1
|
Tukituki River Catchment High Flow
Allocation Modelling Report
|
Attachment 1
|
6 High Flow Allocation
Scenarios
A number of high flow allocation
scenarios were developed for modelling work on the Ngaruroro River by Harkness
(2008). After completing a review of the methods used by other regional
councils and unitary authorities throughout New Zealand, only three councils
(Horizons Regional Council, Marlborough District Council and Otago Regional
Council) were identified as having adopted specific high flow allocation
methods within their regional plans.
The three methods already in use
by councils made up the first three allocation scenarios out of sixteen
scenarios developed by Harkness (2008). The other scenarios developed were
based on variations of these with different high flow allocation thresholds and
allocatable volumes. All sixteen scenarios only allowed water to be available
for abstraction during the May to October period; the winter and spring months
when river flows are typically higher.
The high flow allocation
thresholds were based on long-term mean or median flows which act as a threshold
flow above which water can be allocated for abstraction. The scenarios
combined high flow allocation thresholds with a range of maximum abstraction
caps (high flow allocation caps). The reason for incorporating maximum
abstraction caps is explained in the excerpt from Harkness (20101):
….modelling the scenarios without a maximum
abstraction cap allowed for very large abstractions during flood events. The
modelling process would assume that all allocation was abstracted which
resulted in a residual river flow with flood peaks and freshes dramatically
diminished. This is unrealistic, not only because of the sheer volume modelled
as being abstracted, but also because in many high river flow events the water
becomes very turbid and silt laden and this becomes a physical limitation on
water harvesting. Sediment laden water has adverse effects on pumping
equipment and can lead to sediment deposition behind dams if diverted there.
The sixteen scenarios were
modelled using the Ngaruroro River at Fernhill naturalised flow record to
assess the impacts that different potential allocation methods would have on
the river. Four scenarios with a mean high flow allocation threshold (HFA
threshold) were selected as preferred high flow allocation methods.
Harkness (20101)
undertook further high flow allocation modelling work using the June to
November period instead of May to October used in the 2008 investigation due to
recently lengthening irrigation seasons. The four preferred methods from
Harkness (2008) which used a HFA threshold set as the long-term mean were
adopted for re-modelling in this second investigation and an additional four
scenarios incorporating HFA thresholds set at the long-term median flow were
also included.
All eight of the 2010 scenarios
were identified as having only minor effects on the flow regime and ecology and
were recommended as possible methods for setting high flow allocation on the
Ngaruroro River. Harkness (20101) suggested it came down to a
preference of what quantity of water should be made available for allocation.
These eight high flow allocation
scenarios have been adopted and adapted for modelling high flow allocation in
the Tukituki River catchment.
For each site, the range of
scenarios use HFA thresholds set as either mean or median flow (derived from
the full naturalised flow record for each site - presented in Section 5.3),
with either of two selected high flow allocation caps (HFA caps) for each
site. A flow sharing approach has been used in all scenarios where either 50%
or 33% of flow above the HFA threshold up to the HFA cap is allocated for
abstraction, with the rest (50% or 67% respectively) remaining in the river.
The HFA caps selected for the
Ngaruroro scenarios were 2000l/s and 5000l/s. Although these were essentially
arbitrary figures the lower cap was close to the existing Ngaruroro River at
Fernhill RRMP core allocatable rate of 1581l/s (956189m3/wk).
HFA caps were developed for the
Tukituki catchment sites by comparing the naturalised flow regimes for the
Ngaruroro and each Tukituki site in terms of key flow statistics including for
example; the mean and FRE3 flows. The ratio between the Ngaruroro HFA caps and
the Ngaruroro key flow statistics were analysed and allocation limits for the
Tukituki sites were derived based on equivalent proportions.
Given that the Harkness (20101)
investigation found that even scenarios with the higher HFA cap of 5000l/s had
only minor effects on the flow regime and ecology, it was decided that the
highest HFA caps for the Tukituki sites be set at higher levels equating to
twice the 5000l/s cap for the Ngaruroro.
The work resulted in two HFA caps
being set for each site. Further analysis was undertaken comparing the
proposed HFA caps to current core allocated rates (Table 1 in Section 1.4).
The lower HFA caps for all sites except the Tukipo River at State Highway 50
(which has a very low allocated rate of 13l/s) were close to the core
allocation (an average between the three Tukituki and Waipawa River sites of
110% of core allocation).
The scenarios developed for each
site are presented in the following tables.
Table 17 Tukipo River at State Highway 50
High Flow Allocation Scenarios

Note:
Median and mean are from entire period of flow record
Table 18 Tukituki River at Tapairu Rd High
Flow Allocation Scenarios
Note:
Median and mean are from entire period of flow record
Table 19 Waipawa River at RDS High Flow
Allocation Scenarios

Note:
Median and mean are from entire period of flow record
Table 20 Tukituki River at Red Bridge High
Flow Allocation Scenarios

Note:
Median and mean are from entire period of flow record
|
Tukituki River Catchment High Flow Allocation Modelling Report
|
Attachment 1
|
7 Hydrological
Consideration of High Flow Allocation Scenarios
7.1 Comparison of Hydrological Statistics
For each scenario, flow statistics
and flow duration curves for the naturalised and modified flow records are
compared in Sections 7.1.1 to 7.1.4. All results presented are for the June to
November months between 1970 and 2007 (inclusive).
The magnitude of change as a
percentage (% ∆) of the naturalised flow record is presented for the
median, mean and maximum values for each scenario.
7.1.1 Tukipo River at State Highway 50
Scenario Flow Statistics
Table 21 Tukipo
River at State Highway 50 Residual Flow Statistics (l/s) for High Flow Allocation
Scenarios (June - November)
There are only minor changes to
the low flow statistics (Minimum, Q80, Q90, Q95) and the maximum flow between
the naturalised and modified flow records shown in Table 21.
SH50 scenarios 1 to 4 lower the
median flow by less than 1% with scenario 6 showing the greatest change,
lowering the median by 14.12%. Scenario SH50 6 also shows the greatest change
to the mean flow (-9.72%).
All scenarios with the higher HFA
cap of 400l/s (SH50 2, 4, 6 and 8) show slightly greater change to the median,
mean and maximum flows.
The flow duration curves for the
naturalised and modified SH50 flow records with the FRE3 value
over-plotted are compared in Figure 11.
A closer view of the 5% to 65%
range where most of the variation away from the original naturalised flow data
occurs is provided in Figure 12.
Figure 11 Flow
Duration Curves for SH50 Naturalised and Modelled Flow Records (June -
November)
Figure 12 Zoomed
View of Flow Duration Curves for SH50 Naturalised and Modelled Flow Records
(June - November)
7.1.2
Tukituki River at Tapairu Rd Scenario Flow Statistics
Table 22 Tukituki
River at Tapairu Rd Residual Flow Statistics (l/s) for High Flow Allocation
Scenarios (June - November)
There are only minor changes to
the low flow statistics (Minimum, Q80, Q90, Q95) and the maximum flow between
the naturalised and modified flow records shown in Table 22.
Tapairu Rd scenarios 1 to 4 lower
the median flow by less than 1% with scenario 6 showing the greatest change,
lowering the median by 12.74%. Scenario Tapairu Rd 6 also shows the greatest
change to the mean flow (-9.64%).
All scenarios with the higher HFA
cap of 4000l/s (Tapairu Rd 2, 4, 6 and 8) show slightly greater change to the
median, mean and maximum flows.
The flow duration curves for the
naturalised and modified Tapairu Rd flow records with the FRE3 value
over-plotted are compared in Figure 13.
A closer view of the 5% to 75%
range where most of the variation away from the original naturalised flow data
occurs is provided in Figure 14.
Figure 13 Flow
Duration Curves for Tapairu Rd Naturalised and Modelled Flow Records (June -
November)
Figure 14 Zoomed
View of Flow Duration Curves for Tapairu Rd Naturalised and Modelled Flow
Records (June - November)
7.1.3
Waipawa River at RDS Scenario Flow Statistics
Table 23 Waipawa
River at RDS Residual Flow Statistics (l/s) for High Flow Allocation Scenarios
(June - November)
There are only minor changes to
the low flow statistics (Minimum, Q80, Q90, Q95) and the maximum flow between
the naturalised and modified flow records shown in Table 23.
RDS scenarios 1 to 4 lower the
median flow by less than 1% with scenario 6 showing the greatest change,
lowering the median by 10.71%. Scenario RDS 6 also shows the greatest change
to the mean flow (-9.32%).
All scenarios with the higher HFA
cap of 4000l/s (RDS 2, 4, 6 and 8) show slightly greater change to the median,
mean and maximum flows.
The flow duration curves for the
naturalised and modified RDS flow records with the FRE3 value
over-plotted are compared in Figure 15.
A closer view of the 5% to 65%
range where most of the variation away from the original naturalised flow data
occurs is provided in Figure 16.
Figure 15 Flow
Duration Curves for RDS Naturalised and Modelled Flow Records (June - November)
Figure 16 Zoomed
View of Flow Duration Curves for RDS Naturalised and Modelled Flow Records
(June - November)
7.1.4
Tukituki River at Red Bridge Scenario Flow Statistics
Table 24 Tukituki
River at Red Bridge Residual Flow Statistics (l/s) for High Flow Allocation
Scenarios (June - November)
There are only minor changes to
the low flow statistics (Minimum, Q80, Q90, Q95) and the maximum flow between
the naturalised and modified flow records shown in Table 24.
Red Br scenarios 1 to 4 lower the
median flow by less than 1% with scenario 6 showing the greatest change,
lowering the median by 17.50%. Scenario Red Br 6 also shows the greatest
change to the mean flow (-7.54%).
All scenarios with the higher HFA
cap of 8000l/s (Red Br 2, 4, 6 and 8) so slightly greater change to the median,
mean and maximum flows.
The flow duration curves for the
naturalised and modified SH50 flow records with the FRE3 value
over-plotted are compared in Figure 17.
A closer view of the 5% to 75%
range where most of the variation away from the original naturalised flow data
occurs is provided in Figure 18.
Figure 17 Flow
Duration Curves for Red Br Naturalised and Modelled Flow Records (June -
November)
Figure 18 Zoomed
View of Flow Duration Curves for Red Br Naturalised and Modelled Flow Records
(June - November)
7.2
Availability of Water for Abstraction
All high flow allocation
scenarios incorporate high flow allocation caps (HFA caps) which are designed
to limit the potential high flow abstraction from a river so as not to adversely impact on flow variability and
instream ecological requirements. HFA caps represent the maximum
potential abstraction provided under each scenario. The availability of this
potential abstraction depends on the duration and magnitude of high river
flows.
7.2.1 Abstraction
Rates and Volumes
Average monthly abstraction rates
and volumes provided by the range of high flow allocation scenarios for each
site are presented in Table 25 to Table 28.
Average monthly abstraction data
can be used as an estimate of future available abstraction rates provided under
each high flow allocation scenario and enables future estimates of dam/storage
fill times to be calculated.
|
Tukituki River Catchment High Flow Allocation Modelling Report
|
Attachment 1
|
|
Table 25 Average Monthly
Abstraction Provided by SH50 Scenarios
|

|
Table 26 Average Monthly Abstraction
Provided by Tapairu Rd Scenarios
|
|
|
Table 27 Average
Monthly Abstraction Provided by RDS Scenarios
|
|
Table 28 Average
Monthly Abstraction Provided by Red Br Scenarios
|

|
|
Tukituki River Catchment High Flow
Allocation Modelling Report
|
Attachment 1
|
7.2.2 Security
of Supply
In addition to understanding the
volume of water made available under each allocation scenario, it is also
critical to assess the proportion of time the allocated water provided by each
scenario is likely to be available for abstraction. Only when river flows are
above the high flow allocation thresholds (HFA thresholds) set in each scenario
is water allowed to be abstracted. Conversely when river flows are below the
HFA threshold, high flow abstraction is restricted.
The range of scenarios modelled
on each site use HFA thresholds set as either mean or median flow, above which
water is made available for abstraction. Scenarios incorporate one of two
selected HFA caps for each site (to limit the total abstraction from the river)
and either 50% or 33% of flow above the HFA threshold (up to the HFA cap) is
allocated for abstraction. The total water allocated for abstraction by each
scenario is limited by the HFA cap.
Using naturalised flow duration
curves produced for the June to November period for each site (presented in
Section 5.3), the potential security of supply provided by each high flow
allocation scenario has been assessed in terms of the percentage of time water
is available for abstraction. The greater proportion of time water is
available for abstraction the greater the security of supply to water users.
The following sections identify
the percentage of time river flows are above the HFA thresholds (above which
abstraction can begin), the percentage of time 50% of the total allocation is
available for abstraction and the percentage of time 100% of the total
allocation is available for abstraction.
7.2.2.1
Tukipo River at State Highway 50 Scenario Abstraction Availability
The SH50 statistics presented in
Table 29 and Table 30 show that river flows are above the median flow HFA
threshold for a greater percentage of time than the mean flow HFA threshold.
Comparing the abstraction
availability for scenarios with the lower HFA cap of 100l/s (Table 29 and
Figure 19) shows that SH50 scenarios 5 and 7 with median flow HFA thresholds,
provide 50% and 100% of allocation for abstraction for the greatest percentage
of time.
Table 29 Abstraction
Availability for SH50 Scenarios with 100l/s HFA Cap
Figure 19 Abstraction
Availability for SH50 Scenarios with 100l/s HFA Cap
Comparing the abstraction
availability for scenarios with the higher HFA cap of 400l/s (Table 30 and
Figure 20) shows that SH50 scenarios 6 and 8 with median flow HFA thresholds,
provide 50% and 100% of allocation for abstraction for the greatest percentage
of time.
Table 30 Abstraction
Availability for SH50 Scenarios with 400l/s HFA Cap
Figure 20 Abstraction
Availability for SH50 Scenarios with 400l/s HFA Cap
The scenario that provides the
highest security of supply in terms of greatest percentage of time above its
HFA threshold and greatest abstraction availability is scenario SH50 5 which
with a median flow HFA threshold, provides 50% and 100% of allocation for
abstraction more than 61% and 56% of the time respectively.
7.2.2.2
Tukituki River at Tapairu Rd Selected Scenario Abstraction Availability
The Tapairu Rd statistics
presented in Table 31 and Table 32 show that river flows are above the median
flow HFA threshold for a greater percentage of time than the mean flow HFA
threshold.
Comparing the abstraction
availability for scenarios with the lower HFA cap of 1000l/s (Table 31 and
Figure 21) shows that Tapairu Rd scenarios 5 and 7 with median flow HFA
thresholds, provide 50% and 100% of allocation for abstraction for the greatest
percentage of time.
Table 31 Abstraction Availability for
Tapairu Rd Scenarios with 1000l/s HFA Cap
Figure 21 Abstraction
Availability for Tapairu Rd Scenarios with 1000l/s HFA Cap
Comparing the abstraction availability
for scenarios with the higher HFA cap of 4000l/s (Table 32 and Figure 22) shows
that Tapairu Rd scenarios 6 and 8 with median flow HFA thresholds, provide 50%
and 100% of allocation for abstraction for the greatest percentage of time.
Table 32 Abstraction Availability for
Tapairu Rd Scenarios with 4000l/s HFA Cap

Figure 22 Abstraction
Availability for Tapairu Rd Scenarios with 4000l/s HFA Cap
The scenario that provides the
highest security of supply in terms of greatest percentage of time above its
HFA threshold and greatest abstraction availability is scenario Tapairu Rd 5
which with a median flow HFA threshold, provides 50% and 100% of allocation for
abstraction more than 62% and 57% of the time respectively.
7.2.2.3
Waipawa River at RDS Selected Scenario Abstraction Availability
The RDS statistics presented in
Table 33 and Table 34 show that river flows are above the median flow HFA
threshold for a greater percentage of time than the mean flow HFA threshold.
Comparing the abstraction
availability for scenarios with the lower HFA cap of 1000l/s (Table 33 and
Figure 23) shows that RDS scenarios 5 and 7 with median flow HFA thresholds,
provide 50% and 100% of allocation for abstraction for the greatest percentage
of time.
Table 33 Abstraction
Availability for RDS Scenarios with 1000l/s HFA Cap

Figure 23 Abstraction
Availability for RDS Scenarios with 1000l/s HFA Cap
Comparing the abstraction
availability for scenarios with the higher HFA cap of 4000l/s (Table 34 and
Figure 24) shows that RDS scenarios 6 and 8 with median flow HFA thresholds,
provide 50% and 100% of allocation for abstraction for the greatest percentage
of time.
Table 34 Abstraction
Availability for RDS Scenarios with 4000l/s HFA Cap
Figure 24 Abstraction
Availability for RDS Scenarios with 4000l/s HFA Cap
The scenario that provides the
highest security of supply in terms of greatest percentage of time above its
HFA threshold and greatest abstraction availability is scenario RDS 5 which
with a median flow HFA threshold, provides 50% and 100% of allocation for
abstraction more than 59% and 53% of the time respectively.
7.2.2.4
Tukituki River at Red Bridge Selected Scenario Abstraction Availability
The Red Br statistics presented
in Table 35 and Table 36 show that river flows are above the median flow HFA
threshold for a greater percentage of time than the mean flow HFA threshold.
Comparing the abstraction
availability for scenarios with the lower HFA cap of 2000l/s (Table 35 and
Figure 25) shows that Red Br scenarios 5 and 7 with median flow HFA thresholds,
provide 50% and 100% of allocation for abstraction for the greatest percentage
of time.
Table 35 Abstraction
Availability for Red Br Scenarios with 2000l/s HFA Cap

Figure 25 Abstraction
Availability for Red Br Scenarios with 2000l/s HFA Cap
Comparing the abstraction
availability for scenarios with the higher HFA cap of 8000l/s (Table 36 and
Figure 26) shows that Red Br scenarios 6 and 8 with median flow HFA thresholds,
provide 50% and 100% of allocation for abstraction for the greatest percentage
of time.
Table 36 Abstraction Availability for Red
Br Scenarios with 8000l/s HFA Cap

Figure 26 Abstraction
Availability for Red Br Scenarios with 8000l/s HFA Cap
The scenario that provides the highest
security of supply in terms of greatest percentage of time above its HFA
threshold and greatest abstraction availability is scenario Red Br 5 which with
a median flow HFA threshold, provides 50% and 100% of allocation for
abstraction more than 67% and 63% of the time respectively.
|
Tukituki River Catchment High Flow
Allocation Modelling Report
|
Attachment 1
|
8 Ecological
Consideration of Scenarios
8.1 FRE3
Analysis
The FRE3 statistic is
a measure of flow variability (being the number of times per year the flow
exceeds three times the median flow) incorporating both a frequency and
intensity component (Harkness 20101).
Clausen & Biggs (1997)
undertook a study to identify the most ecologically relevant hydrological
indices for characterizing hydrological regimes in New Zealand streams (paper
included in Appendix 2). The FRE3 variable was selected to be the
most ecological useful flow variable in New Zealand streams and it was
suggested that FRE3 is the best overall flow index for classifying
habitats of benthic biota (periphyton and invertebrates) in New Zealand streams
and rivers (Clausen & Biggs 1997).
The FRE3 method was
used by Harkness (2008 & 20101) as the ecological basis for the
broad assessment of biological consequences of high flow allocation scenarios
on the Ngaruroro River. The same method has been adopted for analysis on the
Tukituki catchment sites.
8.1.1 Biological
Relevance
The following extract from
Harkness (20101) describes the biological relevance of flood
frequency:
Flood frequency is of biological relevance primarily
by provision of an important flushing function, thereby regulating water
quality parameters and limiting periphyton accrual by sloughing of excessive
periphyton growth.
The percentage of change from the naturalised FRE3
score to the altered flow regime FRE3 score provides a guide as to the
likely impact to instream biological communities from the flow regime change.
Two key theories underlie this assumption:
i) Benthic communities are assembled
according to the existing flow regime, and ‘significant’ changes in the flow
regime are likely to result in significant changes to the biological
composition of those communities.
ii) Benthic communities provide
primary (periphyton) and secondary (macroinvertebrates) energy production
functions, and changes in the abundance or diversity of these organisms can
have wider reaching responses to production and energy flux in the aquatic
environment.
8.1.2 Analysis
of Allocation Scenario FRE3 Values
The modelled flow records (based
on the different allocation scenarios) for each site, have been analysed in
terms of the percentage change to FRE3 from the naturalised records.
A significant change to the value
of FRE3 as a result of a proposed activity (e.g. high flow
allocation) may indicate the risk of a change in the biological community (MfE
1998).
When Harkness (2008 & 20101)
assessed the change to FRE3 flows between the natural and modelled
flow records on the Ngaruroro River, only scenarios which produced a change of
≤10 percent to FRE3 value were supported as potential
allocation regimes, so as to limit the potential impact to benthic communities,
and the impact to the wider aquatic environment. The same criteria was used
for this investigation with only scenarios producing a change of ≤10
percent to FRE3 being supported for further analysis.
Results of the assessments for
each site are presented in Tables and Figures in Sections 8.1.2.1 to 8.1.2.4.
8.1.2.1
Tukipo River at State Highway 50 FRE3
Analysis
Table 37 SH50 Scenario FRE3
Analysis Summary (June to November, 1970-2007)
Figure 27 Percentage Change from SH50
Naturalised FRE3 Value for SH50 Allocation Scenarios
All modelled SH50 allocation
scenarios show less than 10 percent change in the mean and total occurrences of
flows exceeding three times the median flow and to the FRE3 value.
8.1.2.2
Tukituki River at Tapairu Rd FRE3 Analysis
Table 38 Tapairu Rd Scenario FRE3
Analysis Summary (June to November, 1970-2007)
Figure 28 Percentage Change from Tapairu Rd
Naturalised FRE3 Value for Tapairu Rd Allocation Scenarios
All modelled Tapairu Rd
allocation scenarios show less than 10 percent change in the mean and total
occurrences of flows exceeding three times the median flow and to the FRE3
value.
8.1.2.3
Waipawa River at RDS FRE3 Analysis
Table 39 RDS Scenario FRE3
Analysis Summary (June to November, 1970-2007)
Figure 29 Percentage Change from RDS
Naturalised FRE3 Value for RDS Allocation Scenarios
All modelled RDS allocation
scenarios show less than 10 percent change in the mean and total occurrences of
flows exceeding three times the median flow and to the FRE3 value.
8.1.2.4
Tukituki River at Red Bridge FRE3 Analysis
Table 40 Red Br Scenario FRE3
Analysis Summary (June to November, 1970-2007)

Figure 30 Percentage Change from Red Br
Naturalised FRE3 Value for Red Br Allocation Scenarios
All modelled Red Br allocation
scenarios show less than 10 percent change in the mean and total occurrences of
flows exceeding three times the median flow and to the FRE3 value.
8.2
Analysis of Methods against Instream Flow Requirements
The HBRC objectives and policies
set out in the RRMP seek to maintain or improve existing aquatic ecosystems.
Any high flow allocation regime needs to be set in the context of these
instream management objectives and policies (Harkness 20101).
Harkness (20101) lists
three main components that define a flow regime’s ability to support an
ecological community as identified by MfE (1998):
▪ Flow Variability - Variations in flow are important
ecologically and provide processes such as flushing of accumulated sediment,
algae and detritus.
▪ Water Quality - The flow is a significant
determinant of water quality parameters such as dissolved oxygen, nutrients, pH
and toxic contaminants.
▪ Habitat (space and food producing area) - Many
river biota have preferences for certain ranges of water depth and velocity,
i.e. hydraulic habitat. Flow, interacting with the river’s morphology
(cross-section and slope), determines this available hydraulic habitat.
All high flow allocation
scenarios for each site have been assessed in relation to these three ecological
requirements.
8.2.1 Flow
Variability
The frequency of biologically
significant events (freshes or flushing flows) has particular significance to
the duration of periphyton accrual periods and the maintenance of acceptable
water quality (Harkness 20101).
Freshes can also be a functional
requirement for selected fish species, which rely on pulse events such as
migration and spawning cues. Key determinants of the rate and extent of
periphyton accrual are closely related to nutrient supply and flow velocities
(Harkness 20101).
The likely effect of reduced flow
variability in gravel and cobble bed rivers, is an increase in periphyton
biomass which can produce flow-on effects to the river ecosystem (MfE 1998).
Problematic periphyton biomass can accumulate over periods of continuous low
flows which typically occur in Hawke’s Bay during the summer/autumn months.
During the winter/spring months, river levels and flow velocities are
consistently higher than those of the summer low flow period and combined with
lower water temperatures and shorter daylight hours during this period, the
potential for abundant periphyton growth is limited (Harkness 20101).
To limit the potential impact to
ecological values, only scenarios which produced a change of ≤10 percent
to the naturalised FRE3 value, were to be supported as potential
allocation regimes which maintain an acceptable level of flow variability.
Sections 8.1.2.1 to 8.1.2.4
present the mean, total and frequency of flows exceeding three times the median
flow for all allocation scenarios applied to each site. All modelled high flow
allocation scenarios for each site produce minimal change of less than 10% to
the FRE3 value and are therefore supported as potential regimes
under which acceptable flow variability can be maintained in each river.
8.2.2
Maintenance of Water Quality
The high flow allocation
modelling undertaken on the Ngaruroro River by Harkness (2008 & 20101)
looked at the effect of the 8 allocation scenarios (which have been adopted and
adapted for use in this investigation) on water quality of the Ngaruroro
River. The Ngaruroro reports found that the modelled scenarios resulted in a
limited effect on flood frequency and that due to allocation only occurring
when river flows were greater than mean or median flows (depending on the
scenario) adverse impacts to water quality were not anticipated.
An analysis of water quality data
for the Tukituki catchment has not been included in this investigation. The 8
scenarios modelled on each Tukituki catchment site are based on the same
scenarios used in the Ngaruroro investigations (detailed scenario information
can be found in Section 1). It should be noted there are different water
quality issues associated with the Tukituki catchment than with the Ngaruroro
catchment (e.g. effluent discharges from municipal waste water treatment
plants) but given that all of the modelled Tukituki scenarios result in only
minimal changes to the low flow statistics (Section 7.1) and minimal effects to
flood frequency (Section 8.1), as with the Ngaruroro investigation, adverse
impacts to water quality in the Tukituki catchment resulting from the potential
high flow allocation scenarios are also not anticipated.
8.2.3 Habitat
Requirements
8.2.3.1 Instream
Habitat Modelling in the Context of the Naturalised Flow Regime
Instream habitat modelling has
been undertaken on rivers in the Tukituki catchment and documented in a report
by Johnson (2011). The analysis undertaken in this report focuses on how
predicted flow conditions change the amount of available instream habitat for a
range of species in relation to low flow conditions.
The modelling undertaken in this
investigation relates to high flow allocation above mean and median flows so it
is expected that the available instream habitat will be uncompromised by any of
the modelled high flow allocation scenarios for each site.
8.2.3.2 Fish
Passage
The high flow allocation
modelling undertaken on the Ngaruroro River by Harkness (2008 & 20101)
looked at the fish passage requirements for diadromous in the Ngaruroro River.
These investigations found that given the limited variation in flood frequency
and magnitude imposed by the 8 allocation scenarios (which have been adopted
and adapted for use in this investigation), none of the scenarios would be
expected to affect fish passage within the river itself or significantly affect
the river mouth opening regime.
The 8 scenarios modelled on each
Tukituki catchment site are based on the same scenarios used in the Ngaruroro
investigations and given that all of the modelled Tukituki scenarios also
result in minimal effects to flood frequency and magnitude, adverse impacts to
fish passage in the Tukituki River catchment are also not expected.
The Ngaruroro reports recommend
that river mouth openings should be monitored by the Regional Council and that
as far as practicable, the river mouth should be manually kept open during
spring and early summer. It is recommended the same approach to river mouth
openings is adopted for the Tukituki River.
|
Tukituki River Catchment High Flow
Allocation Modelling Report
|
Attachment 1
|
9 Range of
Variability Approach (RVA)
9.1 Overview
The ecological integrity of
riverine ecosystems is dependent upon the natural flow regime of the river
system. Maintaining natural variability in the flow regime is critical for
conserving the structure and function of riverine ecosystems (Sanford et al.
2007).
A method referred to as the Range
of Variability Approach (RVA) described by Richter et al. (1997) has been
developed to comprehensively characterise ecologically relevant attributes of a
flow regime in order to develop flow-based river management targets that
incorporate the concepts of natural hydrological variability and river
ecosystem integrity.
The RVA uses the pre-development natural
variation of 33 hydrological parameters called indicators of hydrologic
alteration (IHAs), as a reference for defining the extent to which natural flow
regimes have been altered (TNC 2009).
The IHA parameters are used to
assess hydrological alteration resulting from anthropogenic activities (e.g.
water abstraction) in terms of magnitude, timing, frequency, duration, and rate
of change (Richter et al. 1996). The IHA parameters provide information on
some of the most ecologically significant features of the flow regime that
influence aquatic ecosystems.
The 33 IHA parameters are divided
into the five major groupings. These are detailed in Table 41 along with their
ecological influences.
The ‘Indicators of Hydrologic
Alteration v7.1’ is a software tool developed by The Nature Conservancy (TNC
2009) which enables users to implement the RVA to assess the degree of
hydrologic alteration attributable to human impacts within a river ecosystem.
The IHA software has been used in
this investigation to assess how the natural flow regime could be affected as a
result of the potential high flow allocation method scenarios (outlined in
Section 1) for each Tukituki catchment site. The IHA software calculates
statistics for each IHA parameter from both the naturalised and eight modelled
flow records for each site. The IHA software produces a scorecard table
presenting the resulting statistics which are compared and summarised in
Section 9.2.
In developing the RVA, Richter et
al. (1997) defines six basic steps for setting, implementing and refining
management targets and rules for a specific river or river reach. The first
three steps relate to characterising the natural hydrological regime of a river
and setting river management targets (environmental goals) to use as design
rules for developing a set of management rules or a management system that will
enable the targeted flow conditions to be met during most, if not all years.
The last three steps are concerned with the implementation of the management system,
monitoring, assessment and revision of the established targets.
In this investigation the RVA
analysis characterises the natural (pre-impact) inter-annual range of
stream-flow variation for each site using the 33 IHA parameters. The range of
natural variation for each IHA parameter is used as a basis for defining the
initial flow management targets. The RVA analysis generates a series of
hydrologic alteration factors which quantify the degree of alteration of the 33
IHA flow parameters in relation to the established targets. The RVA analysis
and results for each site are detailed in Section 9.3.
Richter et al. (1998) states that
using the RVA, river managers strive to keep annual values of each hydrologic
parameter within a targeted range of values that defines some portion or all of
the natural range of variability in the parameters. These RVA management
targets should be based, to the extent possible, on available ecological
information. At the same time, the RVA is meant to enable river managers to
define and adopt readily interim management targets before conclusive,
long-term ecosystem research results are available. Richter et al. (1998)
states that an adaptive management approach, whereby interim management targets
and management actions are prescribed and implemented, system response is
monitored, and management targets and the prescribed flow regime are adjusted
based on monitoring results and ecological research is fundamental to
successful application of the RVA.
The RVA targets used in this
investigation are intended to be used as interim management targets that will
be adjusted and refined in the future.
To undertake the analyses,
datasets were constructed for each site, which combined the naturalised flow
record and modelled flow data for each scenario. The IHA software uses daily
flow data for a sufficiently long hydrological record in order to obtain
reliable pre- vs. post-impact comparisons (TNC 2009). This means one dataset
of continuous flow record is required with a defined break where naturalised
flow ends and altered flow begins, e.g. abstraction starts or a dam is built
etc. (Harkness 20101).
Hydrological datasets have been
constructed for each modelled high flow allocation scenario to analyse with the
IHA software, combining the naturalised flow data with the modelled flow data.
Table 41 Summary of IHA Parameters and
their Ecosystem Influences (Harkness 20101)
9.2
IHA Summary
The IHA software produces a
scorecard table presenting statistics calculated for each IHA parameter, which
compares the naturalised records (pre-impact) to the scenario modelled records
(post-impact) for each Tukituki catchment site.
The IHA scorecard tables produced
for each site are summarised in Sections 9.2.1 to 9.2.4. The IHA analysis was
undertaken using non-parametric (median/percentile) statistics.
The scorecard tables display
statistics for each hydrological parameter:
▪ The median flow value for both the naturalised and
scenario modelled records for each IHA parameter
▪ The deviation factor which represents the deviation of the
modelled record from the naturalised record
▪ The significance count for the deviation values. To
calculate the significance count, the software program randomly shuffles all
years of input data and recalculates (fictitious) pre- and post-impact medians
1000 times. The significance count is the fraction of trials for which the
deviation values for the medians were greater than for the real case. A low
significance count (minimum value is 0) means that the difference between the
pre and post-impact periods is highly significant. A high significance count
(maximum value is 1) means that there is little difference between the pre and
post-impact periods (TNC 2009).
▫ NOTE: The IHA v7.1 user manual (TNC 2009) notes that it
is important to understand that in some infrequent situations the algorithm may
generate very low significance counts when there is very little apparent
difference between the pre and post-impact periods. This can occur when the
deviation factor between the pre and post-impact periods is zero or very small,
and the overall distribution contains a large number of values right at or very
near the centre of the distribution. In this situation a low significance
count actually means that the lack of difference between the two periods is
highly significant, in a statistical sense, because randomly rearranging the
data rarely yield a larger deviation factor than the original data.
The scorecard tables in Sections
9.2.1 to 9.2.4 present the statistics calculated for the following parameter
groups:
▪ Parameter Group 1 - the median monthly flows for the June
to November period
▪ Parameter Group 2 - the median of the minimum and maximum
flows
▪ Parameter Group 4 - the high and low pulse count (The high
pulse threshold for each site is set as close to the naturalised FRE3
(three times the median) threshold as the software will allow
▪ Parameter Group 5 - the rate change of rising and falling
flows
In addition to the scorecard
table, the IHA software also produces a message report, providing details on
any warnings regarding the results produced by the IHA software. Warnings
regarding dates of extreme flows (Parameter Group 3) were given for each site
and as such have been omitted from the IHA analysis in this report.
9.2.1
Tukipo River at State Highway 50 IHA Summary
In terms of median monthly flows,
Table 42 shows that scenarios SH50 5 to 8 (scenarios with a median flow high
flow allocation threshold) show the greatest change from the naturalised
record. Scenarios SH50 6 and SH50 8 produce the highest deviation in median
flow values from the naturalised record and produce deviation factors of up to
0.23 (equivalent of a 23% deviation). SH50 6 and SH50 8 also produce the
lowest significance counts meaning the differences from the naturalised
(pre-impact) flow are the most significant.
In terms of minimum flow
parameters, all scenarios show minimal change. Scenarios SH50 6 and SH50 8
show slightly higher deviation factors combined with low significance counts
for the 30-day maximum, 90-day maximum and base flow index parameters.
Scenarios 1, 3, 5 and 7 show the least significant impact on all group 2
parameters.
The scenarios with the highest
HFA cap of 400l/s (SH50 2, 4, 6 and 8) show the greatest impact on the high
pulse count in terms of deviation factor and significance count. The other
four scenarios show no change in the high flow pulse count.
Overall the least deviation from
the naturalised flow record (<5%) is associated with scenarios SH50 1, 2, 3,
4, 5, and 7.
|
Tukituki River Catchment High Flow
Allocation Modelling Report
|
Attachment 1
|
Table 42 Tukipo
River at State Highway 50 IHA Scorecard Summary
|
|
|
Tukituki River Catchment High Flow
Allocation Modelling Report
|
Attachment 1
|
9.2.2 Tukituki
River at Tapairu Rd IHA Summary
In terms of median monthly flows,
Table 43 shows that scenarios Tapairu Rd 5 to 8 (scenarios with a median flow
high flow allocation threshold) show the greatest change from the naturalised
record. Scenarios Tapairu Rd 6 and 8 produce the highest deviation in median
flow values from the naturalised record and produce deviation factors of up to
0.22 (equivalent of a 22% deviation). Tapairu Rd 6 and 8 also produce the
lowest significance counts meaning the differences from the naturalised
(pre-impact) flow are the most significant.
In terms of minimum flow
parameters, most scenarios show minimal change except for Tapairu Rd 6 and 8
which show low significance counts for the 90-day minimum parameter (0.48 and
0.63 respectively). Scenarios Tapairu Rd 6 and 8 show slightly higher
deviation factors combined with low significance counts for the 30-day maximum,
90-day maximum and base flow index parameters. Scenarios 1, 3, 5 and 7 show
the least significant impact on all group 2 parameters.
The scenarios with the highest
HFA cap of 4000l/s (Tapairu Rd 2, 4, 6 and 8) show the greatest impact on the
high pulse count in terms of deviation factor and significance count. The
other four scenarios show no change in the high flow pulse count.
Overall the least deviation from
the naturalised flow record (<5%) is associated with scenarios Tapairu Rd 1,
2, 3, 4, 5, and 7.
|
Tukituki River Catchment High Flow
Allocation Modelling Report
|
Attachment 1
|
Table 43 Tukituki
River at Tapairu Rd IHA Scorecard Summary
|
|
|
Tukituki River Catchment High Flow
Allocation Modelling Report
|
Attachment 1
|
9.2.3 Waipawa
River at RDS IHA Summary
In terms of median monthly flows,
Table 44 shows that scenarios RDS 5 to 8 (scenarios with a median flow high flow
allocation threshold) show the greatest change from the naturalised record.
Scenarios RDS 6 and RDS 8 produce the highest deviation in median flow values
from the naturalised record and produce deviation factors of up to 0.18
(equivalent of a 18% deviation). RDS 6 and RDS 8 also produce the lowest
significance counts meaning the differences from the naturalised (pre-impact)
flow are the most significant.
In terms of minimum flow
parameters, all scenarios show minimal change. Scenarios RDS 6 and RDS 8 show
slightly higher deviation factors combined with lower significance counts for
the 30-day maximum, 90-day maximum and base flow index parameters. Scenarios
1, 3, 5 and 7 show the least significant impact on all group 2 parameters.
All scenarios impact on the high
pulse count. Scenarios RDS 1, 3, 5 and 7 (HFA cap of 1000l/s) lower the pulse
count with a deviation factor of 0.11 (11%) and raise the high pulse duration
by 8%. Scenarios RDS 2, 4, 6 and 8 (HFA cap of 4000l/s) raise the pulse count
by 11% but also significantly lower the high pulse duration from the
naturalised (pre-impact) flow, producing deviation factors of 0.17 (all four
scenarios) and with low significance counts (≤ 0.32).
Overall the least deviation from
the naturalised flow record (<5%) is associated with scenarios RDS 1, 2, 3,
4, 5, and 7.
|
Tukituki River Catchment High Flow
Allocation Modelling Report
|
Attachment 1
|
Table 44 Waipawa
River at RDS IHA Scorecard Summary
|
|
|
Tukituki River Catchment High Flow Allocation Modelling Report
|
Attachment 1
|
9.2.4 Tukituki
River at Red Bridge IHA Summary
In terms of median monthly flows,
Table 45 shows that scenarios Red Br 5 to 8 (scenarios with a median flow high
flow allocation threshold) show the greatest change from the naturalised
record. Scenarios Red Br 6 and 8 produce the highest deviation in median flow
values from the naturalised record and produce deviation factors of up to 0.19
(equivalent of a 19% deviation). Red Br 6 and 8 also produce the lowest
significance counts meaning the differences from the naturalised (pre-impact)
flow are the most significant.
In terms of minimum flow
parameters, most scenarios show minimal change except for Red Br 6 and 8 which
show low significance counts for the 90-day minimum parameter (0.32 and 0.38
respectively). Scenarios Red Br 6 and 8 show slightly higher deviation factors
combined with low significance counts for the 30-day maximum, 90-day maximum
and base flow index parameters. Scenarios 1, 3, 5 and 7 show the least
significant impact on all group 2 parameters.
All scenarios impact on the high
pulse count. All scenarios result in a deviation factor of 0.14 (14%
deviation) and low significants of less than or equal to 0.37. None of the
eight scenarios alter the high pulse duration.
Overall the least deviation from
the naturalised flow record (<5%) is associated with scenarios Red Br 1, 2,
3, 4, 5, and 7.
|
Tukituki River Catchment High Flow
Allocation Modelling Report
|
Attachment 1
|
Table 45 Tukituki
River at Red Bridge IHA Scorecard Summary
|
|
|
Tukituki River Catchment High Flow Allocation Modelling Report
|
Attachment 1
|
9.3 RVA Summary
As mentioned in Section 9.1, the
RVA analysis characterises the natural (pre-impact) inter-annual range of
stream-flow variation for each site using the 33 IHA parameters. The range of
natural variation for each IHA parameter has been used as a basis for defining
the initial flow management targets (RVA targets).
Richter et al. (1997) refers to
the management target for any given parameter being expressed as a range of
acceptable values with lower and upper boundaries.
In the RVA analysis, the full
range of naturalised flow records (pre-impact data) for each parameter is
divided into three different categories, low high and middle. The boundaries
between these categories are based on percentile values which are specified by
the user.
As with the work undertaken on
the Ngaruroro River by Harkness (2008 & 20101), non-parametric
RVA analyses were undertaken using the IHA software default category boundaries
set at 17 percentiles above and below the median. This produces three
categories of equal size: the lowest category contains all values less than or
equal to the 33rd percentile and the highest category contains all values
greater than the 67th percentile. The middle category represents the RVA
target range for each parameter, containing all values falling in the range of
the 34th to 67th percentiles (lower and upper boundaries respectively). These
RVA targets are intended to be used as interim management targets that will be
adjusted and refined in the future based on further monitoring and research.
The IHA software computes the
expected frequency with which the post impact (modelled data) values of the IHA
parameters should fall into each category (i.e. 33% for each of the three
categories in this case). The frequency with which the post-impact values
actually fall within the categories (referred to as the observed frequency) is
computed. A Hydrologic Alteration factor based on the observed and expected
frequencies is calculated for each category (TNC 2009) as:
(Observed
Frequency - Expected Frequency) / Expected Frequency
A positive Hydrologic Alteration
factor means that the frequency of values in the category has increased from
the pre-impact to post-impact data. A negative value means it has decreased
(Harkness 20101).
The degree of hydrologic
alteration, D, can be expressed as a percentage, (Shiau & Wu 2004):
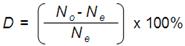
Where:
No = observed
number of post-impact years for which the value of the hydrologic parameter
falls within the RVA target range
Ne = expected
number of post- impact years for which the parameter value falls within the RVA
target range.
Richter et al. (1998) developed a
system to classify the degree of hydrologic alteration (also adopted by Shiau
& Wu 2004). The range of possible (absolute) average values for the degree
of hydrologic alteration (0–100%) was divided into three classes of equal
range:
1) Low degree of alteration = 0-33% representing little or no
alteration
2) Moderate degree of alteration = 34-67%
3) High degree of alteration = 68-100%
A second stage of classification
has been used by Shiau & Wu (2004) which defines the degree of overall
alteration based on the D values of all the 33 IHA parameters:
1) Overall low alteration = the degree of hydrologic alteration of each
IHA belongs to the low alteration category; i.e. the D values of all IHAs are
less than 33%.
2) Overall medium alteration = at least one of the 33 IHAs belongs to
the moderate degree of hydrologic alteration category but none belongs to the
high alteration category.
3) Overall high alteration = at least one IHA belongs to the high
degree of hydrologic alteration category.
In this investigation it is
proposed that both stages of classification are trialled to assess the
suitability of all high flow allocation scenarios for each site.
An ideal high flow allocation
scenario would result in the modelled (post-impact) flow regime attaining the
target ranges at the same frequency as that which occurred in the natural
(pre-impact) flow regime.
Using the two-stage
classification system, a suitable high flow allocation scenario would be one
where the 33 IHA parameters are not significantly altered, producing a low
degree of overall hydrologic alteration where the disturbance to the structure
and function of the riverine ecosystem is minimal.
The RVA analyses of the eight
potential high flow allocation scenarios for each site are summarised
(including tables detailing the hydrologic alteration percentage and class) in
Sections 9.3.1 to 9.3.4.
The RVA analysis results tables
present the statistics calculated for the following parameter groups:
▪ Parameter Group 1 - the median monthly flows for the June
to November period
▪ Parameter Group 2 - the median of the minimum and maximum
flows
▪ Parameter Group 4 - the high and low pulse count (The high
pulse threshold for each site is set as close to the naturalised FRE3
(three times the median) threshold as the software will allow
▪ Parameter Group 5 - the rate change of rising and falling
flows
As with the IHA analysis detailed
in Section 9.2 the IHA software produced warning messages relating parameter
group 3 for each site and as such have been omitted from the RVA analysis in
this report.
9.3.1
Tukipo River at State Highway 50 RVA Summary
The results of the RVA analysis
in Table 46 show that scenarios SH50 1, 3, 4, 5 and 7 produce the least impact
on the natural flow regime with a low degree of hydrologic alteration for all
IHA parameters. The percentages of hydrologic alteration for these scenarios
for all IHA parameters were within +/- 33%. These five scenarios are therefore
classed as having overall low alteration.
Scenarios SH50 2, 6 and 8 fell
within the overall medium alteration class. Scenario SH50 2 results in a
moderate degree of alteration to the July median flow parameter. Scenario SH50
6 had three IHA parameters classified as moderate degrees of alteration
(October flow, 90-day maximum flow and fall rate parameters). Scenario 8
results in moderate hydrologic alteration to the October flow, 90-day minimum
flow and 90-day maximum flow parameters.
In terms of the average
percentage of hydrologic alteration for all parameters, scenarios SH50 1, 3, 4,
5 and 7 show lowest percentage of alteration (≤10%).
Table 46 SH50
RVA Analysis Summary
9.3.2
Tukituki River at Tapairu Rd RVA Summary
The results of the RVA analysis
in Table 47 show that scenarios Tapairu Rd 1-4 (all scenarios with mean flow
high flow allocation thresholds) produce the least impact on the natural flow
regime with a low degree of hydrologic alteration for all IHA parameters. The
percentages of hydrologic alteration for these scenarios for all IHA parameters
were within +/- 33%. These four scenarios are therefore classed as having
overall low alteration.
Scenarios Tapairu Rd 5-8 fell
within in the overall medium alteration class. Scenario Tapairu Rd 6 produces
the greatest degree of alteration to the IHA parameters. Three IHA parameters
(June flow, October flow and fall rate) result in percentage of alteration
between +/- 50%.
Scenarios Tapairu Rd 5 and 7
result in moderate alteration to the June and September flow parameters and
Tapairu Rd 8 shows a moderate alteration to only the August flow parameter.
In terms of the average
percentage of hydrologic alteration for all parameters, scenarios Tapairu Rd 1,
2, 3, 4, 5 and 7 show lowest percentage of alteration (<10%).
Table 47 Tapairu
Rd RVA Analysis Summary
9.3.3
Waipawa River at RDS RVA Summary
The results of the RVA analysis
in Table 48 show that scenarios RDS 1-4 and RDS 7 produce the least impact on
the natural flow regime with a low degree of hydrologic alteration for all IHA
parameters. The percentages of hydrologic alteration for these scenarios for
all IHA parameters were within +/- 33%. These five scenarios are therefore
classed as having overall low alteration.
Scenarios RDS 5, 6 and 8 are
placed in the overall medium alteration class. RDS 5 shows a moderate
alteration to only the September flow parameter. Scenarios RDS 6 and 8 result
in moderate hydrologic alteration to the July flow, October flow and 30-day
maximum flow parameters.
In terms of the average
percentage of hydrologic alteration for all parameters, scenarios RDS 1, 2, 3,
4, 5 and 7 show the lowest percentage of alteration (≤10%).
Table 48 RDS
RVA Analysis Summary
9.3.4
Tukituki River at Red Bridge RVA Summary
The results of the RVA analysis
in Table 49 show that scenarios Red Br 1-4 (all scenarios with mean flow high
flow allocation thresholds) and Red Br 5 and 7 (scenarios with a median flow
high flow allocation threshold and lowest allocation limit of 2000l/s) produce
the least impact on the natural flow regime with a low degree of hydrologic
alteration for all IHA parameters.
Scenario Red Br 8 which allocates
33% of flow above the median with the highest HFA cap of 8000l/s fell within
the overall medium alteration class and results in the moderate alteration of
five IHA parameters; July, August and October flows; the 90-day maximum flow
and fall rate parameter. Scenario Red Br 6 is placed in the overall high
alteration class due to producing a high degree of alteration to the fall rate
parameter. Three other parameters for this scenario also result in moderate
alteration; the August flow, 90-day maximum flow and rise rate.
In terms of the average
percentage of hydrologic alteration for all parameters, scenarios Red Br 1, 2,
3, 4, 5 and 7 show the lowest percentage of alteration (<10%).
Table 49 Red
Br RVA Analysis Summary
1
|
Tukituki River Catchment High Flow
Allocation Modelling Report
|
Attachment 1
|
10 Discussion
This
investigation assesses the effect of different potential methods of water
allocation during high river flows within the winter and spring months of June
to November, from four established hydrological sites on rivers in the Tukituki
Catchment (Figure 2 Section
5.1):
▪ Tukipo River at State Highway 50
▪ Tukituki River at Tapairu Rd
▪ Waipawa River at RDS
▪ Tukituki River at Red Bridge
Eight different high flow
allocation scenarios developed for each site have
been assessed in terms of providing a sustainable flow (high flow allocation
threshold) above which high flow allocation is made available, combined with a
sustainable allocation limit (allocation cap) allowing for abstraction without
adversely impacting on flow variability and instream ecological requirements,
while providing an optimum security of supply.
The high flow allocation scenarios use high flow allocation
thresholds (HFA thresholds) set as either mean or median flow combined with
either of two selected high flow allocation caps (HFA caps) for each site. A flow
sharing approach has been used in all scenarios where either 50% or 33% of flow
above the HFA threshold up to the HFA cap is allocated for abstraction, with
the rest (50% or 67% respectively) remaining in the river.
Hydrological analyses identified
minor variations between the naturalised and modelled flow records for each
high flow allocation scenario. Allocation scenarios with a median flow HFA
threshold produced the greatest change (although still ≤17.5%) to all key
hydrological statistics.
The availability of water for
abstraction under each allocation scenario was assessed. The quantity of the
allocation that can be utilised for abstraction depends on the duration and
magnitude of high river flows.
The potential security of supply
to water users provided by each high flow allocation scenario was assessed in
terms of the percentage of time water is available for abstraction. All
scenarios with median flow HFA thresholds provide water available for
abstraction for a greater percentage of time than scenarios with mean flow HFA
thresholds. Therefore all scenarios with median flow HFA thresholds provide
high flow allocations with the greatest security of supply to water users.
The FRE3 flood frequency
has been identified as the most ecologically relevant hydrological index for
characterizing hydrological regimes in New Zealand streams and rivers (Clausen
& Biggs 1997). An ecologically based analysis was undertaken which
assessed the change to FRE3 between the natural and modelled flow
records.
To limit the potential impact to
benthic communities and to the wider aquatic environment, criteria was employed
from previous studies where only scenarios producing a change to the FRE3
of less than or equal to 10 percent, were supported as potential allocation
regimes and suitable for further analysis.
The FRE3 analyses
showed that all of the modelled potential high flow allocation scenarios for
each site alter the FRE3 by less than 10 percent and were therefore
supported as potential allocation regimes.
An analysis based on the Range of
Variability Approach (RVA) developed by Richter et al. (1997) was undertaken to
assess the degree of hydrologic alteration between the naturalised (pre-impact)
and scenario modelled (post-impact) flow records in relation to 33 hydrological
parameters (IHA parameters).
Two previously developed systems
to classify the degree of hydrologic alteration for each IHA parameter and the
degree of overall alteration by each scenario have been trialled and applied to
the RVA results.
Both systems of classification
are relatively simple to apply to the RVA results. Both systems use a three
class scheme by which to classify the degree of hydrologic alteration, but a
three class scheme could be considered too simplified (Shiau & Wu 2004). A
more comprehensive and effective scheme could be based on the continuous
variation of hydrologic alteration. Consideration also needs to be given to
the importance of each individual IHA parameter to identify if more weight
should be given to certain parameters when classifying a potential allocation
method.
Irrespective of what
classification scheme is used or developed in the future, for any river, it is
essential to establish the key river values that require protection and
identify the level of change to the natural flow regime or degree of hydrologic
alteration that must not be exceeded in order to maintain and sustain the
required protection of river values.
Until establishing the degree of
hydrologic alteration and the level of change to the natural flow regime that
will sustain and maintain the protection of key values for rivers in the
Tukituki Catchment, a conservative approach to selecting the most preferable
allocation methods from those modelled in this investigation is necessary. In
terms of hydrologic alteration, scenarios which produced the lowest average
percentage of hydrologic alteration (≤10%) were considered as potentially
suitable allocation methods.
|
Tukituki River Catchment High Flow
Allocation Modelling Report
|
Attachment 1
|
11 Conclusion
Based on the results of the
hydrological and ecological analyses and the assessment of security of supply
to water users, the most suitable high flow allocation scenarios for each site
have been selected in terms of those which produced the least amount of change to
the natural flow regime (where the disturbance to the structure and function of
the riverine ecosystem is minimal) while providing a high flow allocation with
the greatest security of supply to water users:
▪ Tukipo
River at State Highway 50
Scenarios SH50
1, 3, 5 and 7 with the lower HFA cap of 100l/s and scenario SH50 4 with the
higher HFA cap of 400l/s, result in the least overall deviation (IHA analysis)
and hydrologic alteration from the naturalised flow record (RVA analysis).
These five scenarios also result in minimal change to all key hydrological
statistics and minimal change to the FRE3 flood frequency from the
naturalised flow record. SH50 scenarios with median flow HFA thresholds have
been identified as providing the greatest security of supply to water users.
Taking into
account all analyses undertaken as part of this investigation, the high flow
allocation scenario which provides the greatest security of supply with the
least change to the natural flow regime for the Tukipo River at State Highway
50 is scenario SH50 5 (If river flow is greater than median, then 50% of flow
above the median is allocated up to a maximum of 100l/s).
▪ Tukituki
River at Tapairu Rd
All scenarios
with allocation flow thresholds set at mean flow (Tapairu Rd 1, 2, 3 and 4)
plus scenarios Tapairu Rd 5 and 7 (median flow HFA threshold and lower HFA cap
of 1000l/s) result in the least overall deviation and hydrologic alteration
from the naturalised flow record. Although two of the monthly IHA parameters
produce slightly higher degrees of hydrologic alteration, the average degree of
alteration for all parameters is relatively low and of similar value to the
mean HFA threshold scenarios. These six scenarios also result in minimal
change to all key hydrological statistics and minimal change to the FRE3
flood frequency from the naturalised flow record. Tapairu Rd scenarios with
median flow HFA thresholds have been identified as providing the greatest
security of supply to water users.
Taking into
account all analyses undertaken as part of this investigation, the high flow
allocation scenario which provides the greatest security of supply with the
least change to the natural flow regime for the Tukituki River at Tapairu Rd is
scenario Tapairu Rd 5 (If river flow is greater than median, then 50% of flow
above the median is allocated up to a maximum of 1000l/s).
▪ Waipawa
River at RDS
All scenarios
with allocation flow thresholds set at mean flow (RDS 1, 2, 3 and 4) plus scenarios
RDS 5 and 7 (median flow HFA threshold and lower HFA cap of 1000l/s) result in
the least overall deviation and hydrologic alteration from the naturalised flow
record. These scenarios also result in minimal change to all key hydrological
statistics and minimal change to the FRE3 flood frequency from the
naturalised flow record. RDS scenarios with median flow HFA thresholds have
been identified as providing the greatest security of supply to water users.
Taking into
account all analyses undertaken as part of this investigation, the high flow
allocation
scenario which provides the greatest security of supply with the least change
to the natural flow regime for the Waipawa River at RDS is scenario RDS 5 (If
river flow is greater than median, then 50% of flow above the median is
allocated up to a maximum of 1000l/s).
▪ Tukituki
River at Red Bridge
All scenarios
with allocation flow thresholds set at mean flow (Red Br 1, 2, 3 and 4) plus
scenarios Red Br 5 and 7 (median flow HFA thresholds and lower HFA cap of
2000l/s result in the least overall deviation and hydrologic alteration from
the naturalised flow record. These scenarios also result in minimal change to
all key hydrological statistics and minimal change to the FRE3 flood
frequency from the naturalised flow record. Red Br scenarios with median flow
HFA thresholds have been identified as providing the greatest security of
supply to water users.
Taking into
account all analyses undertaken as part of this investigation, the high flow
allocation scenario which provides the greatest security of supply with the
least change to the natural flow regime for the Tukituki River at Red Bridge is
scenario Red Br 5 (If river flow is greater than median, then 50% of flow above
the median is allocated up to a maximum of 2000l/s).
The details of the four scenarios
selected as the most suitable for each site are presented in Table 50.
Table 50 Selected
High Flow Allocation Scenarios
The high flow allocation
scenarios modelled in this investigation are all based on a 50% flow share
approach. A flow sharing approach enables water to be abstracted from a river
whilst maintaining a level of flow variability in the river. The
practicalities of implementing high flow allocation methods based on a flow
sharing approach need to be carefully considered. One possible approach could
be to issue global water take consents to water user groups (instead of the
current allocation process which issues consents to individual water users)
whereby the abstraction is managed collectively by the group, employing
measures such as rationing and rostering to ensure abstraction complies with
any abstraction restrictions.
Alternative approaches to high
flow allocation which do not include any flow sharing arrangements may pose
fewer difficulties to management practices. Further work would be required to
assess the impact on natural river flow regimes of any alternative approaches.
Before undertaking further
hydrological and ecological analyses on any alternative high flow allocation
methods, the regulatory tools that are currently available to implement and
manage high flow allocation need to be identified and assessed to ultimately
determine what type of high flow allocation methods can realistically be
implemented and managed effectively.
1
|
Tukituki River Catchment High Flow
Allocation Modelling Report
|
Attachment 1
|
12 Recommendations
The RVA management targets should
be based, to the extent possible, on available ecological information and allow
a degree of flexibility to accommodate human uses (Richter et al. 1997). In
this investigation the default IHA software settings for the RVA targets have
been used. These targets are intended to be used as interim management targets
that will be adjusted and refined in the future based on further monitoring and
research.
It is recommended that a
‘management team’ or ‘expert panel’ should be established to set the
appropriate management targets for each IHA parameter for rivers and streams in
Hawke’s Bay. In addition to the management targets, the acceptable degree of
hydrologic alteration to each IHA parameter and the acceptable level of change
to all relevant key hydrological and ecological indices must also be determined
before assessing any potential high flow allocation regimes in the future.
A values assessment should be
undertaken to establish the key river values that require protection in the
Tukituki catchment (plus any catchments where water is or has the potential to
be allocated for abstraction) and identify the level of change to the natural
flow regime or degree of hydrologic alteration that must not be exceeded in
order to maintain and sustain the required protection of river values.
Once management targets, key
river values and levels of acceptable change have been established, it is
recommended that other combinations of high flow allocation regimes should be
modelled and assessed to find the scenario for each Tukituki site that provides
the optimum level of sustainable allocation (that does not adversely impact on flow variability and
instream ecological requirements) with an optimum security of water
supply.
Detailed security of water supply
analyses are recommended to be undertaken in conjunction with future allocation
regime modelling to aid in the selection of optimum allocation regimes.
It would prove useful and likely
cost-effective to develop a tool for identifying the optimum high flow
allocation regime for a river due to the potentially large amount of time and
resources that would be required to manually model enough combinations of
allocation thresholds, limits etc. from which an optimum allocation regime
could be identified.
The regulatory tools that are
currently available to implement and manage high flow allocation need to be
identified and assessed to determine what type of high flow allocation methods
can realistically be implemented and managed effectively.
|
Tukituki River Catchment High Flow
Allocation Modelling Report
|
Attachment 1
|
1
|
Tukituki River Catchment High Flow
Allocation Modelling Report
|
Attachment 1
|
13 REFERENCES
Clausen, B & Biggs, JB 1997,
Relationships between Benthic Biota and Hydrological Indices in New Zealand
Streams, Freshwater Biology, vol. 38, no. 2, pp 327-342.
Intergovernmental Panel on
Climate Change (IPCC) 2007, Climate Change 2007: Impacts, Adaptation and
Vulnerability - Contribution of Working Group II to the Fourth Assessment
Report of the Intergovernmental Panel on Climate Change, Cambridge
University Press, Cambridge, UK.
Harkness, M 2008, Ngaruroro
River High Flow Allocation, Report prepared for Hawke’s Bay Regional
Council by MWH, Wellington.
Harkness, M 20101, Ngaruroro
River High Flow Allocation: June to November Period. Prepared for Hawkes Bay
Regional Council, MWH, Wellington.
Harkness, M 20102, Flow
Naturalisation for Six Hawke’s Bay Catchments: Tutaekruri, Waipawa, Tukipo,
Tukituki, Maraetotara and Porangahau. Prepared for Hawkes Bay Regional Council,
MWH, Wellington.
Hawke’s Bay Regional Council 2006, Hawke’s Bay Regional Resource
Management Plan (RRMP), Environmental Management Group Technical Report,
Operative 28 August 2006.
Johnson, K 2011, Tukituki Catchment Instream Flow Assessments, Hawke’s
Bay Regional Council - Environmental
Management Group Technical Report.
MfE 1998, Flow Guidelines for
Instream Values Part A & B, Ministry for the Environment, Wellington.
Richter, BD, Baumgartner, JV,
Powell, J & Braun, DP 1996, A Method for Assessing Hydrologic Alteration
within Ecosystems, Conservation Biology, vol. 10, no. 4, pp 1163-1174.
Richter, BD, Baumgartner, JV,
Wigington, R & Braun, DP 1997, How Much Water Does a River Need?,
Freshwater Biology, vol. 37, no. 1, pp 231-249.
Richter, BD, Baumgartner, JV,
Braun, DP & Powell, J 1998, A Spatial Assessment of Hydrologic
Alteration within a River Network, Regulated Rivers: Research and
Management vol. 14, no. 4, pp 329-340.
Sanford, SE,
Creed, IF, Tague, CL, Beall, FD & Buttle, JM 2007, Scale-dependence of
natural variability of flow regimes in a forested landscape, Water
Resources Research, vol. 43, W08414, doi:10.1029/2006WR005299.
Shiau, JT & Wu, FC 2004, Feasible
Diversion and Instream Flow Release Using Range of Variability Approach,
Journal of Water Resources Planning And Management, vol. 130, no. 5, pp
395-404.
The Nature Conservancy (TNC)
2009, Indicators of Hydrologic Alteration Version 7.1 User’s Manual
|
Tukituki River Catchment High Flow
Allocation Modelling Report
|
Attachment 1
|
|
Tukituki River Catchment High Flow
Allocation Modelling Report
|
Attachment 1
|
APPENDIX 1
1
|
Tukituki River Catchment High Flow
Allocation Modelling Report
|
Attachment 1
|
Hawke’s Bay Regional Resource Management Plan 2006 Table
9 - Minimum Flow and Allocatable Volumes for Specific Rivers
|
Tukituki River Catchment High Flow
Allocation Modelling Report
|
Attachment 1
|
APPENDIX 2
|
Tukituki River Catchment High Flow
Allocation Modelling Report
|
Attachment 1
|
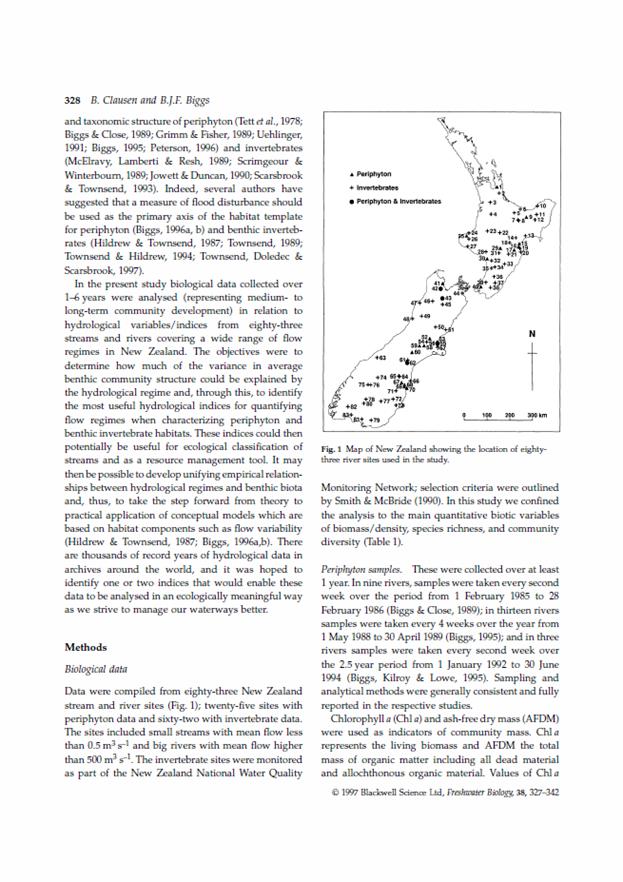
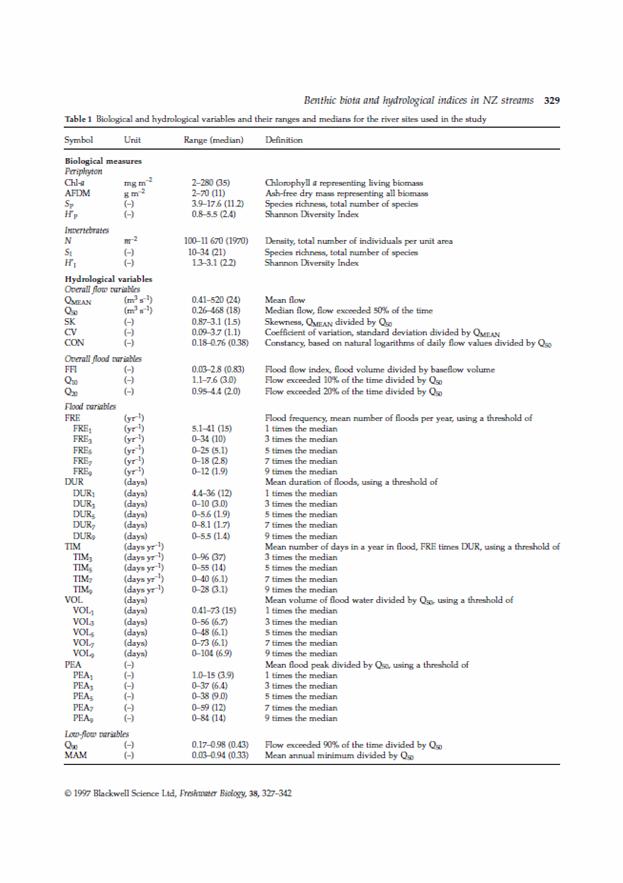
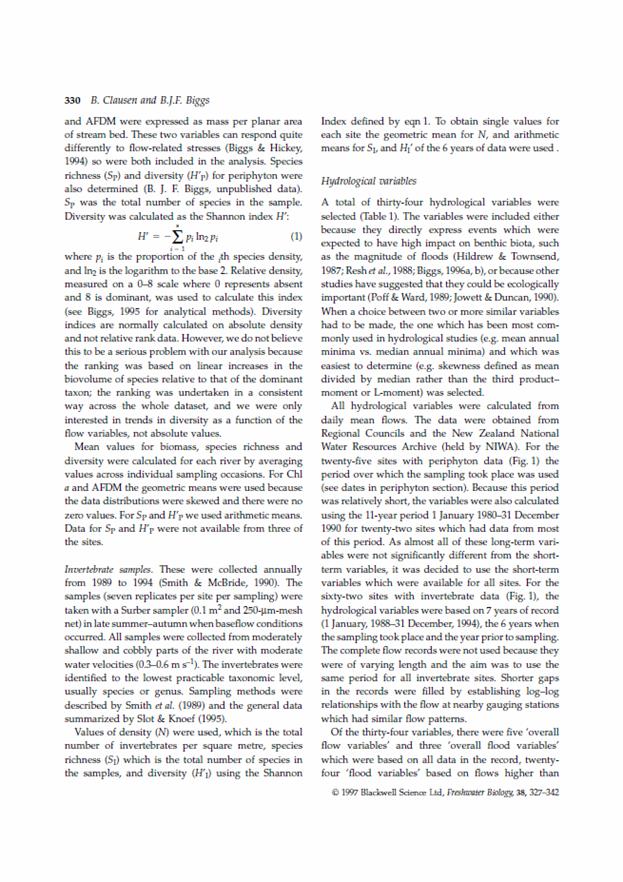
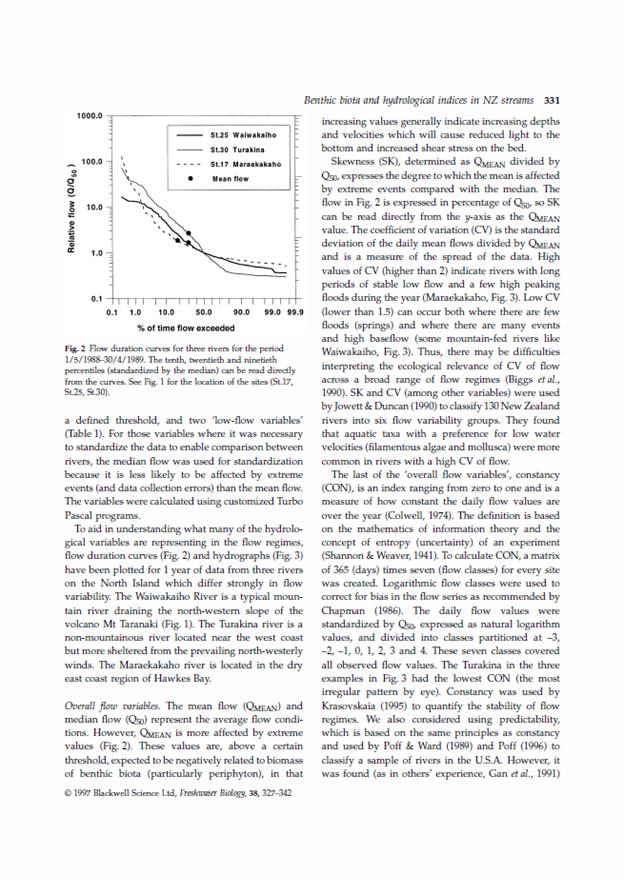
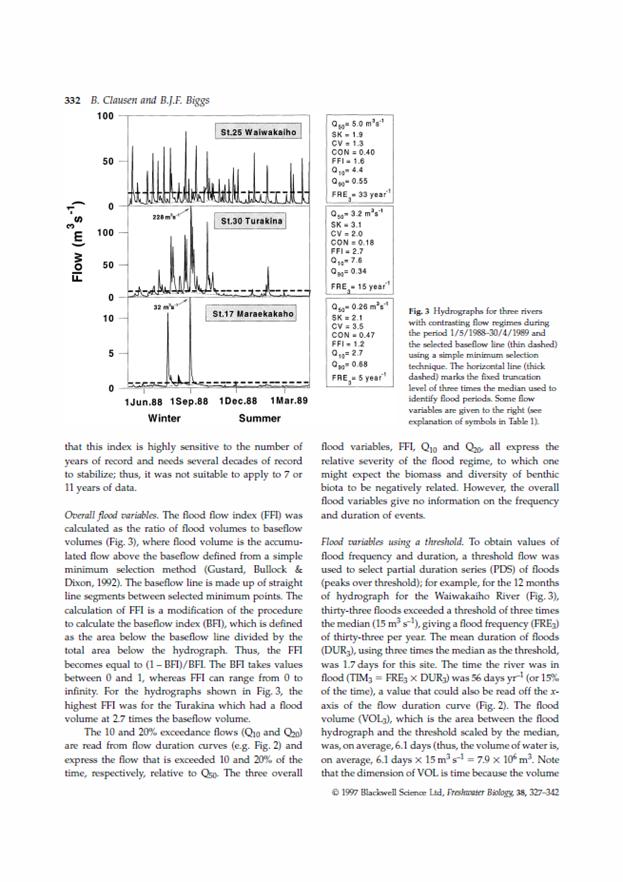
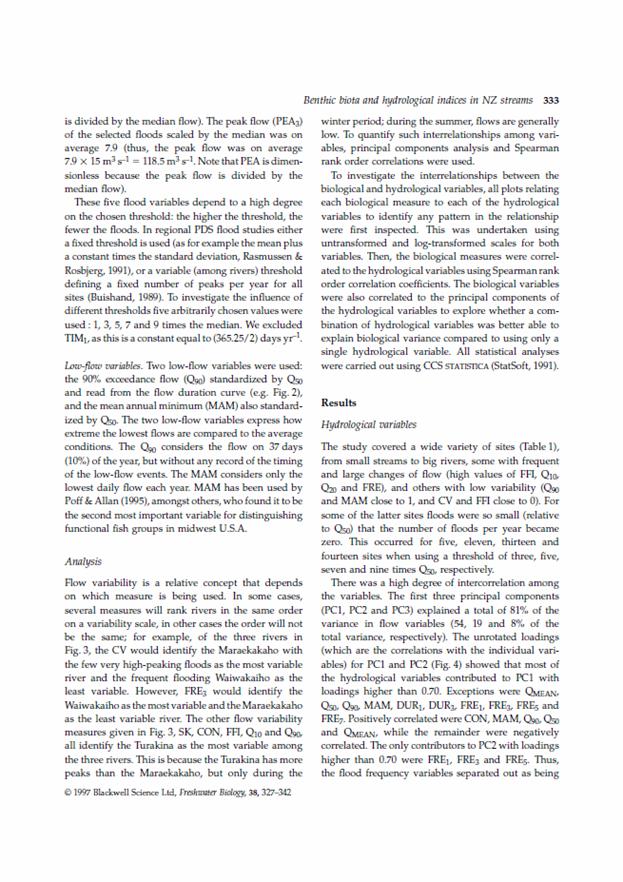
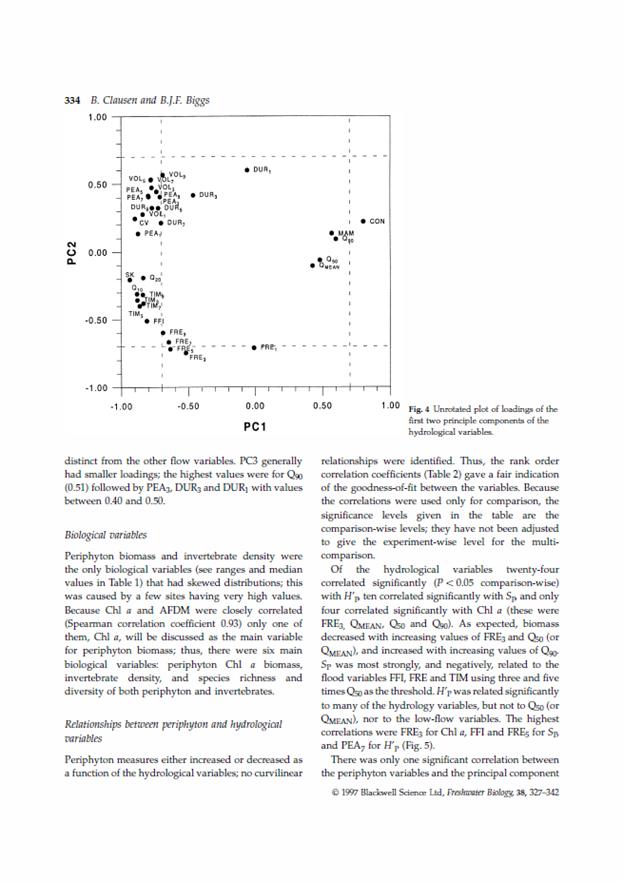
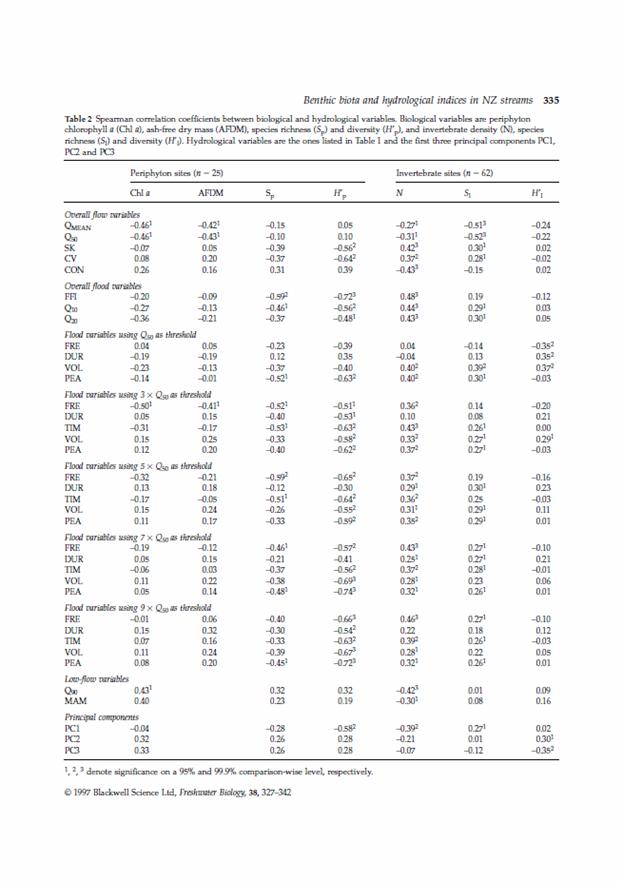
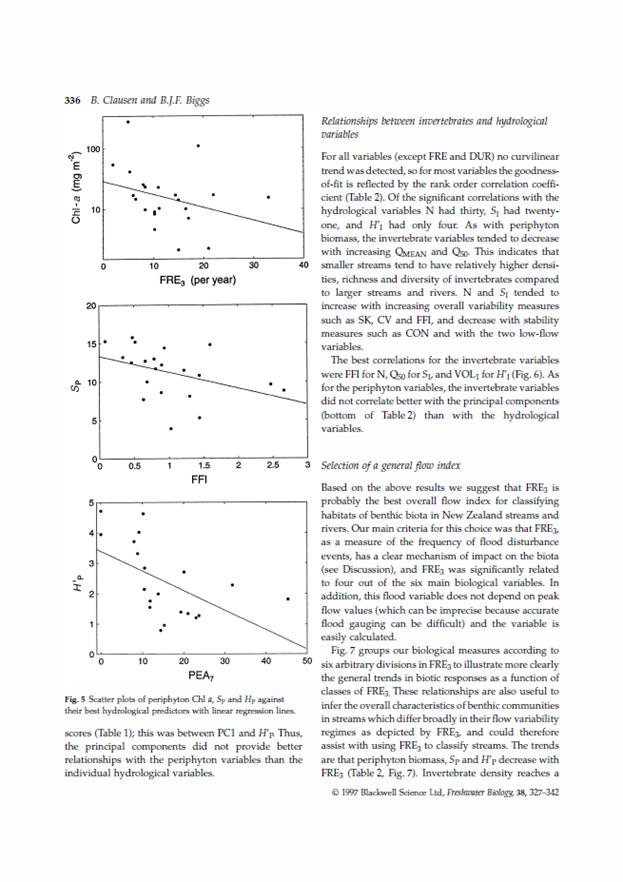
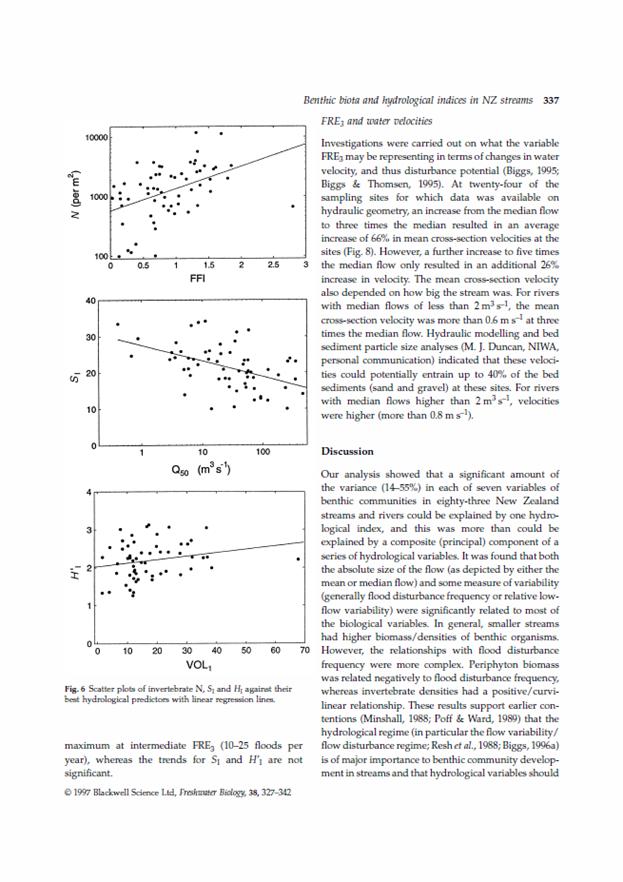
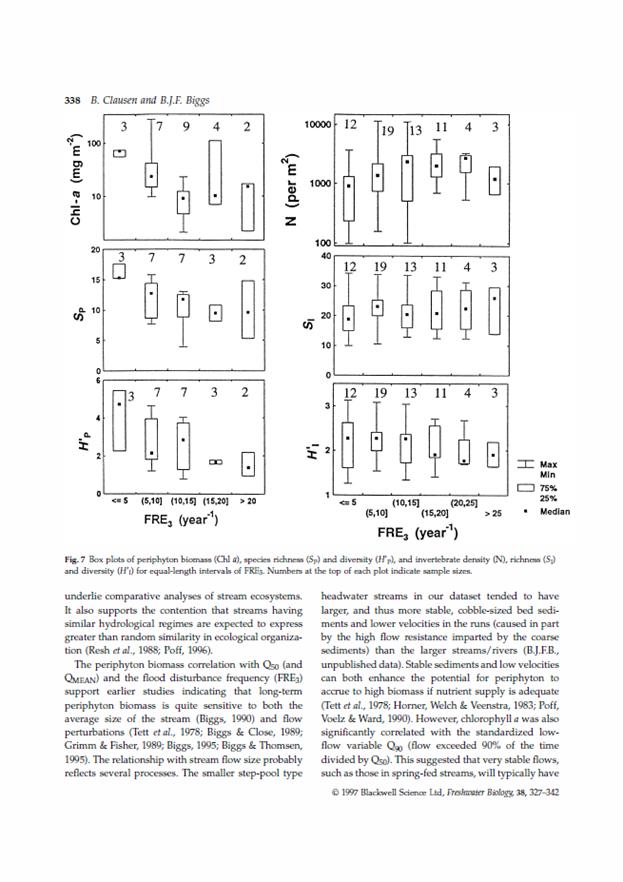
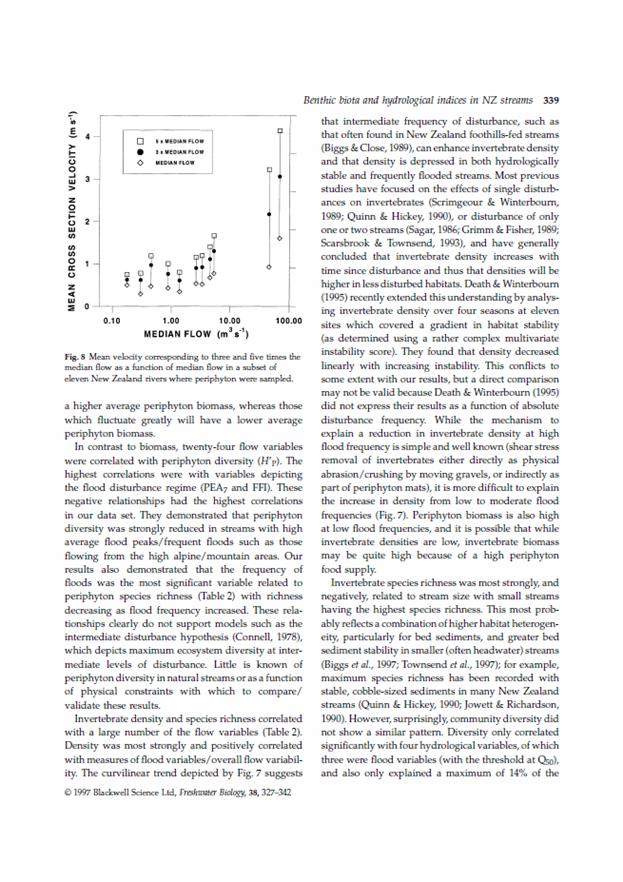
Allocatable volume (RRMP definition): The volume of water flow available
for out-of-stream use e.g. irrigation. It is the volume of the total river flow
available over a set period (e.g. the average daily flow or average seven day
flow) that may be abstracted from a river or stream without causing the minimum
flow to occur so often as to cause a continuing change in the nature of the aquatic ecosystem.
Q95: This is the flow that is exceeded 95 percent of the time.